Metrics
148
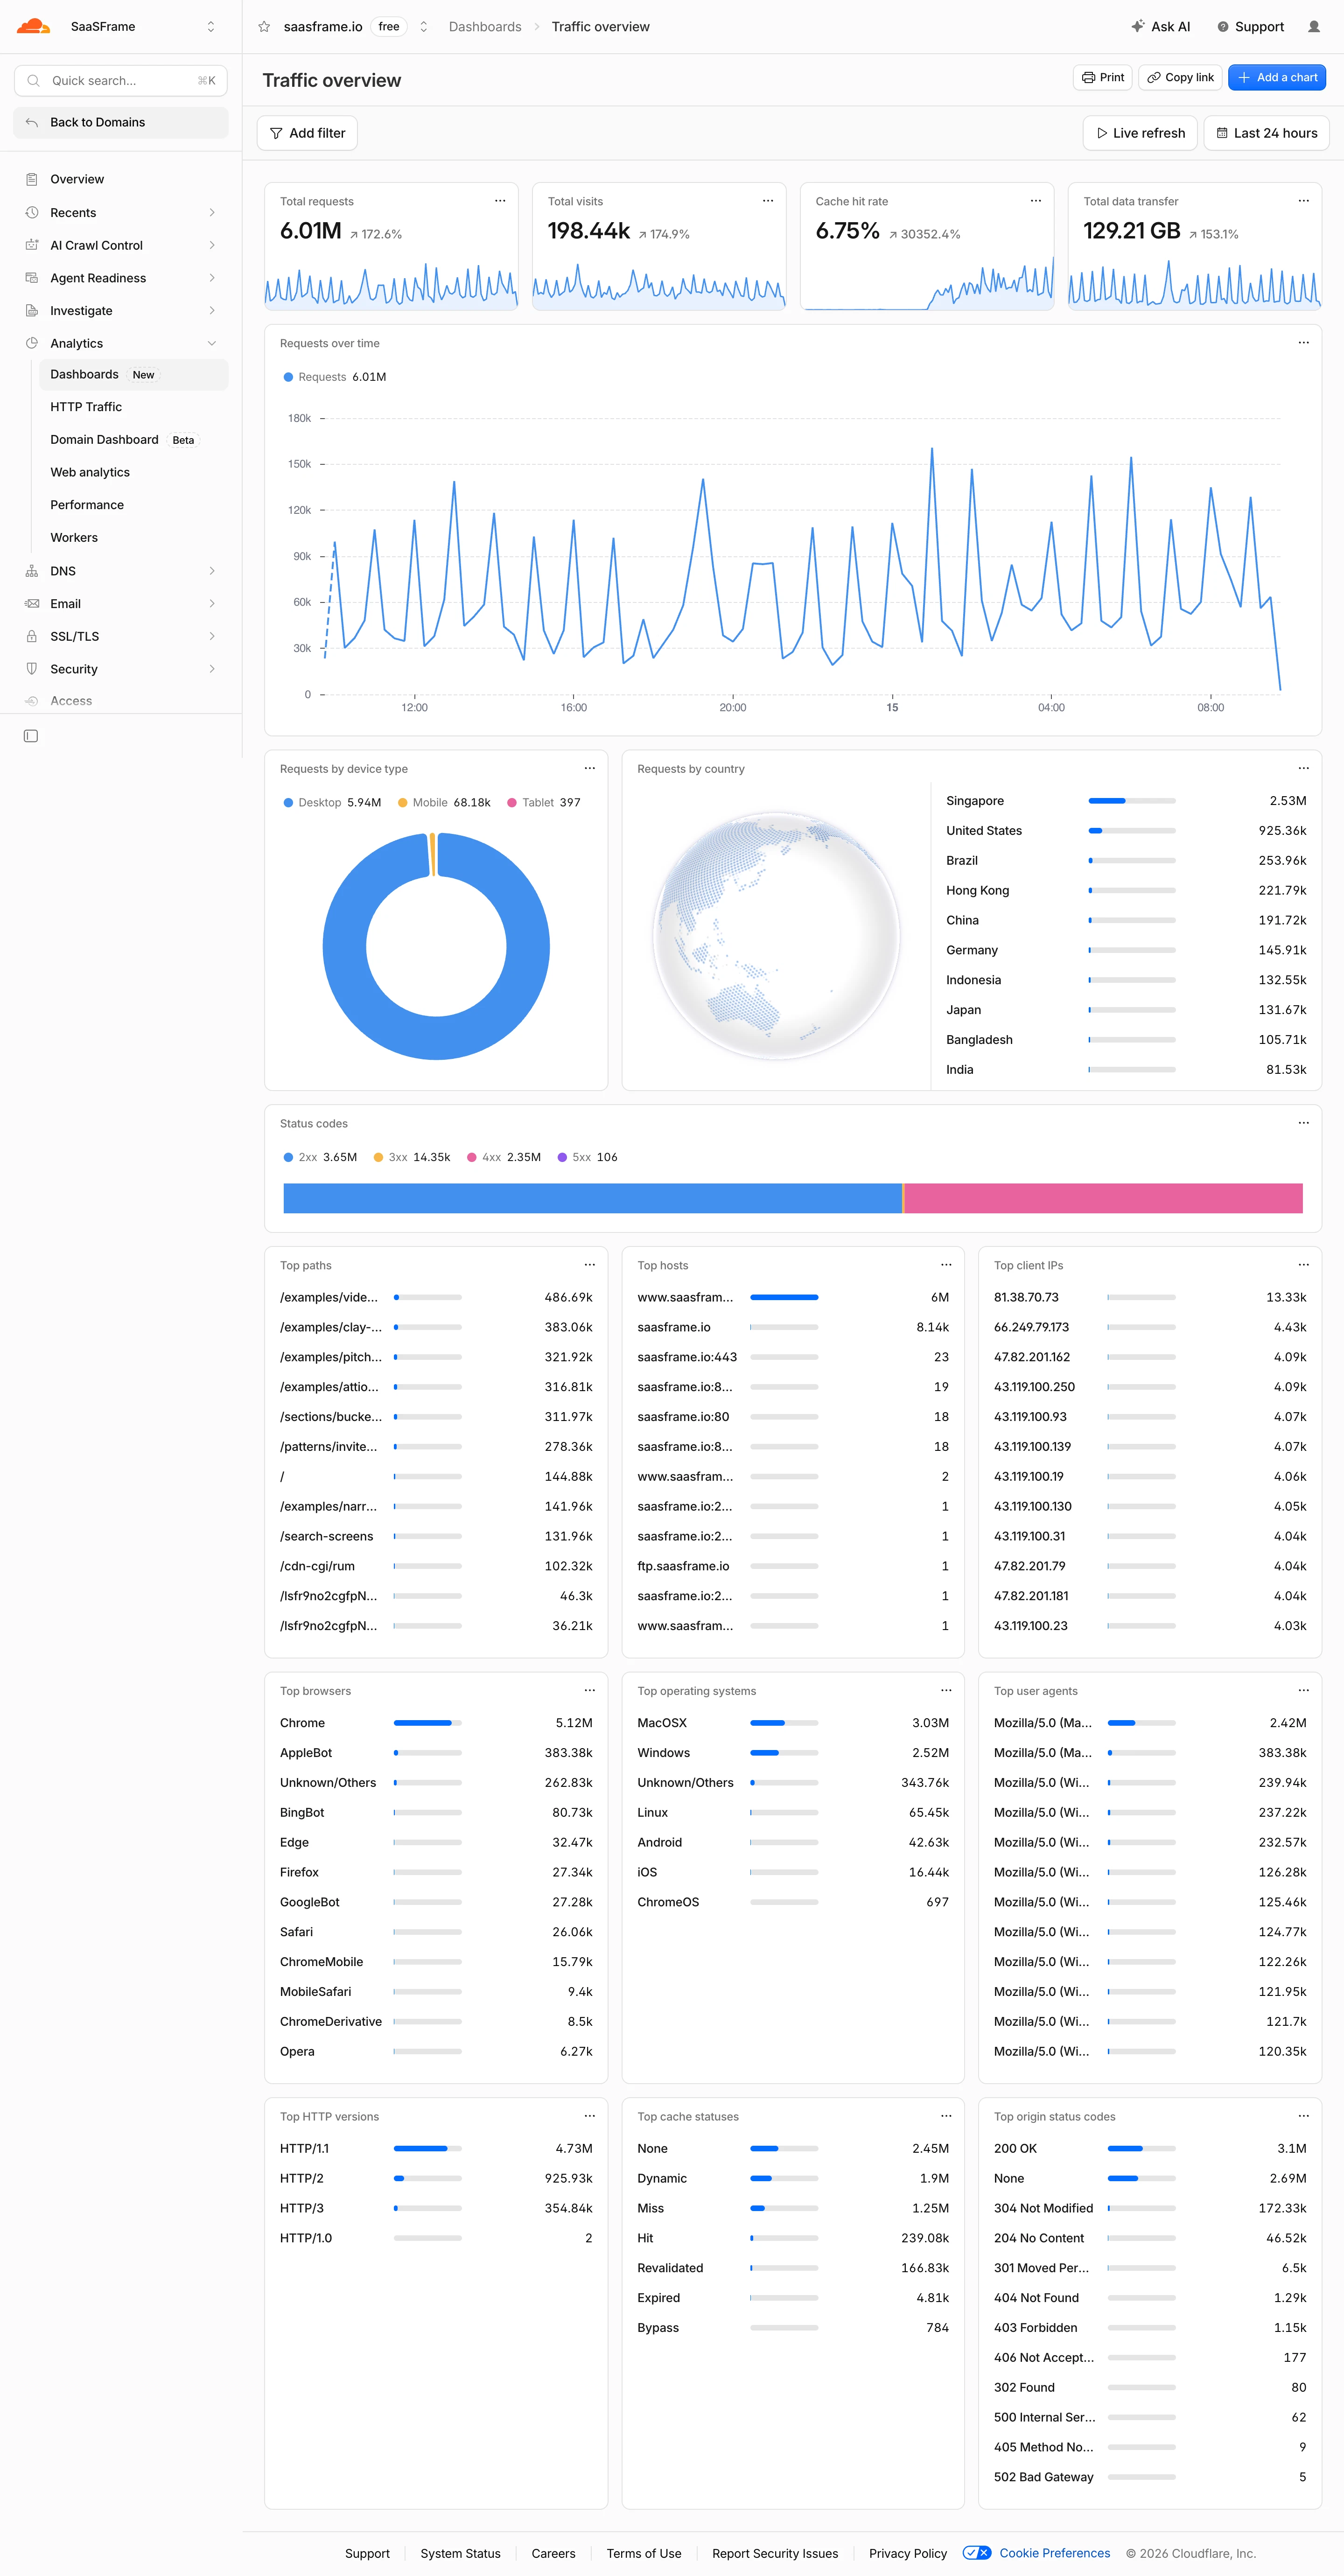
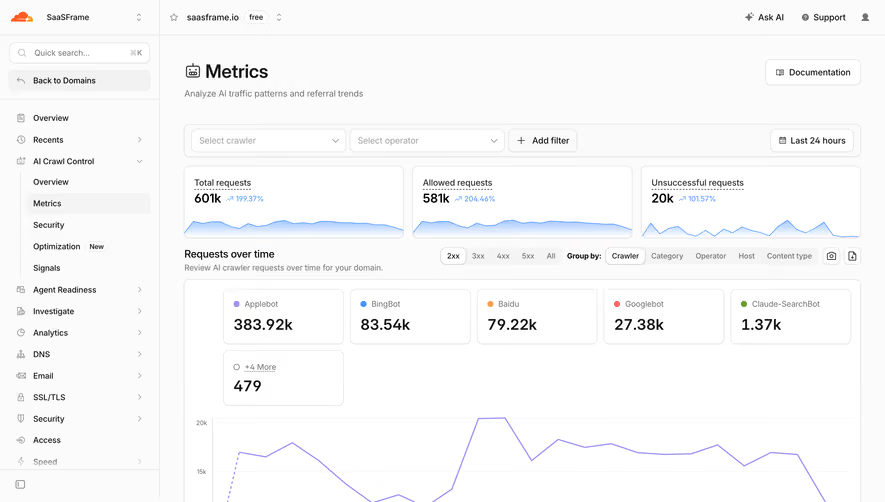
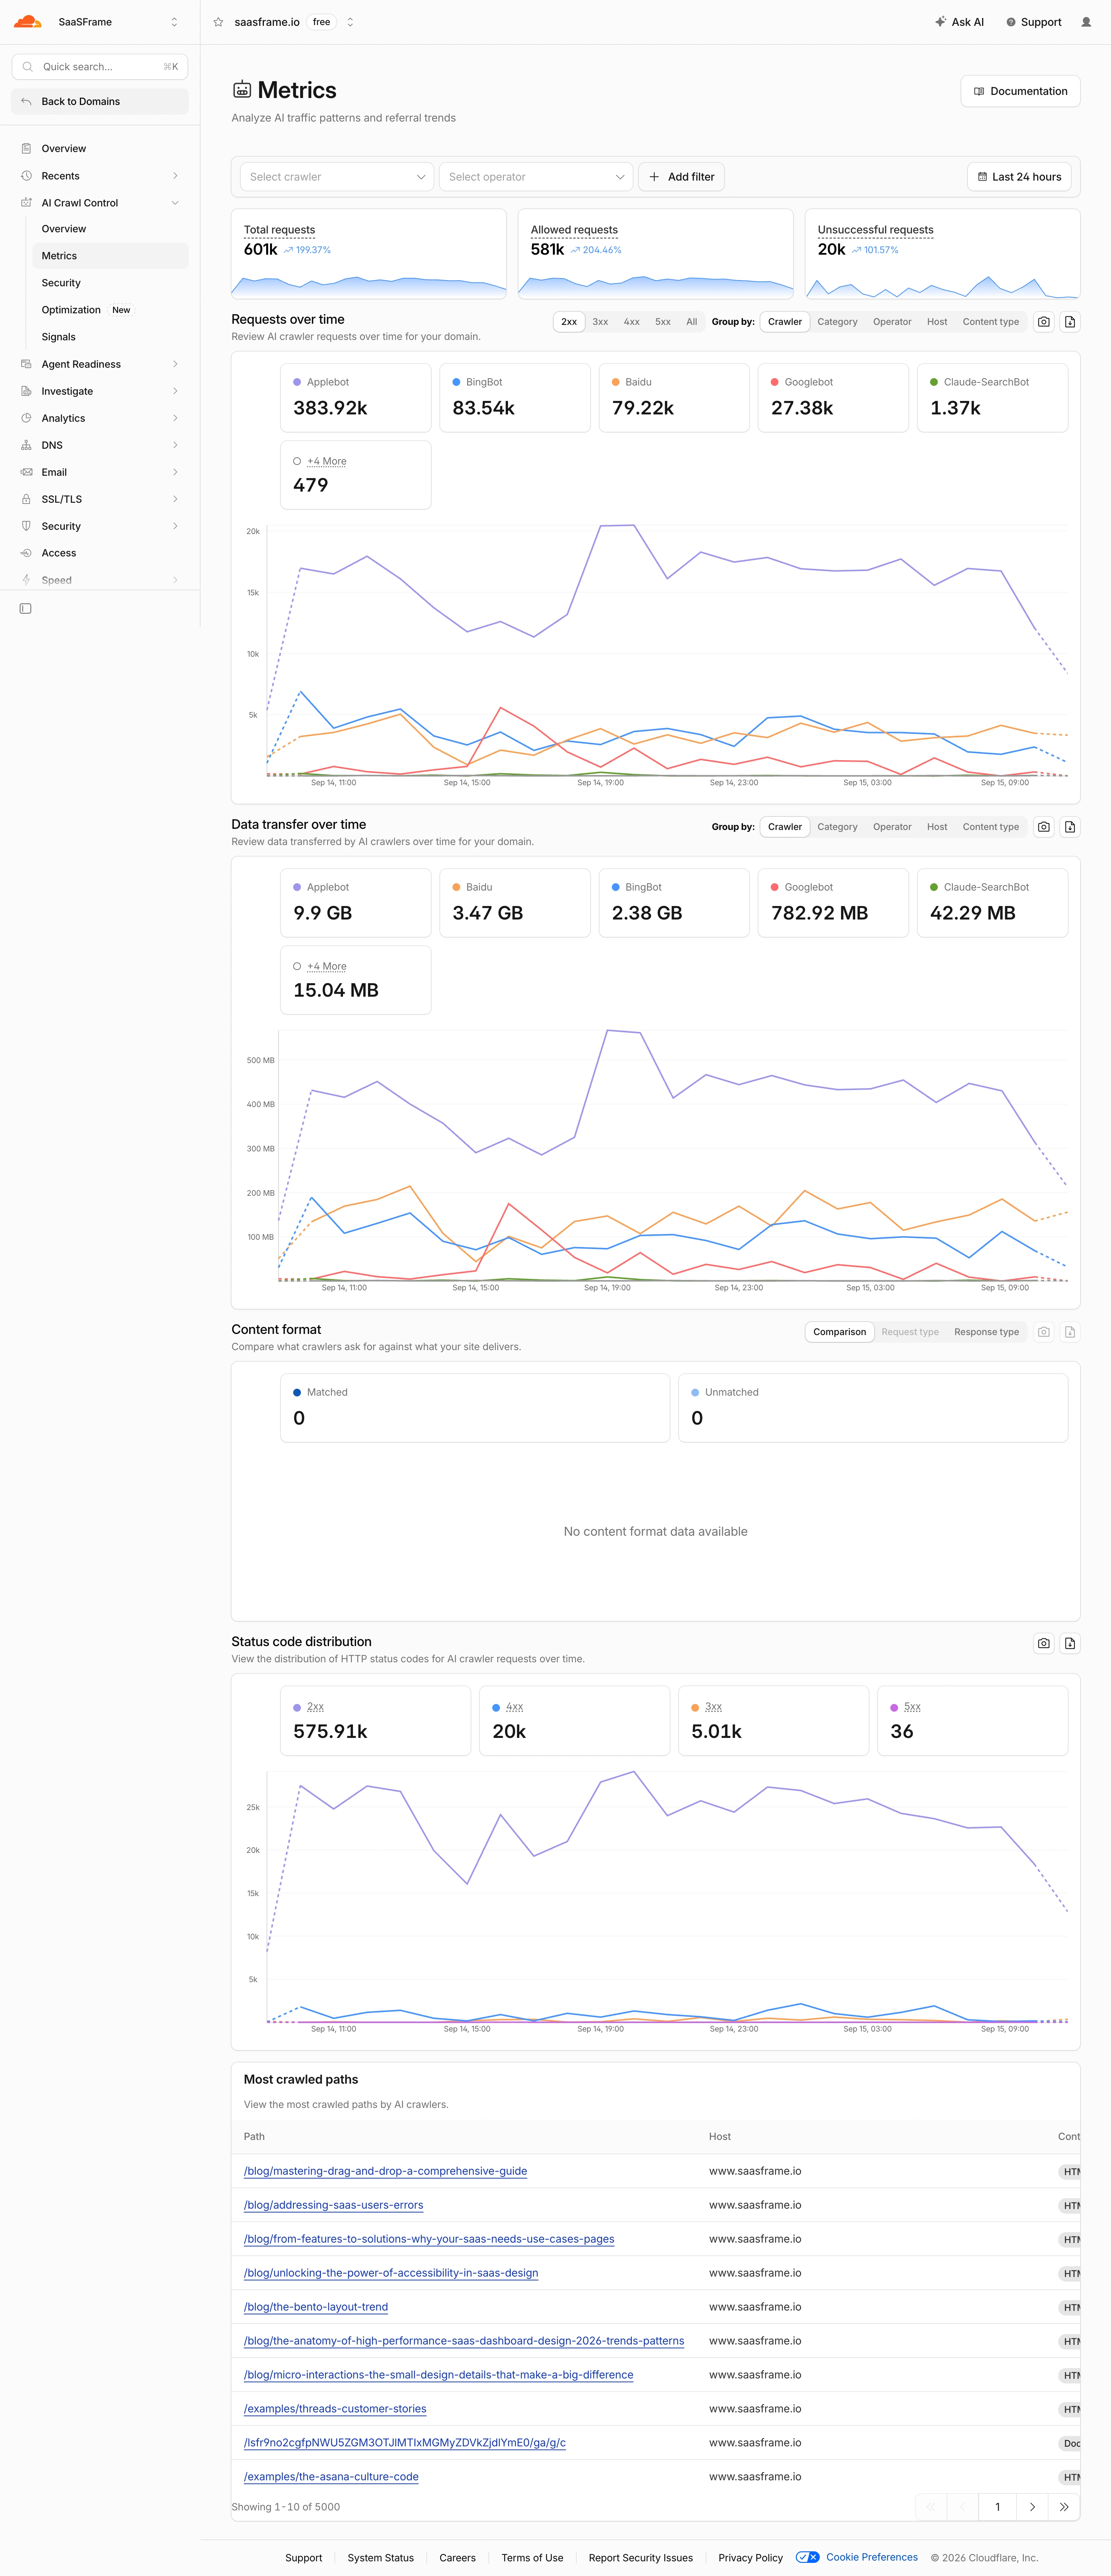
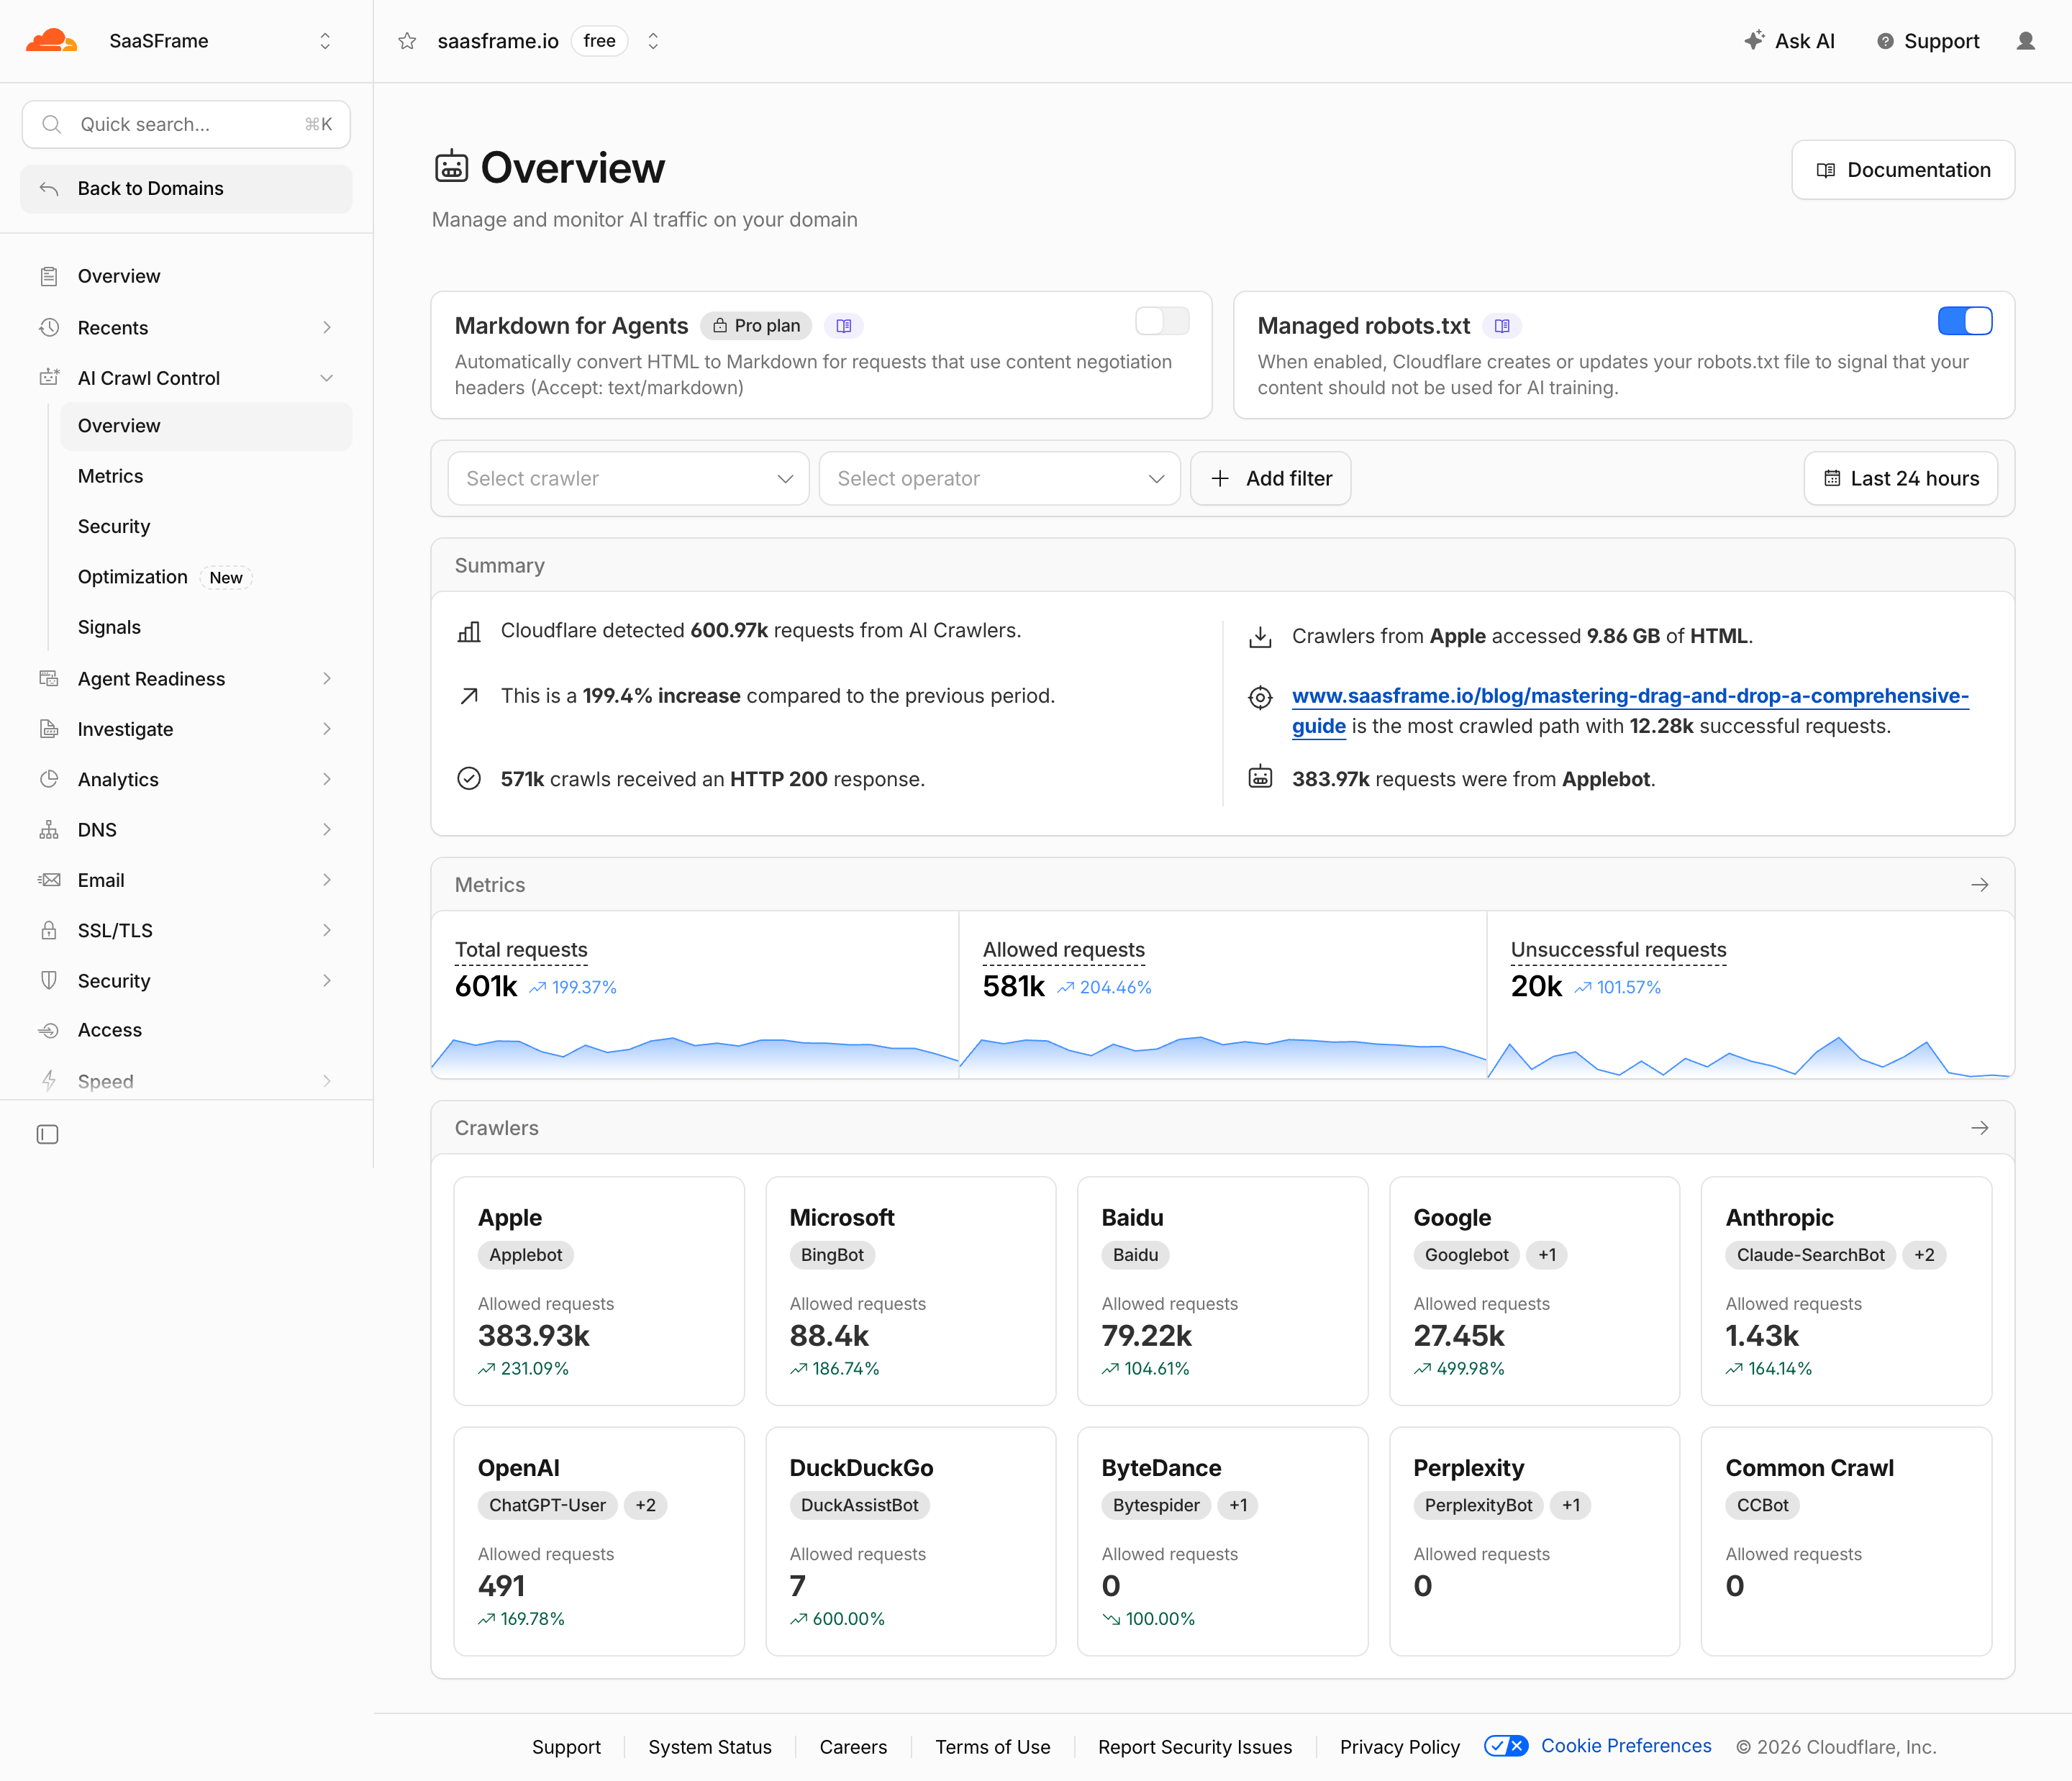
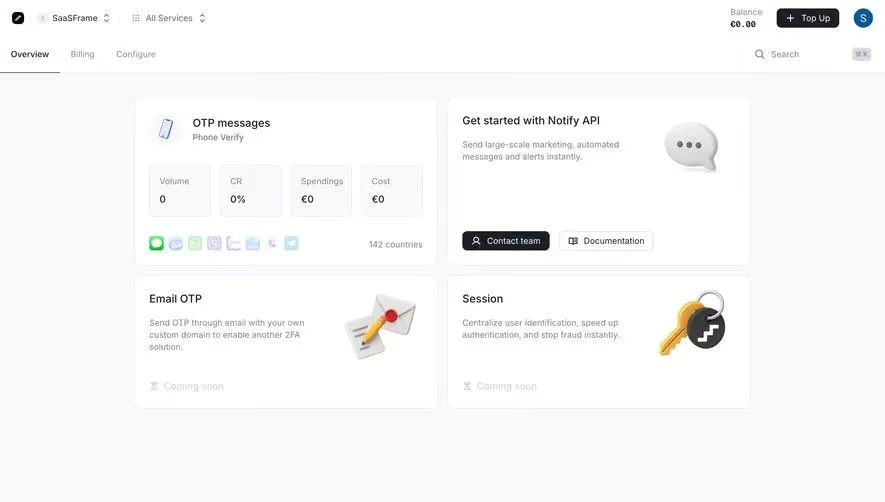
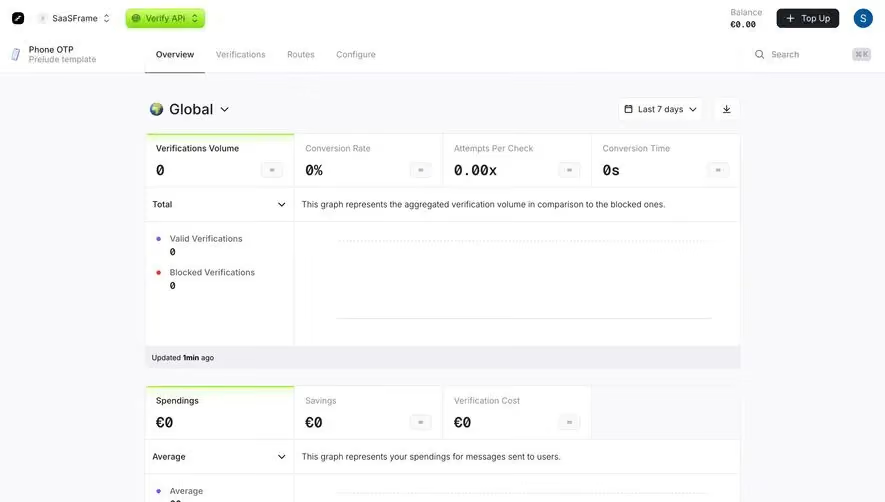
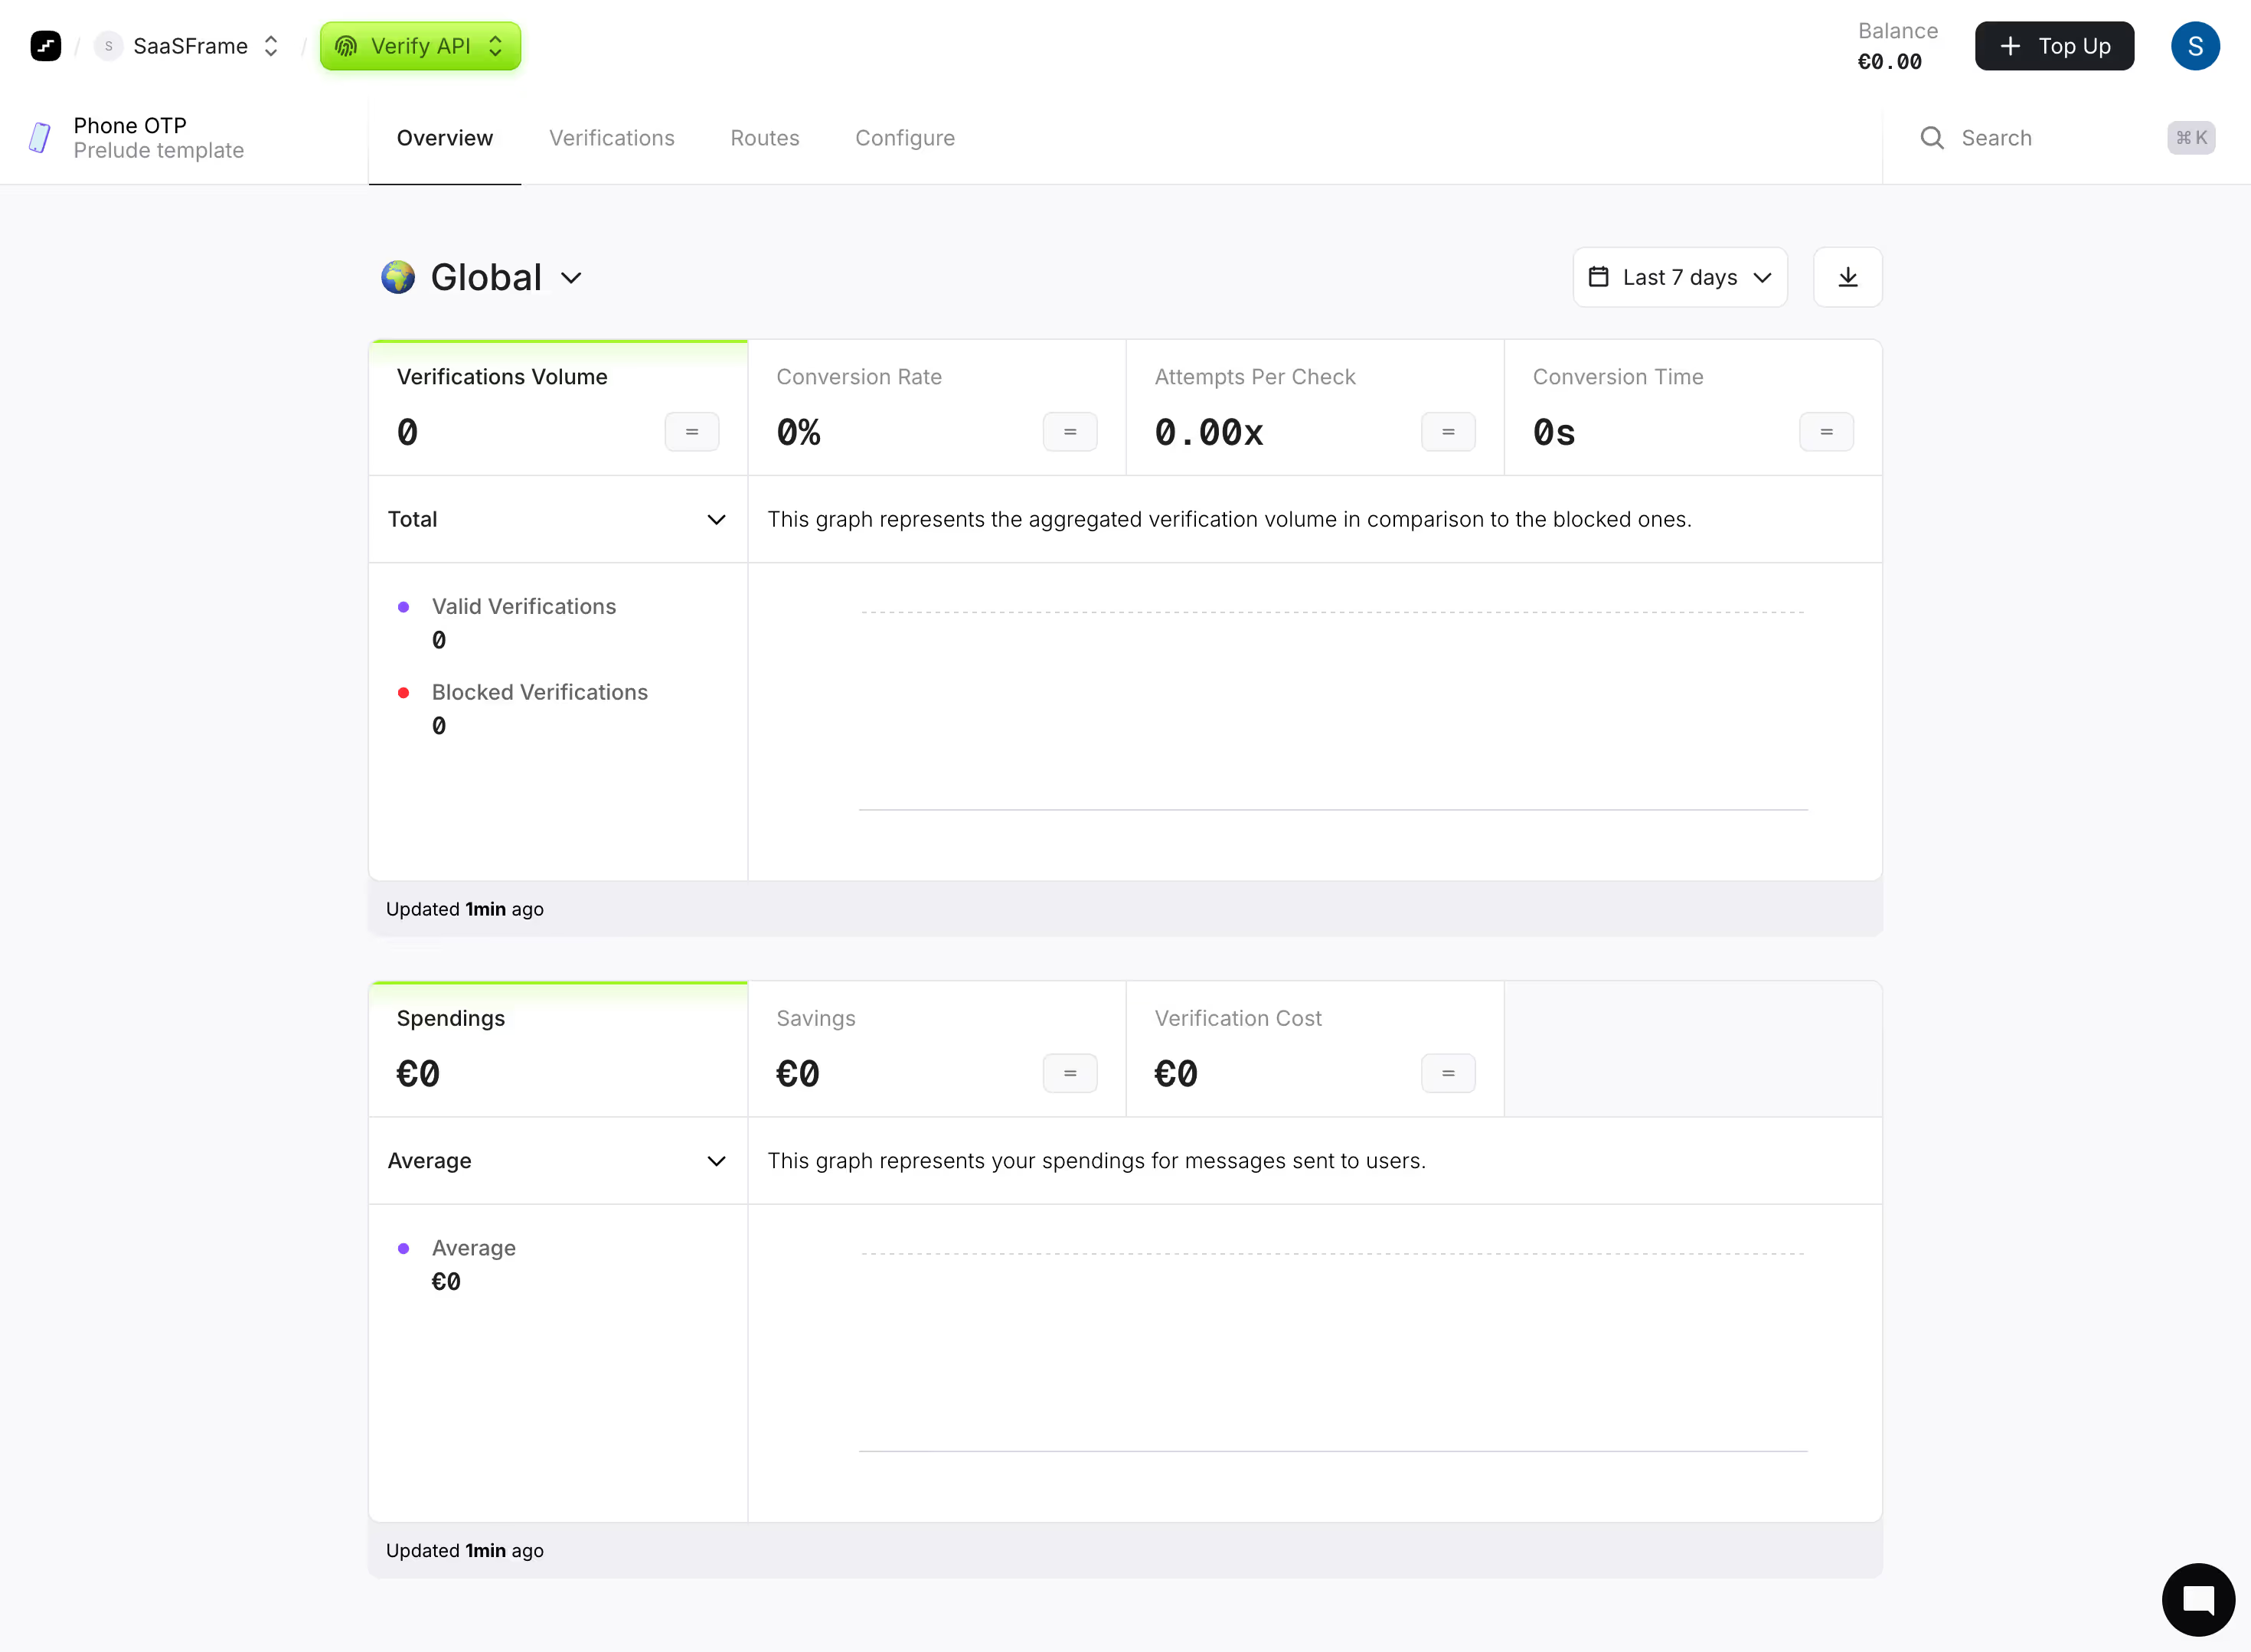
Highlight key performance indicators with SaaS Metric patterns. Discover 'Big Number' cards, sparklines, and percentage change indicators that give users a snapshot of their success.

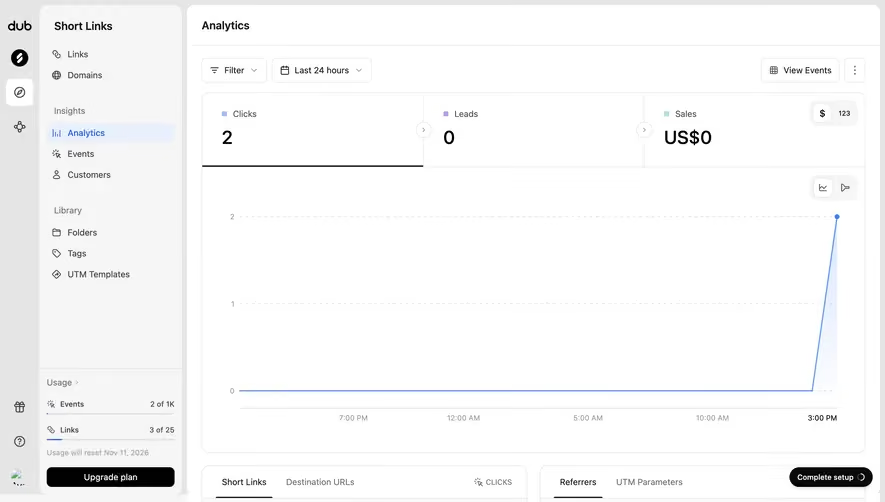
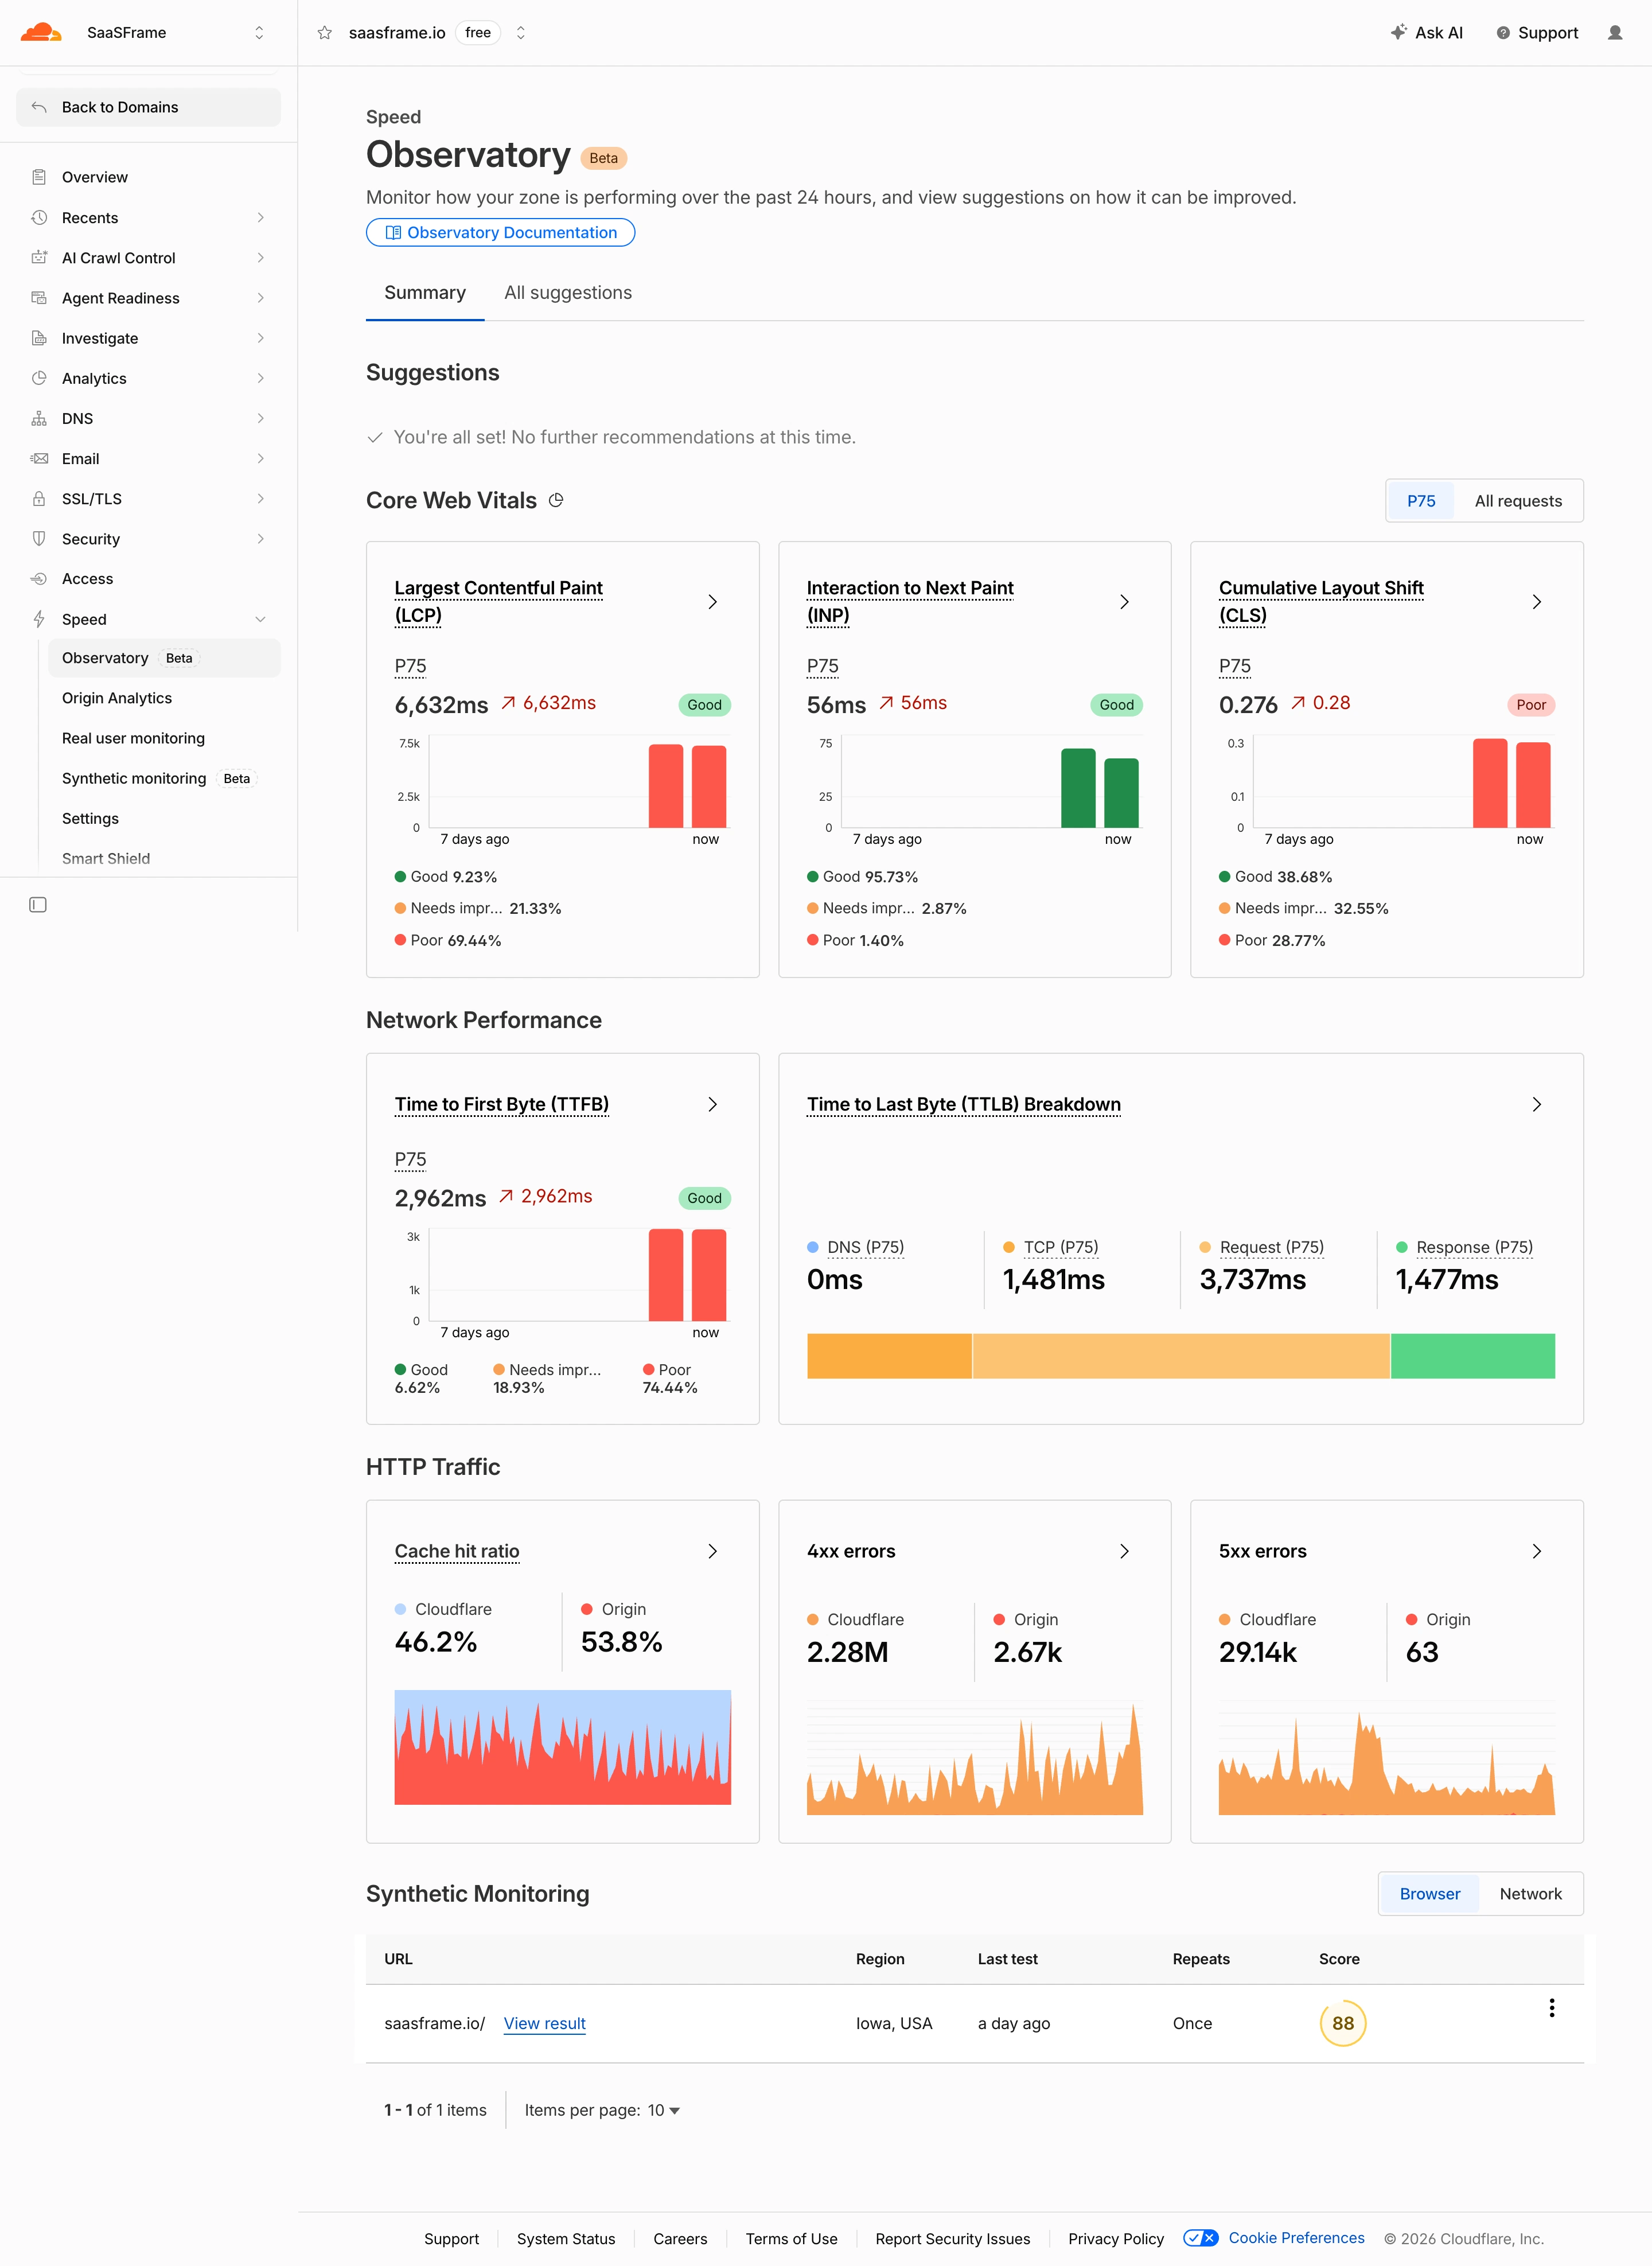
A metric summarizes a defined quantity so users can understand performance, capacity, or activity. In a SaaS interface, the visible number is only part of the information. Its label, unit, time period, scope, and calculation rule determine what it means. A prominent value without those relationships can be easy to read and difficult to interpret.
Begin with the decision the metric supports. A support manager may need unresolved work, a product team may need active accounts, and a marketer may need engagement for a selected channel. Choose the measure around that task rather than filling a dashboard with every available count.
A useful metric helps users distinguish measurement from interpretation. A decline is an observation; whether it is a problem depends on context. The interface should provide enough information to inspect the basis, compare appropriately, and locate details when needed. Avoid letting visual emphasis imply significance that the quantity alone does not establish.
Buffer's captured analytics overview places the selected account and date range above performance values. The screen separates totals such as impressions and engagements from an Average performance section. This provides a shared scope while distinguishing different calculation types.
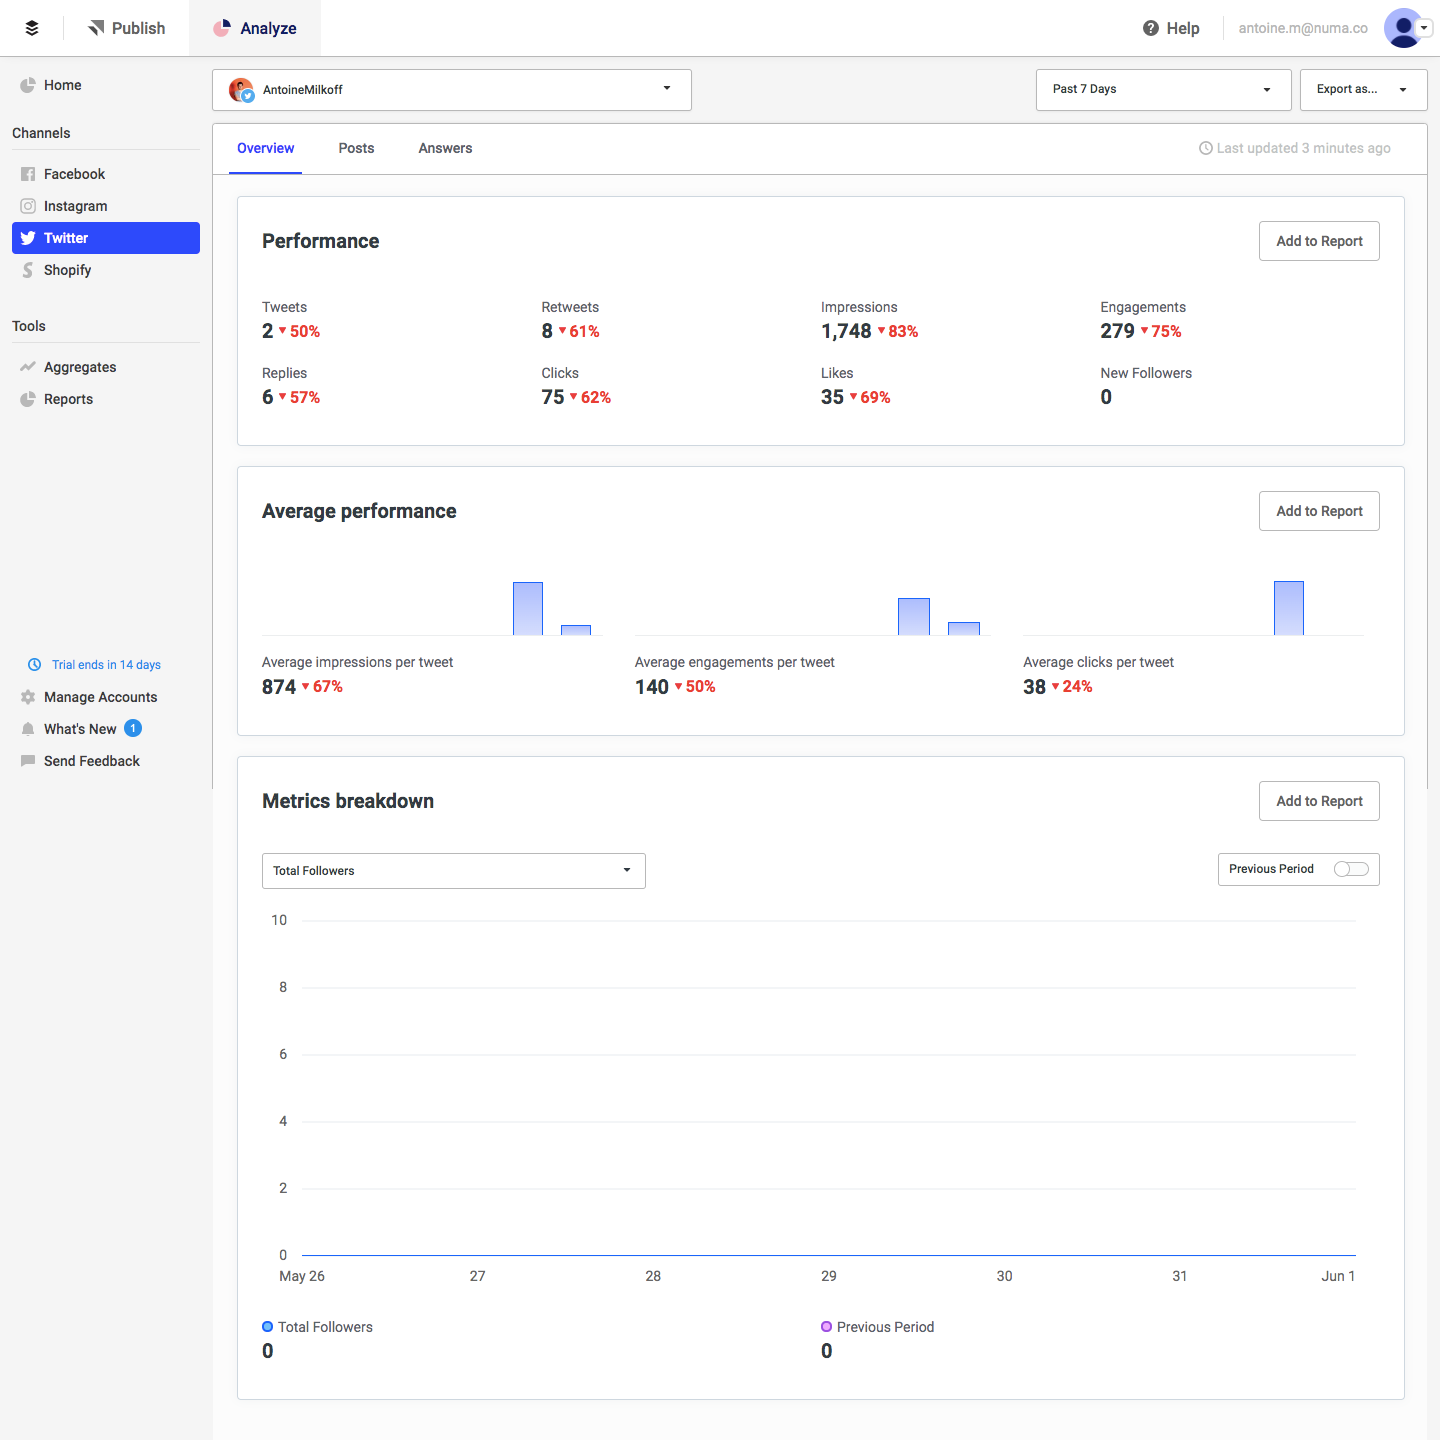
That distinction matters because a total can change when publishing volume changes, while an average describes a different relationship. Users should not compare the two as if they answer the same question. Keep the calculation type in the label, especially when similar words appear in several panels.
The values and platform labels belong to a historical capture, not current account performance. Their useful lesson is the hierarchy of scope and measurement. In a comparable interface, test whether a user can explain which account, period, and denominator apply without opening another settings page.
Buffer's captured report view names a reporting period and presents total audience, impressions, and engagement. It includes space for a report description and chart notes, along with an export route. The report is therefore more than a collection of copied numbers; it has a place for context that may matter outside the dashboard.
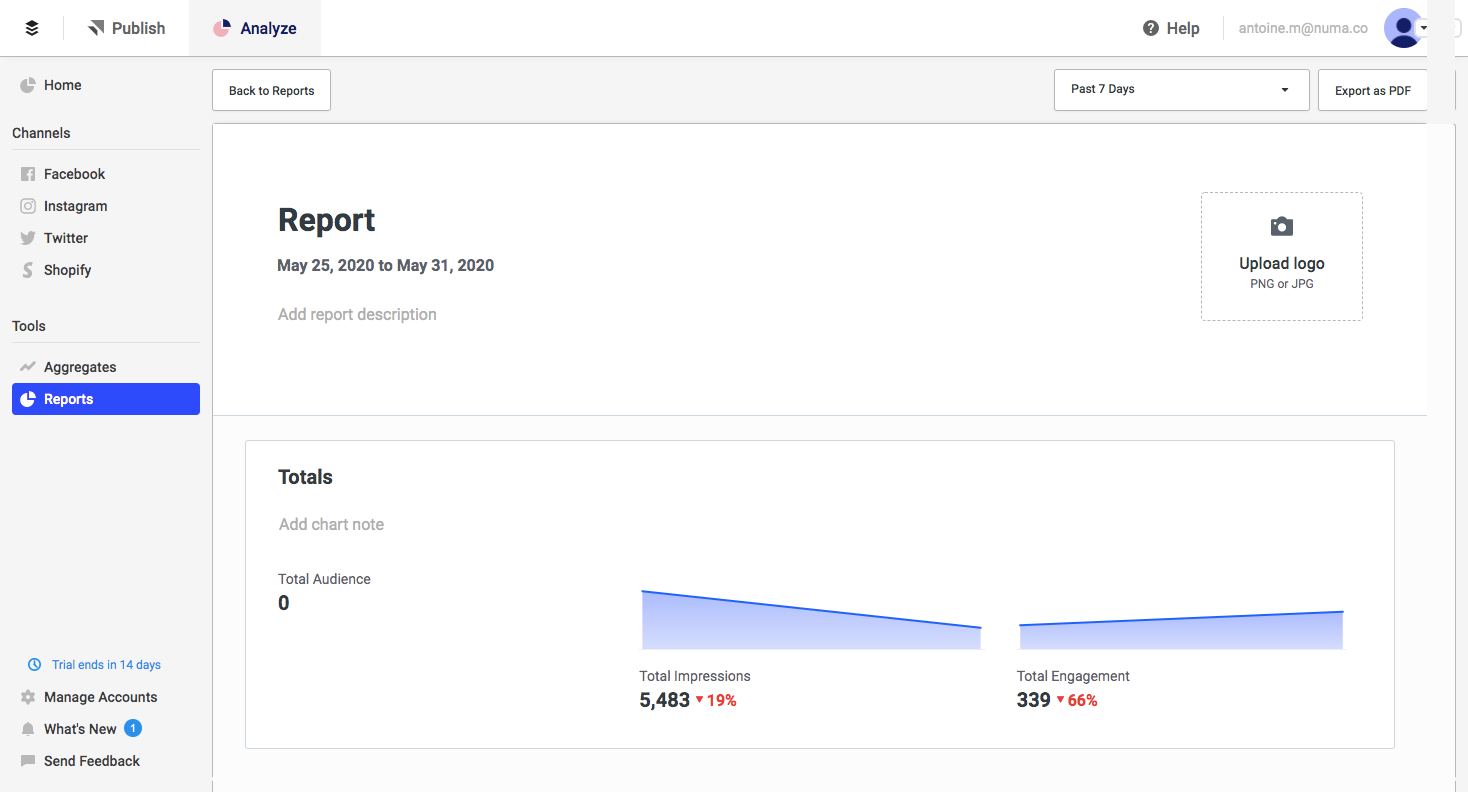
When a metric leaves its original screen, preserve the information needed to interpret it. A screenshot or exported report should not lose the date range, account scope, or comparison basis. Otherwise a correct number can become misleading in a meeting or message.
Notes should be distinguishable from measured values. A team's explanation of an unusual week is interpretation, not another data field. Keep both useful without blending them. A report can combine evidence and commentary when readers can tell which is which.
A metric label should identify what is counted or calculated. Users, sessions, accounts, and events are different units. Active accounts requires a definition of activity; unresolved conversations requires a rule for resolution. Use readable labels and provide accessible detail when the definition is not obvious.
Units should remain consistent across the interface. Currency, duration, percentages, and counts need different formatting. Rounding can improve scanability, but preserve access to precision when a decision depends on it. A shortened value should not imply exactness.
For ratios and averages, expose the denominator where it affects interpretation. Engagement per post differs from engagement per viewer. A percentage should identify what it is a percentage of. Avoid an unlabeled rate that users must reconstruct from nearby numbers.
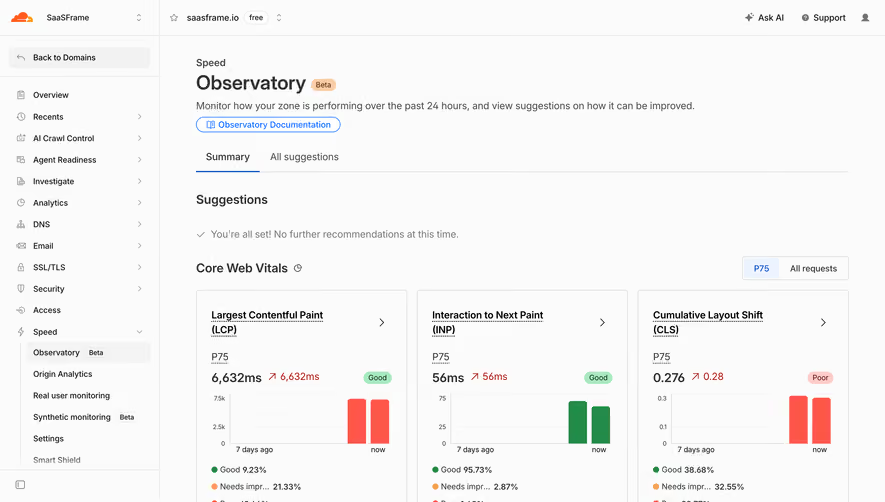
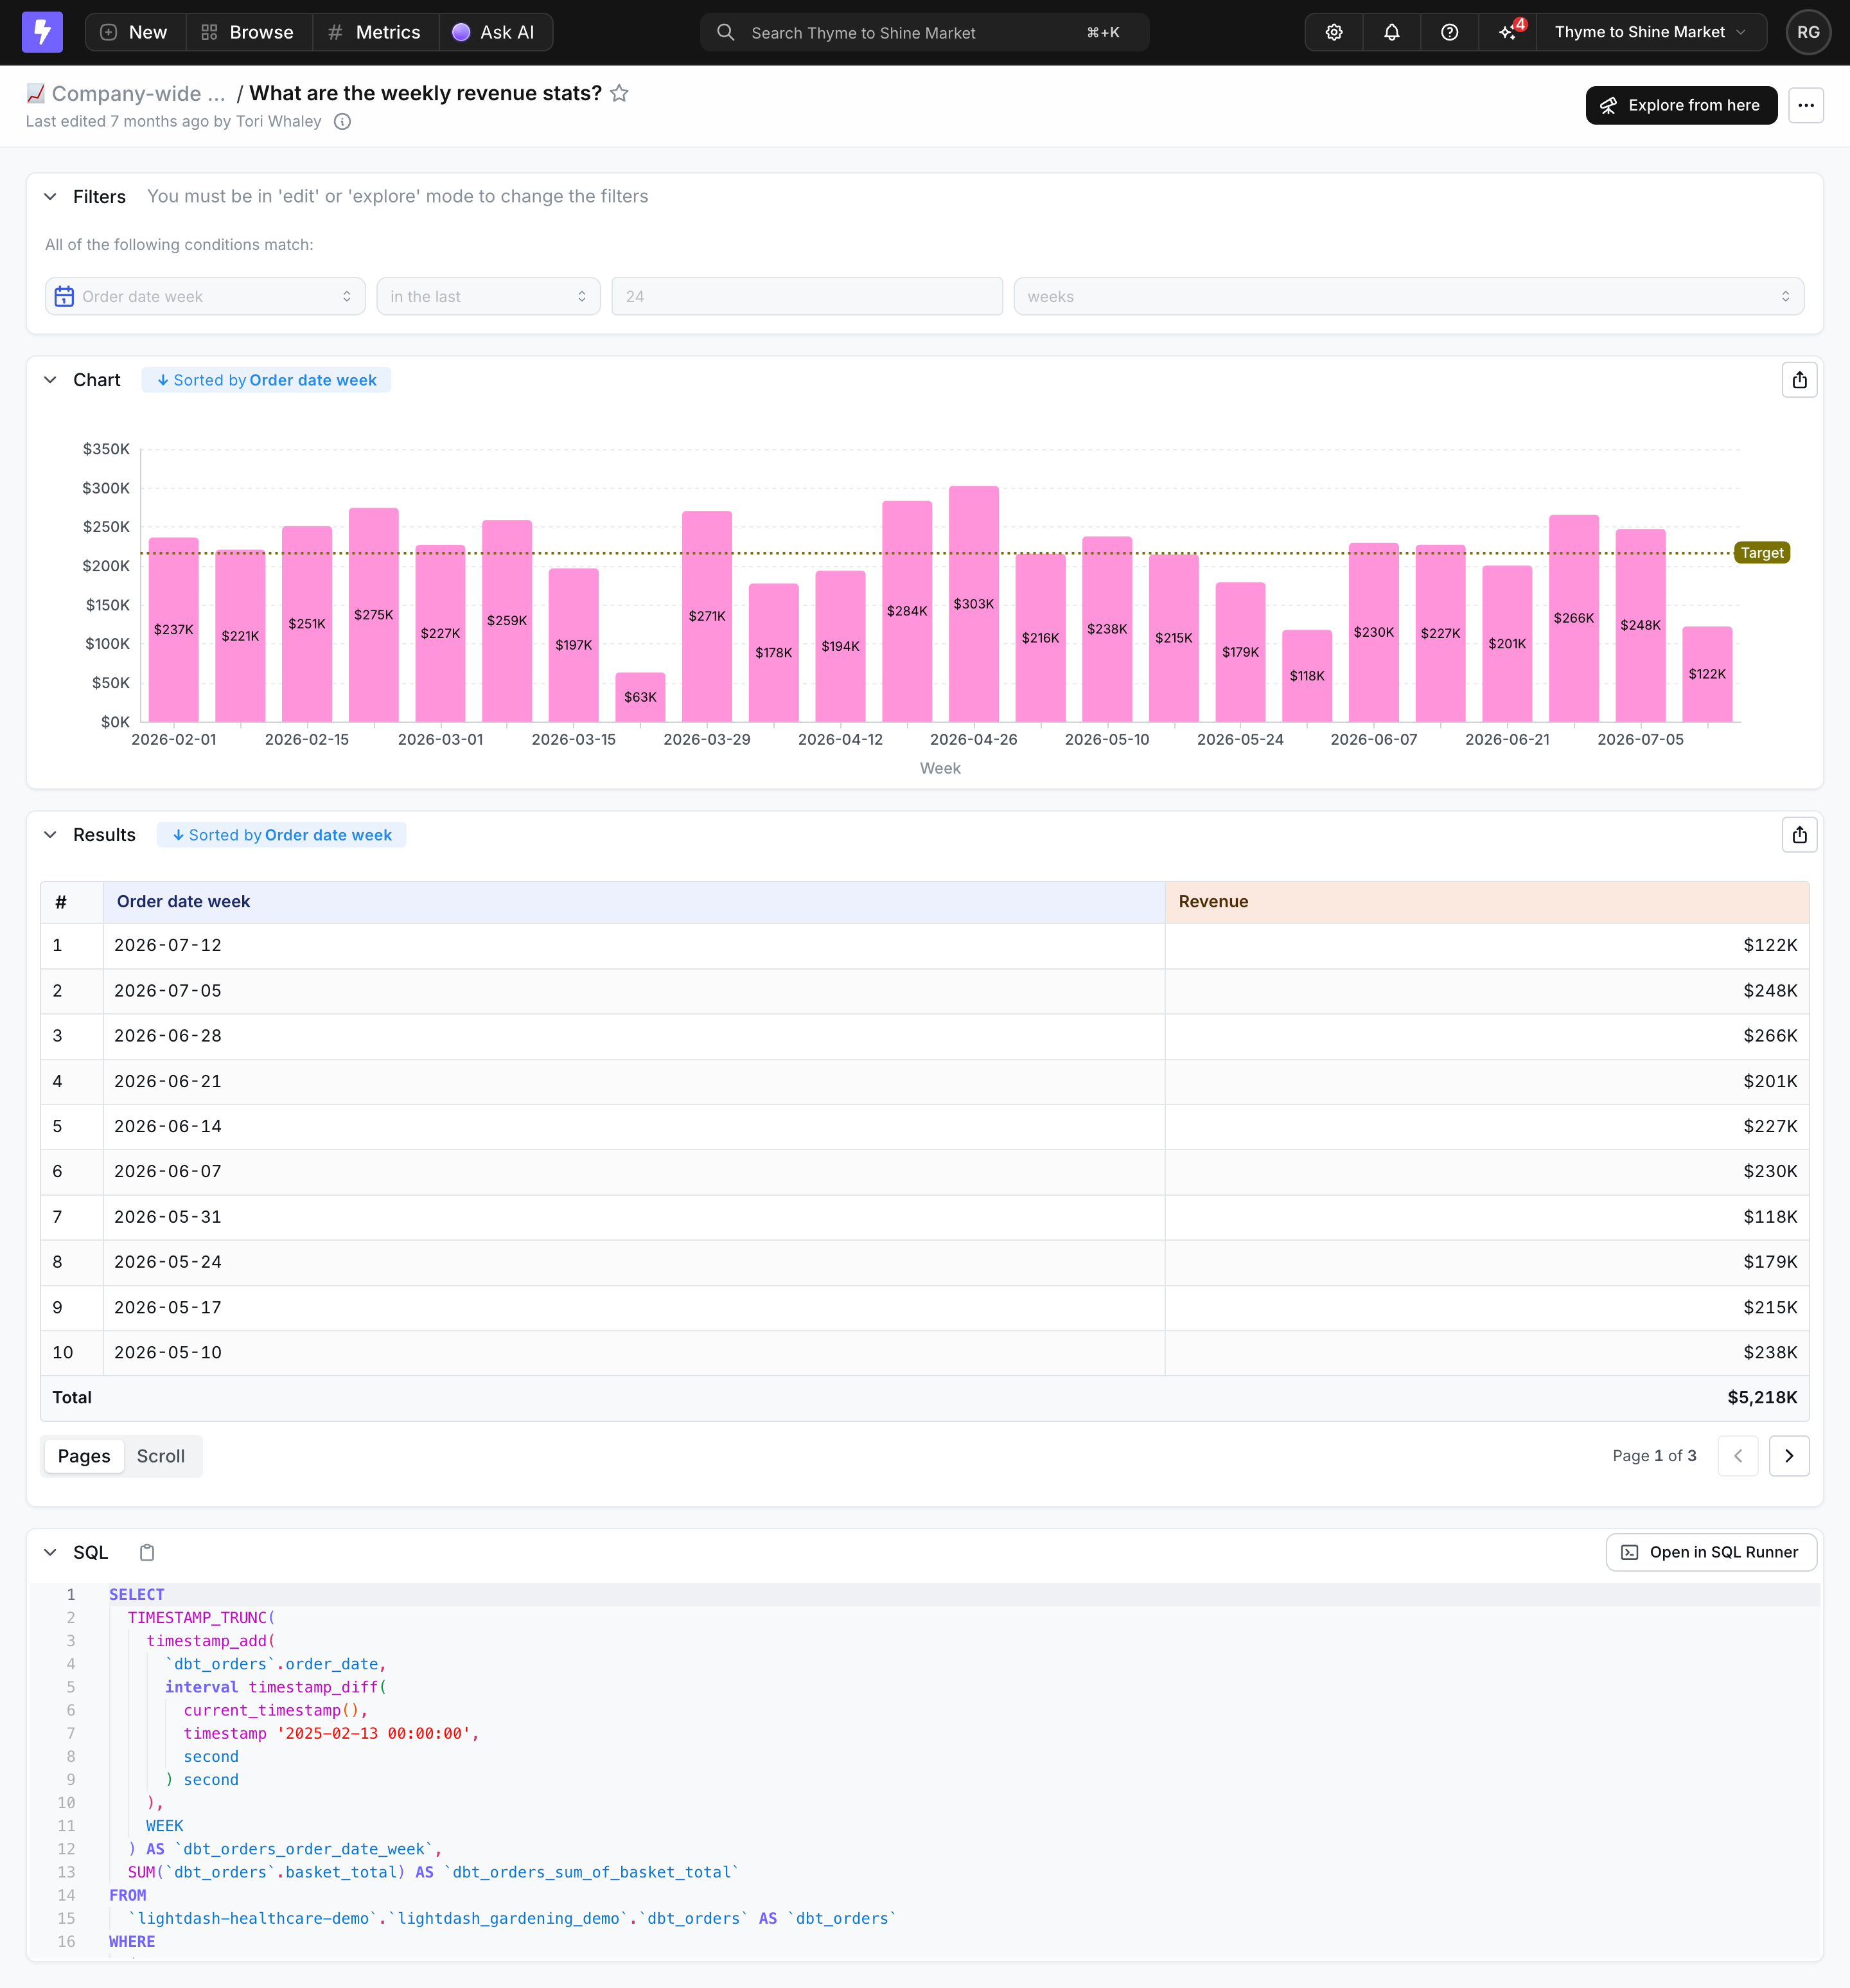
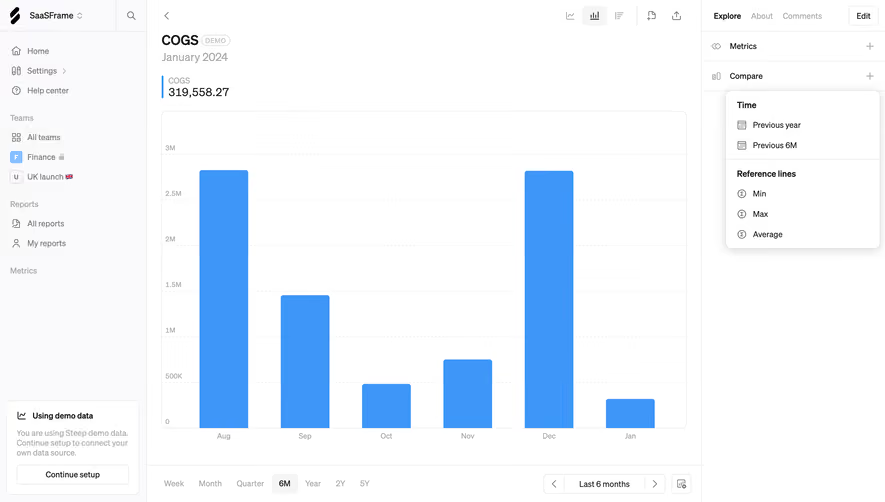
A comparison needs a reference period or baseline. Previous period, previous year, target, and benchmark answer different questions. Keep that basis visible rather than showing a red or green percentage beside the value with no explanation.
Direction is not the same as desirability. An increase in resolution time may be unfavorable; an increase in completed work may be useful. Choose visual signals around the metric's meaning and avoid assigning green to every increase automatically. Use text or symbols that remain understandable without color alone.
When a baseline is zero or very small, relative change needs careful handling. Provide absolute context and an appropriate explanation rather than displaying an infinite or dramatic percentage with no basis. A small numerical change can create a large relative movement without representing a large operational effect.
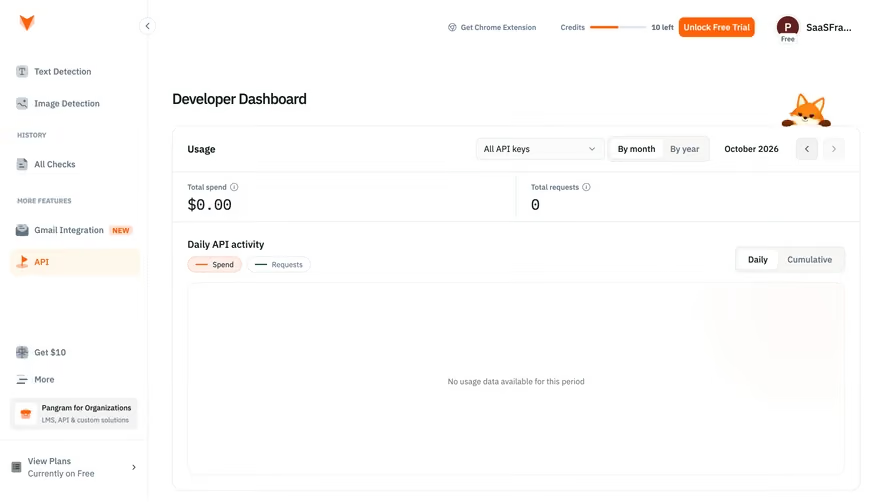
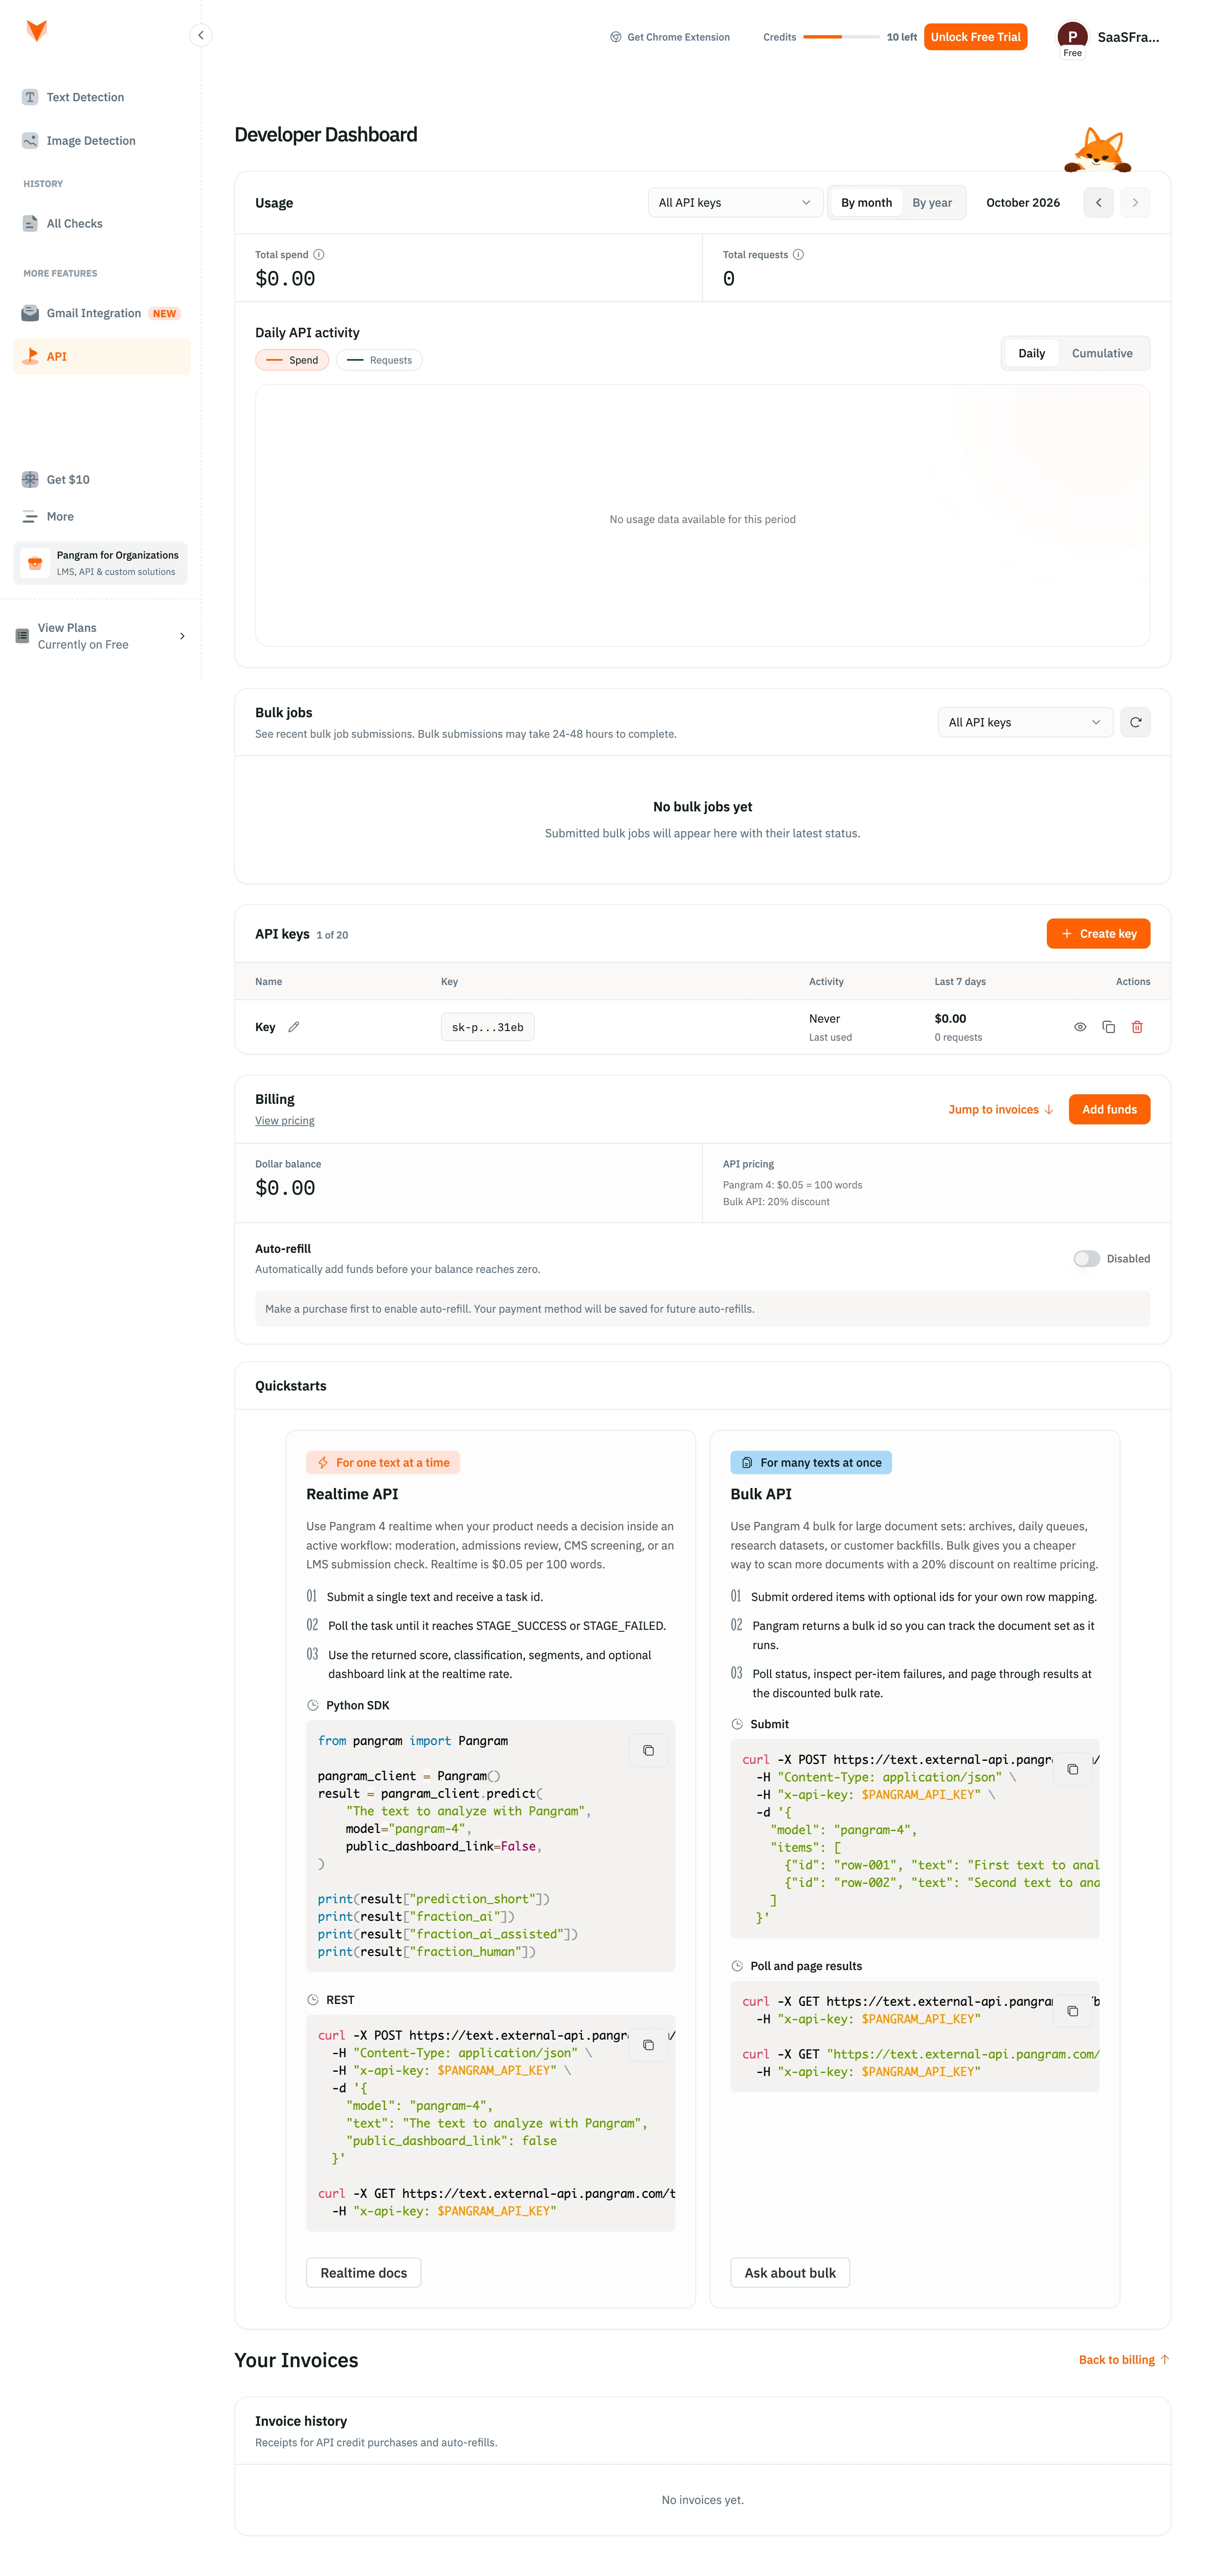
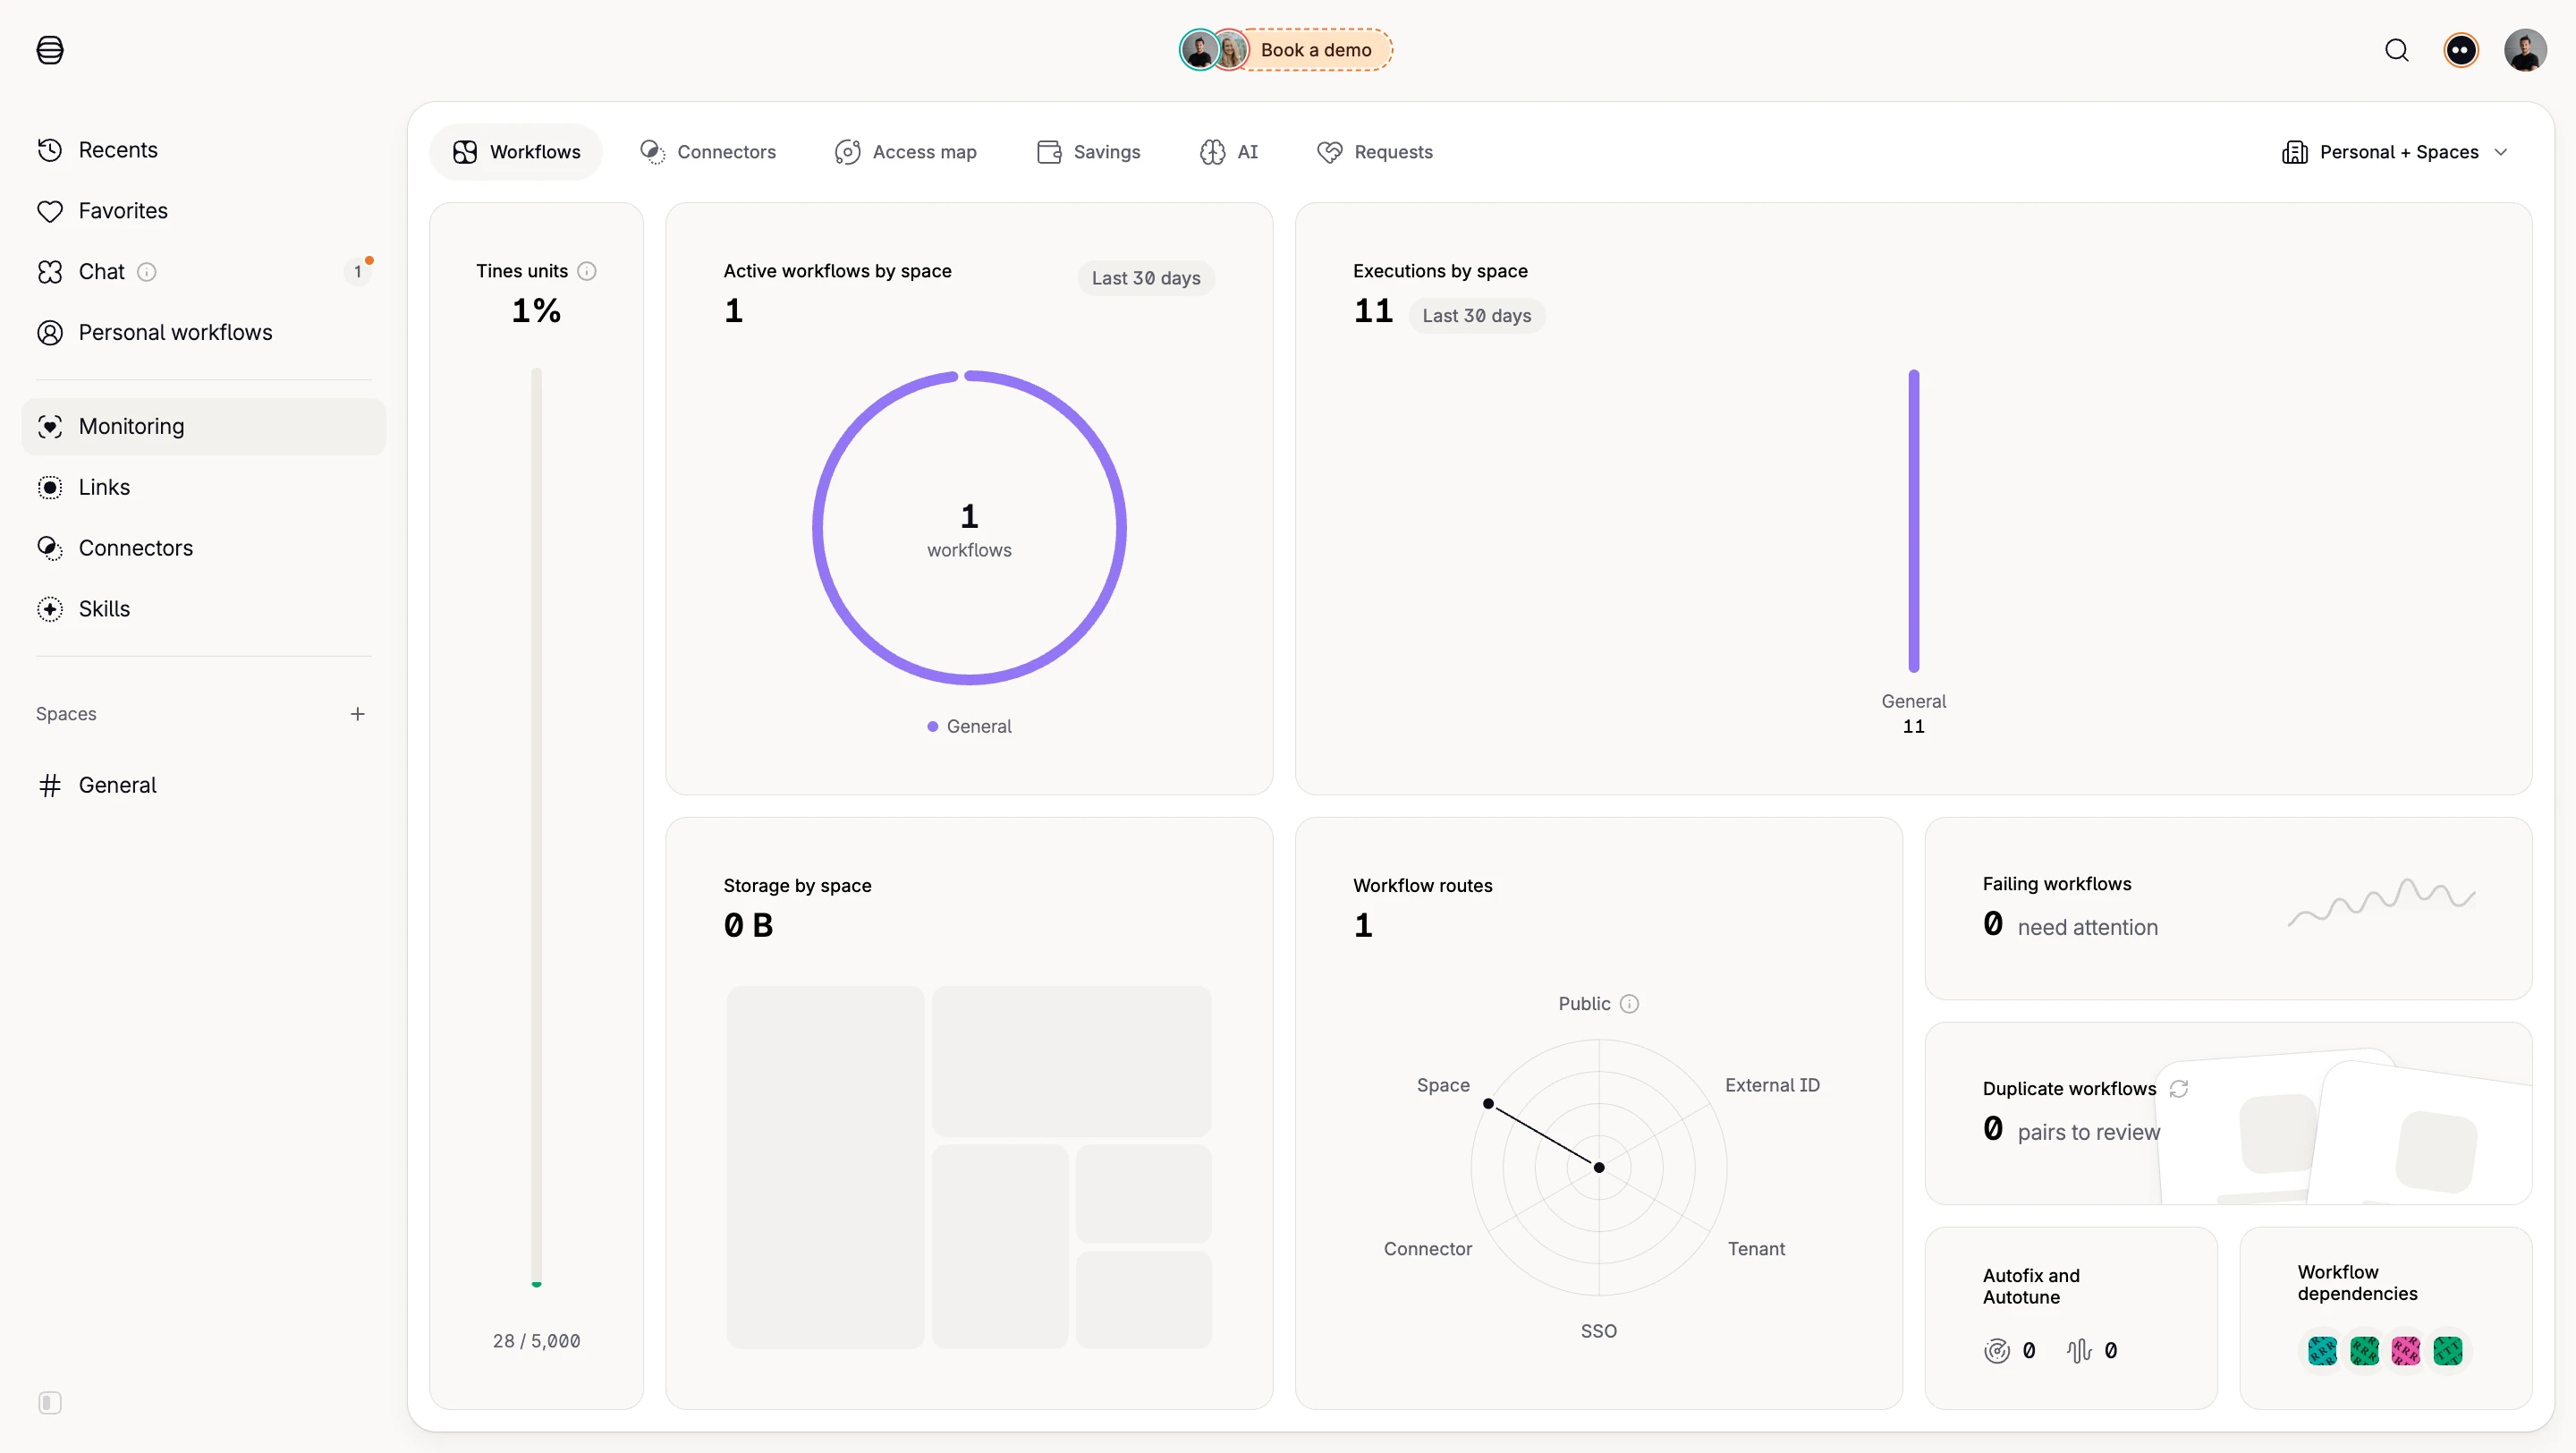
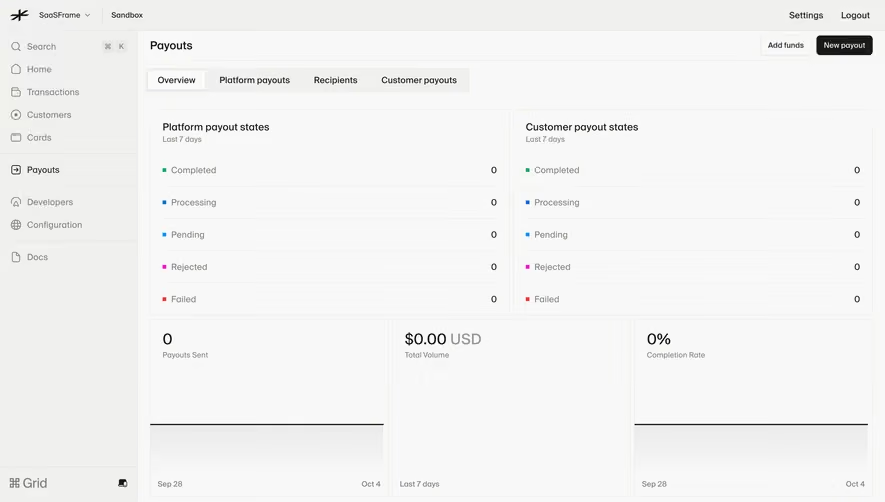
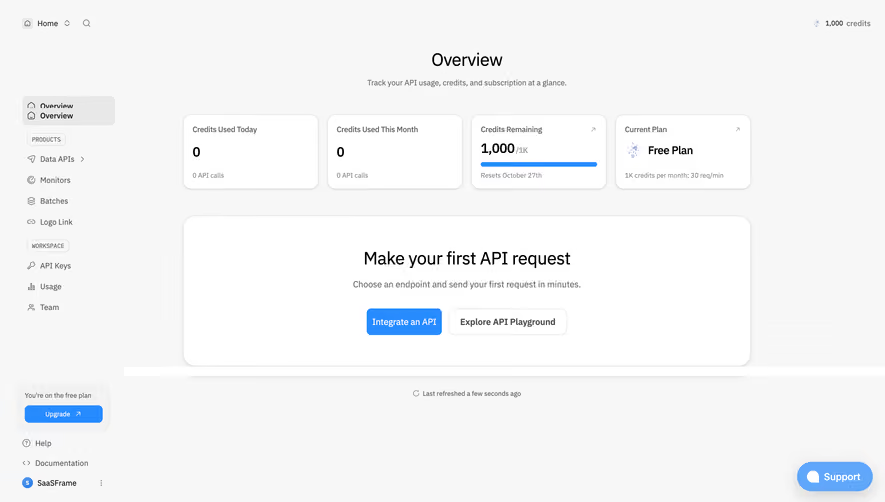
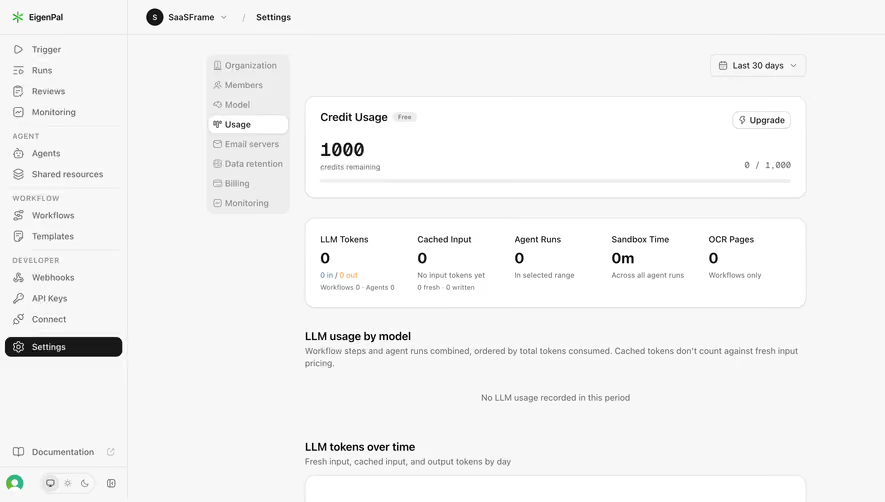
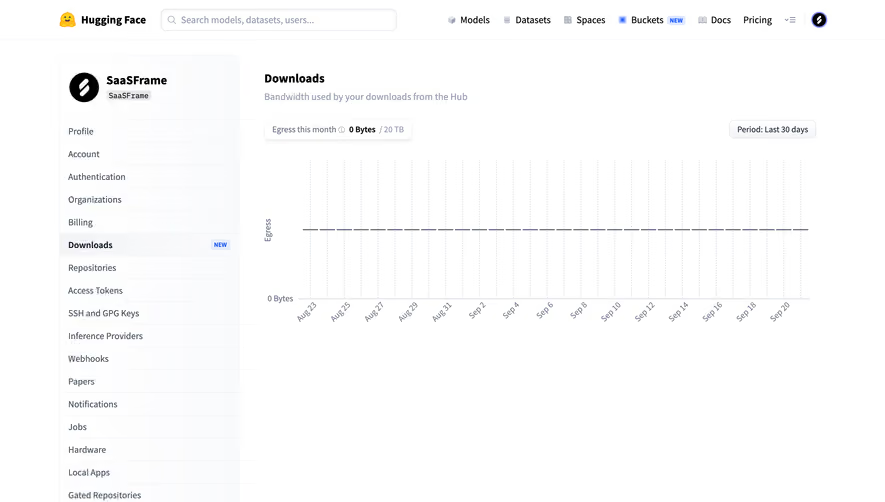
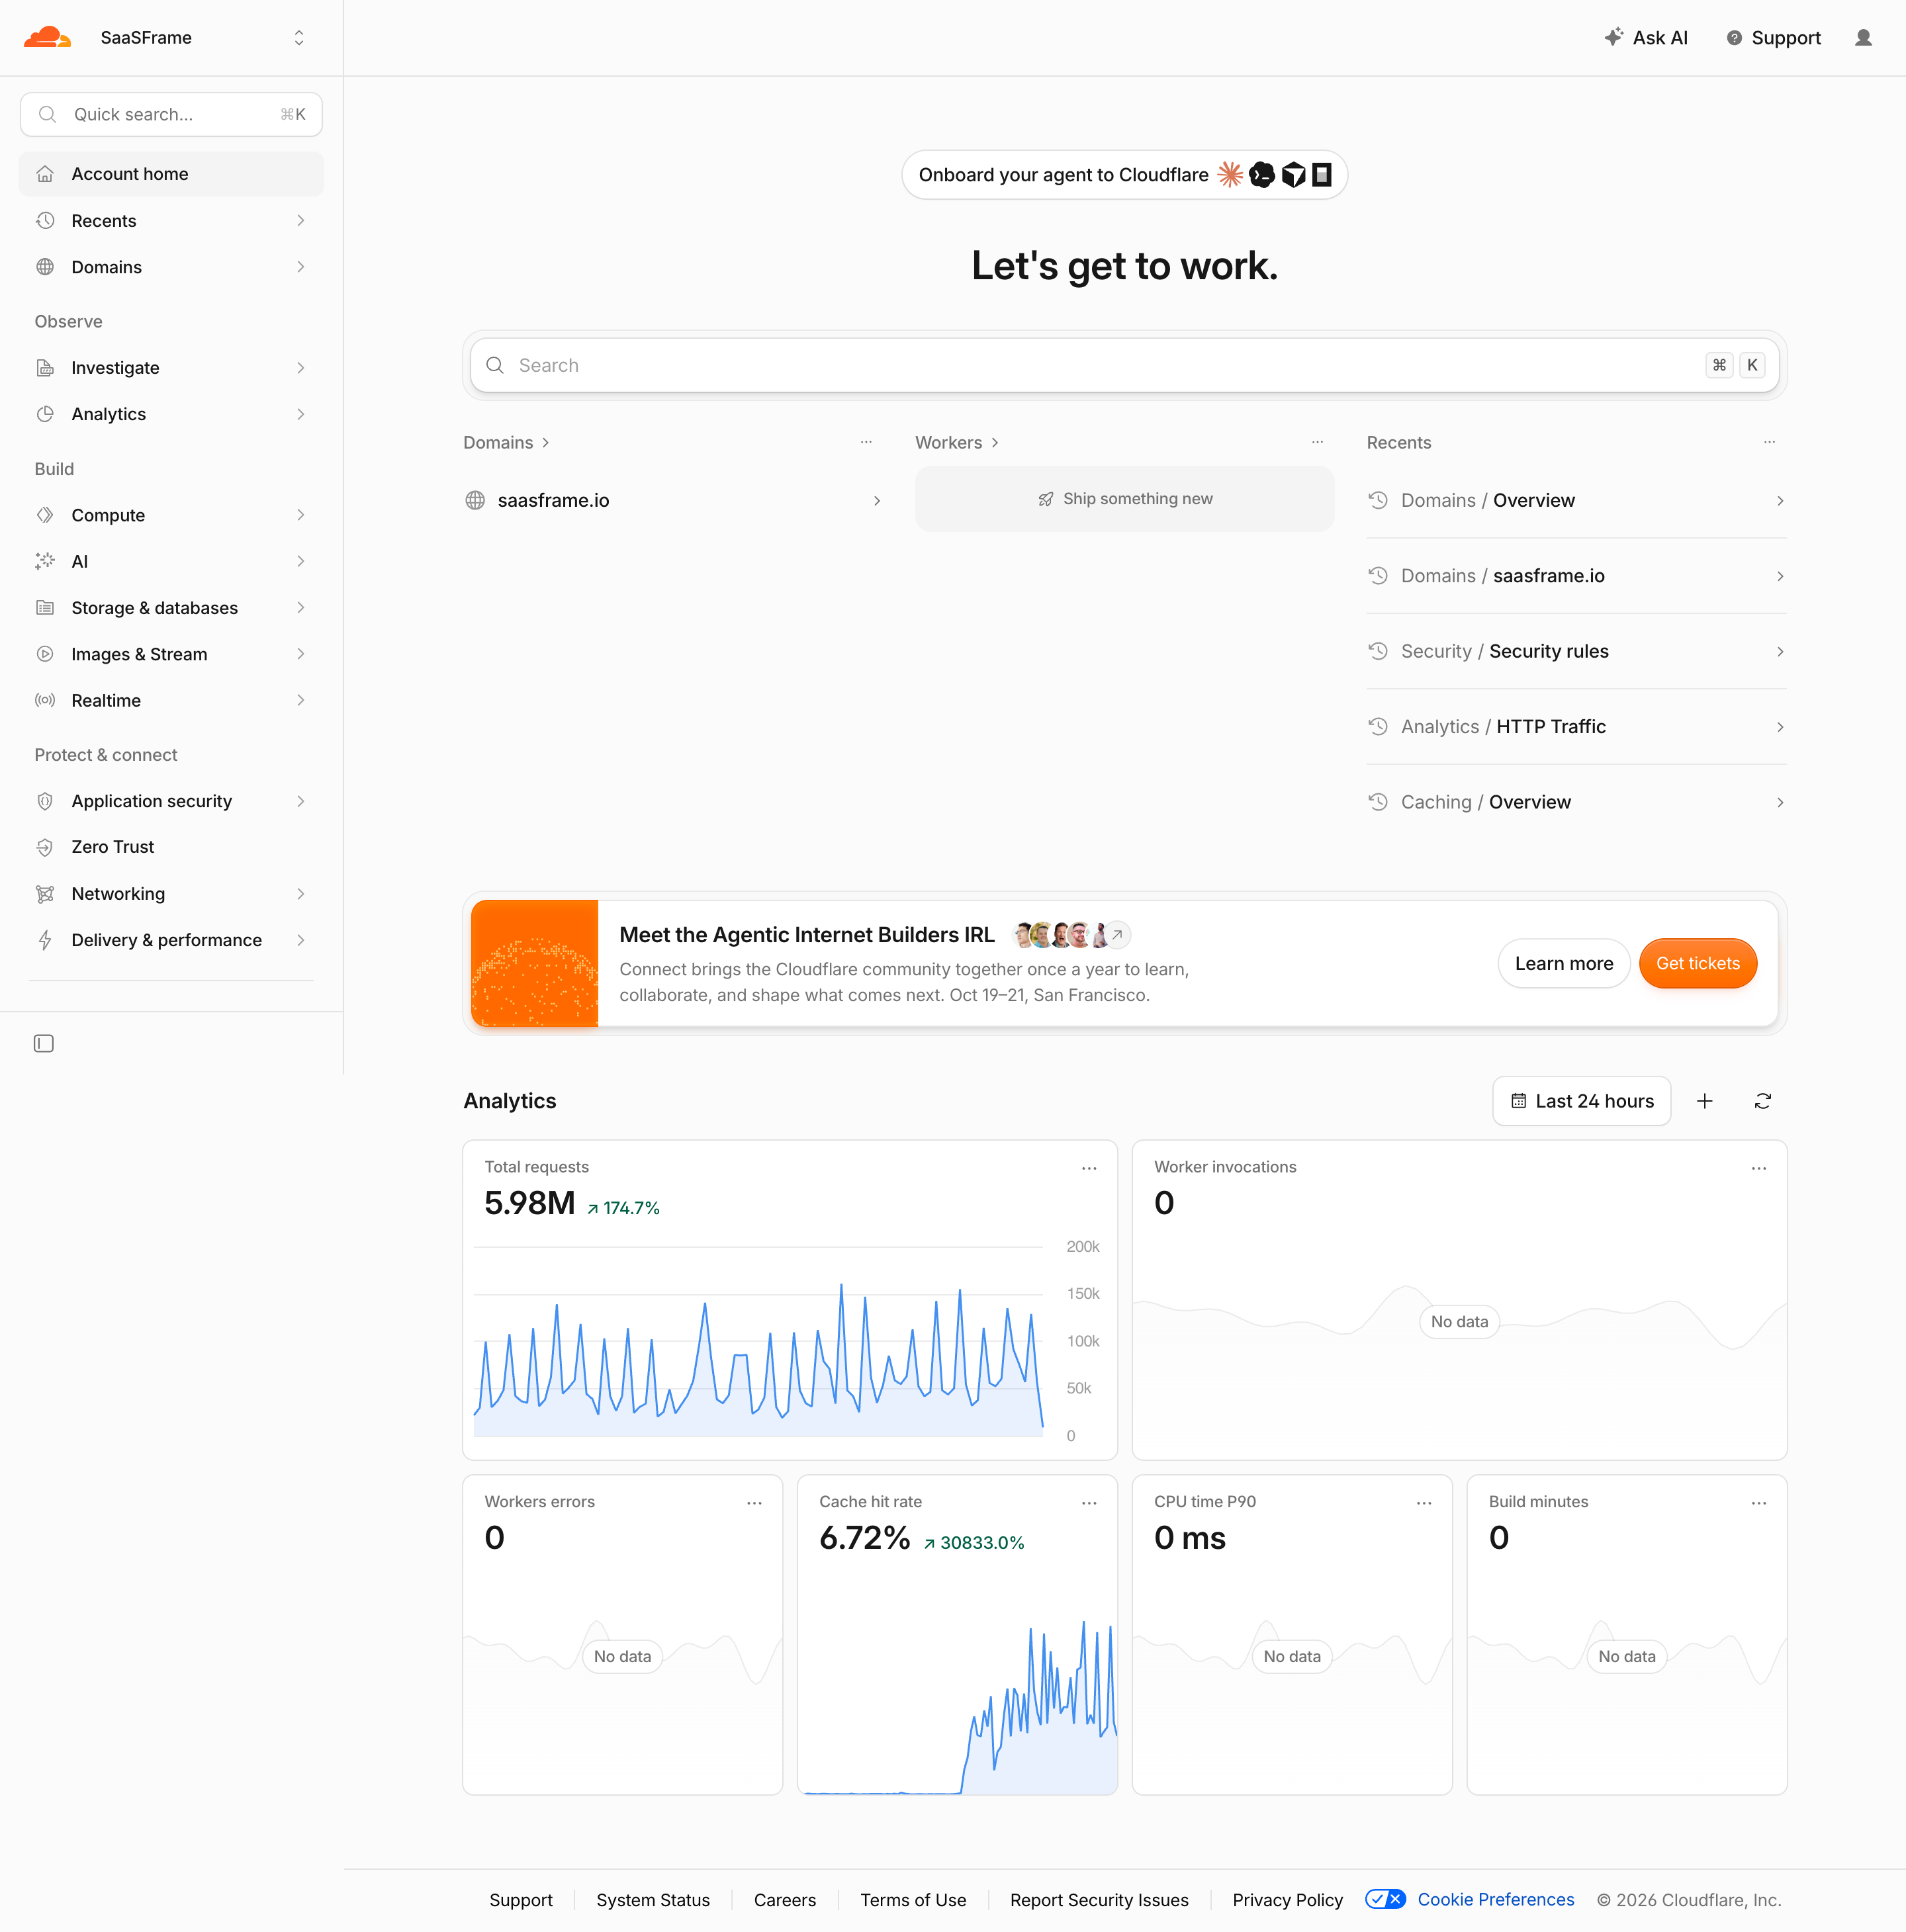
A zero is a measured quantity. Missing data indicates that the system lacks a value. Delayed data may be valid for an earlier time but not current. Provisional data may change. These states should not all appear as a bare zero or blank card.
Explain freshness near the metrics where users rely on it. Buffer's captured overview includes an update-time cue. A similar interface should make the meaning accurate: when the source was read may differ from the period the source has completed.
Incomplete periods require a comparison rule. A partial current day should not silently be compared with a full prior day. If the product uses an equivalent elapsed interval, explain that where necessary. If it cannot provide a comparable value, avoid overstating the direction of change.
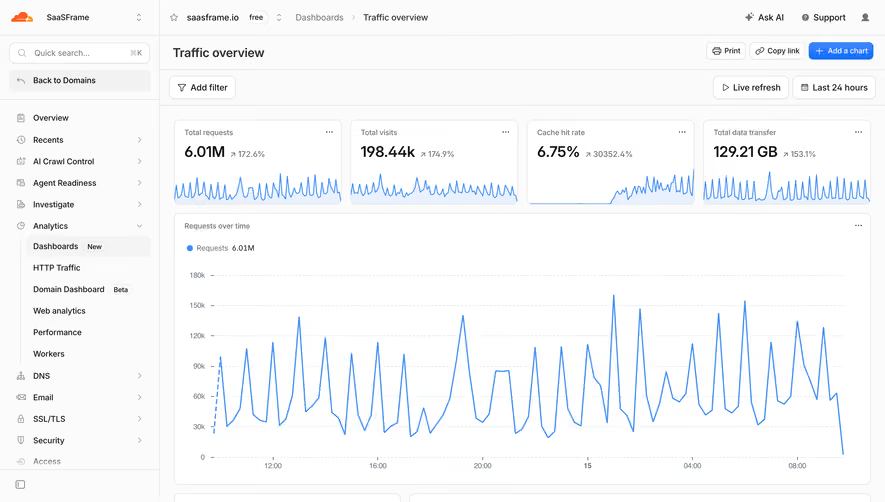
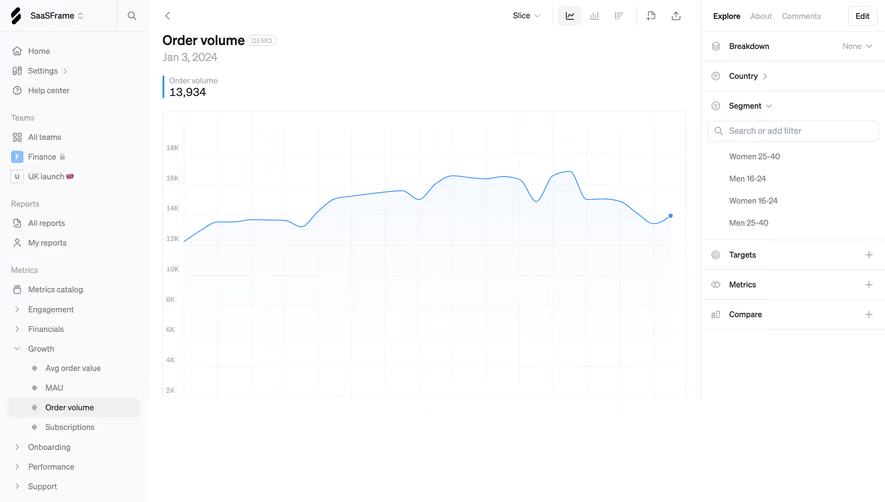
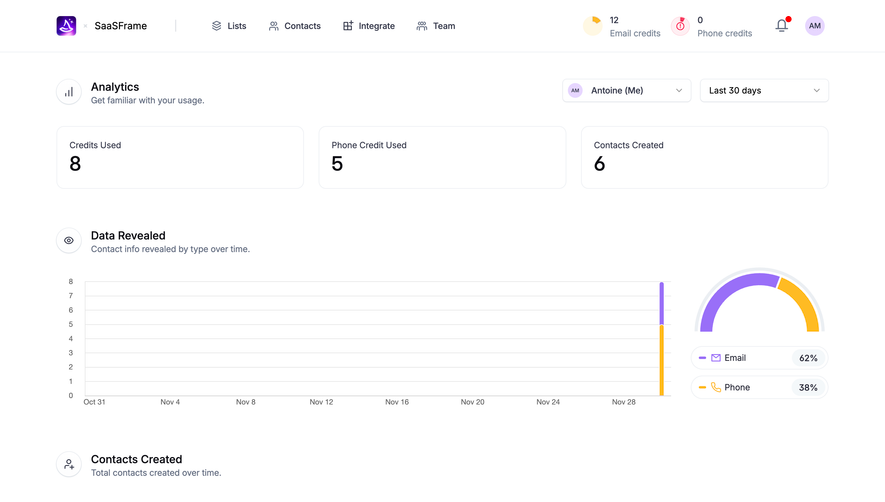
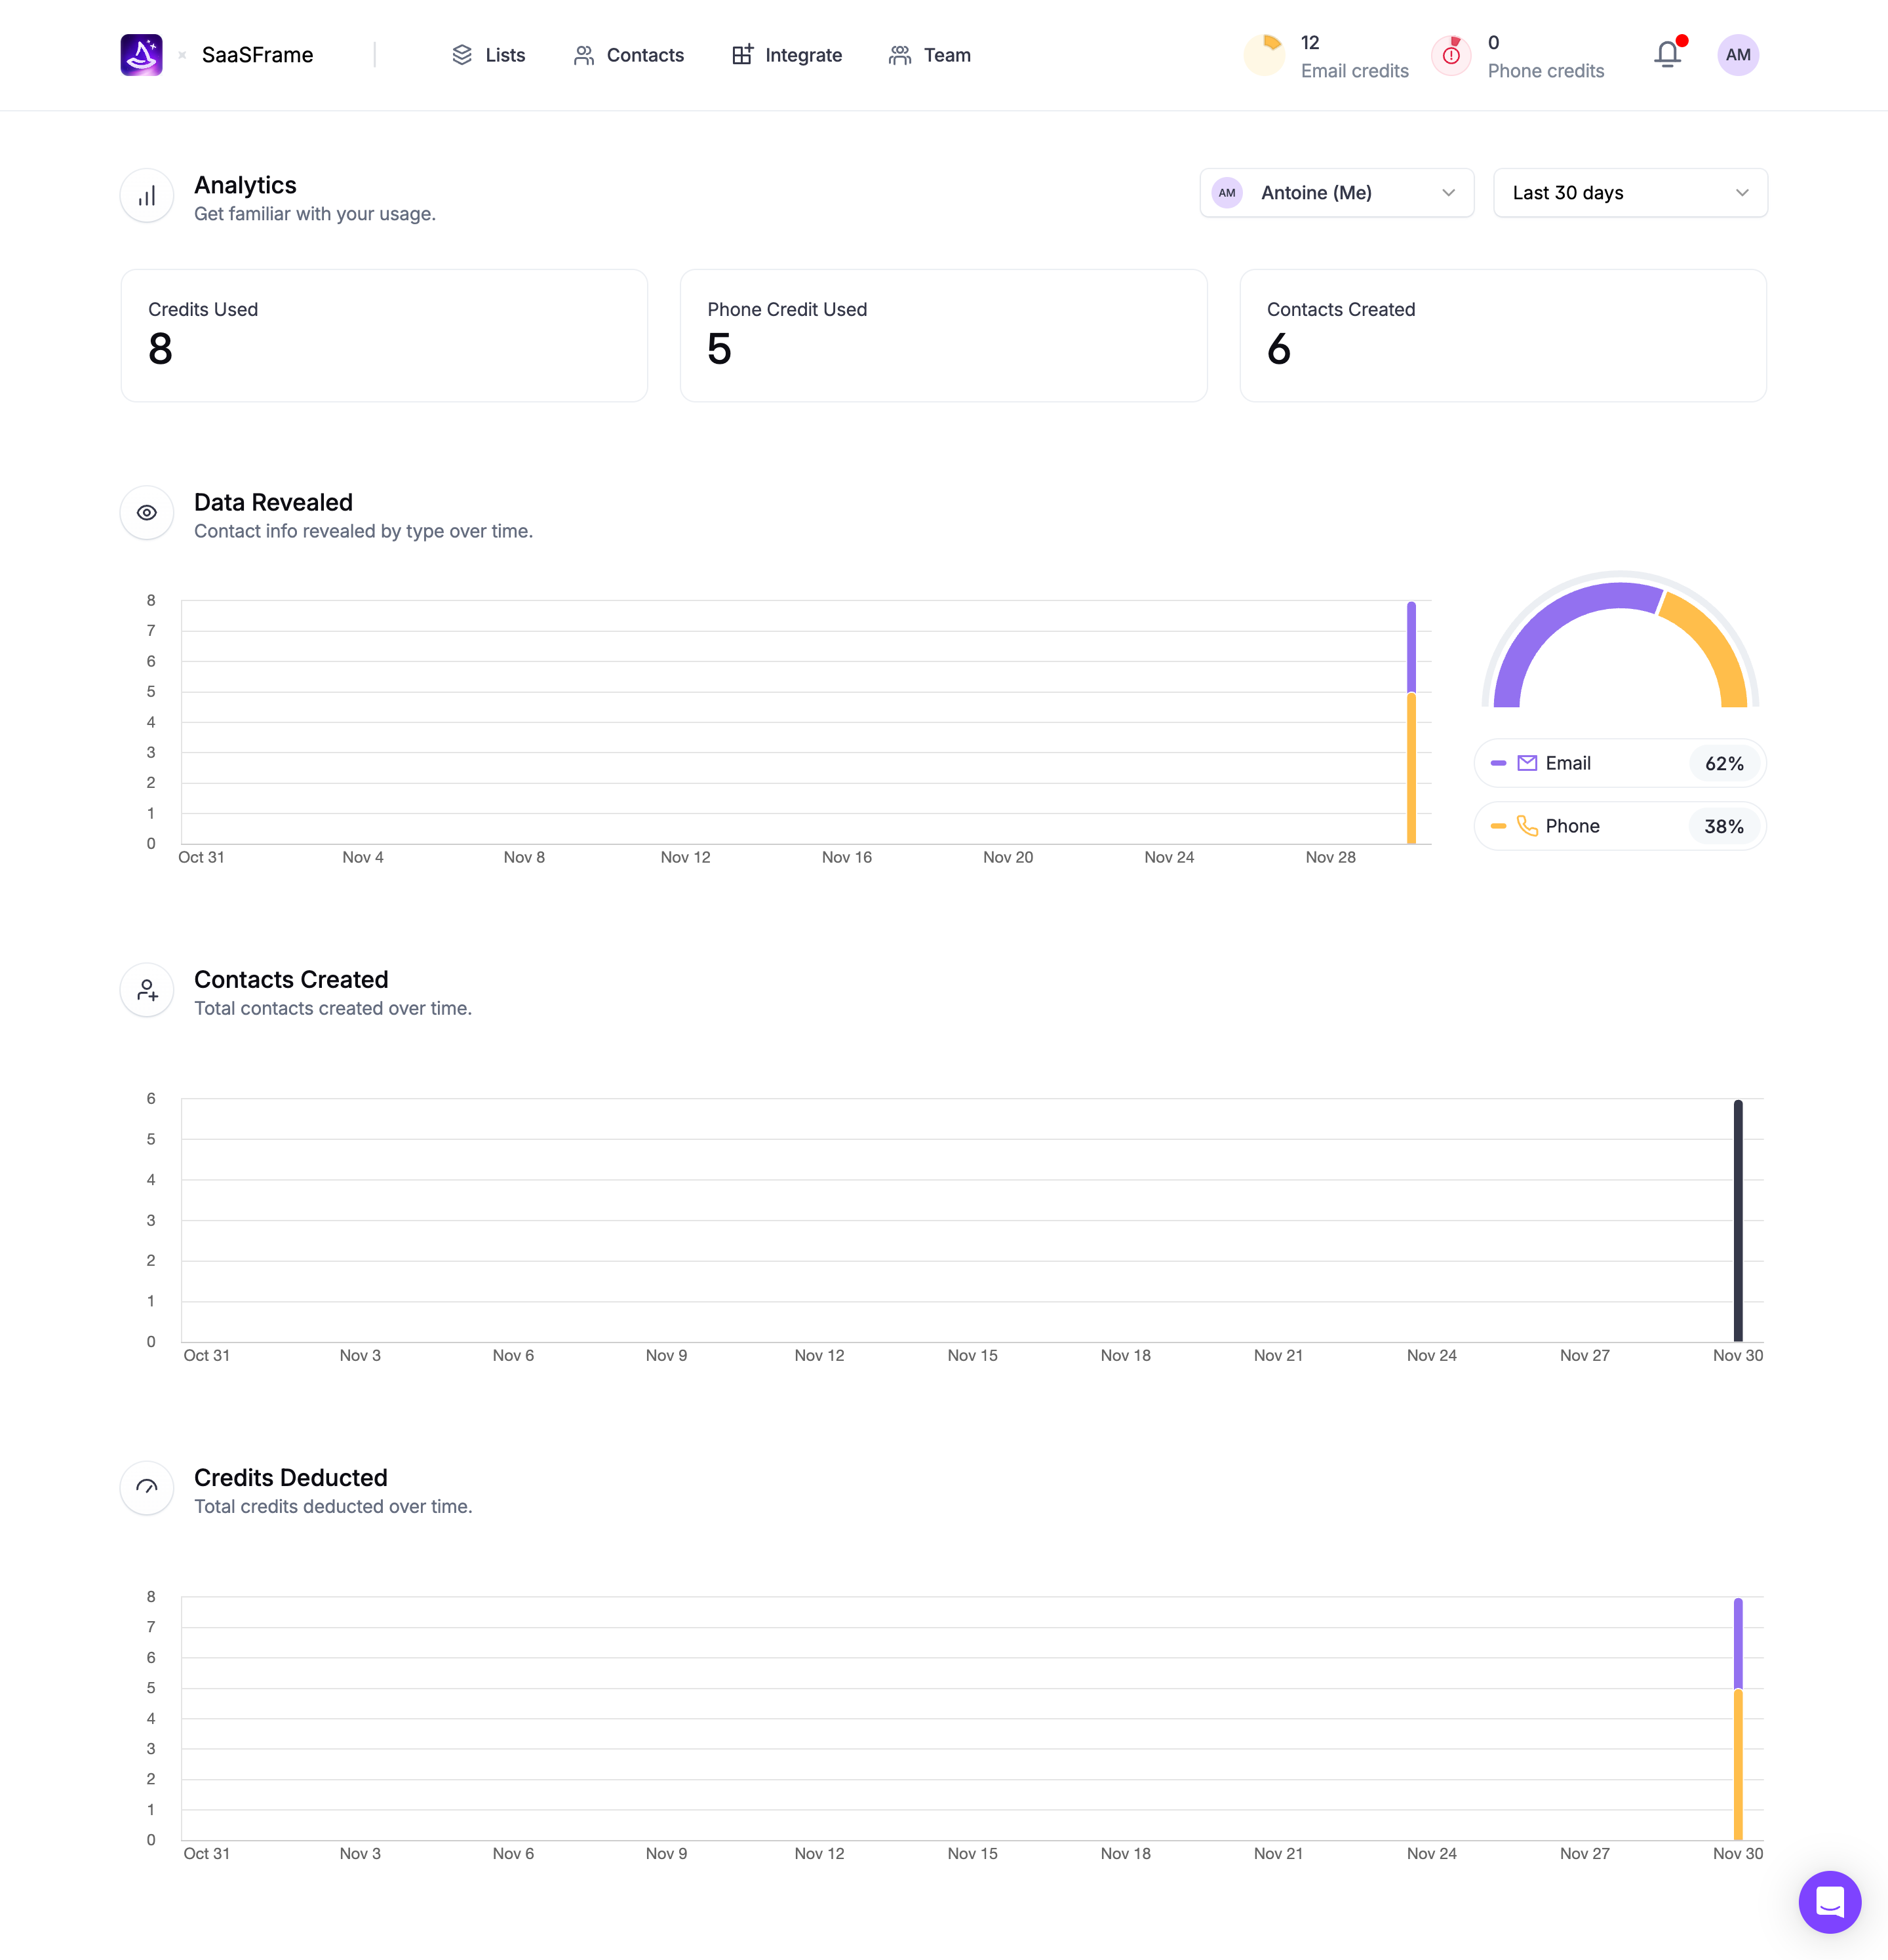
A summary value supports scanning. A trend supports temporal inspection. A breakdown explains contributors. A record list lets users inspect the underlying work. Connect these surfaces around the task rather than making every metric expand into the same generic chart.
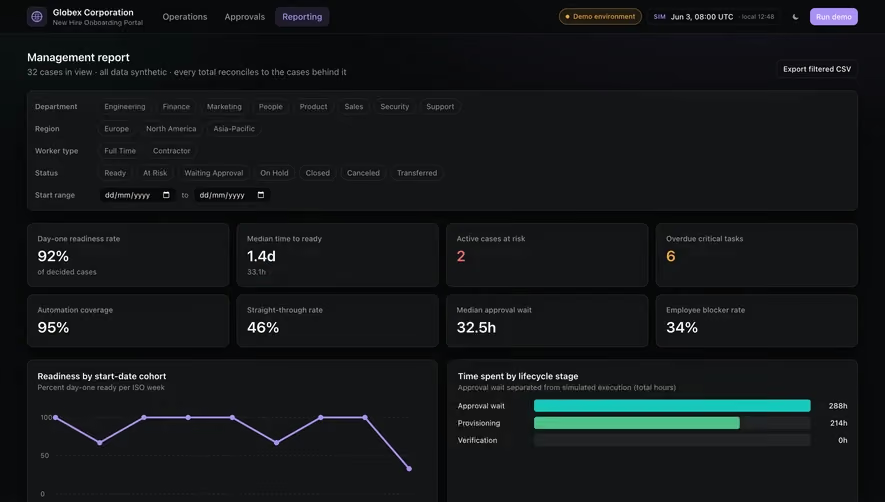
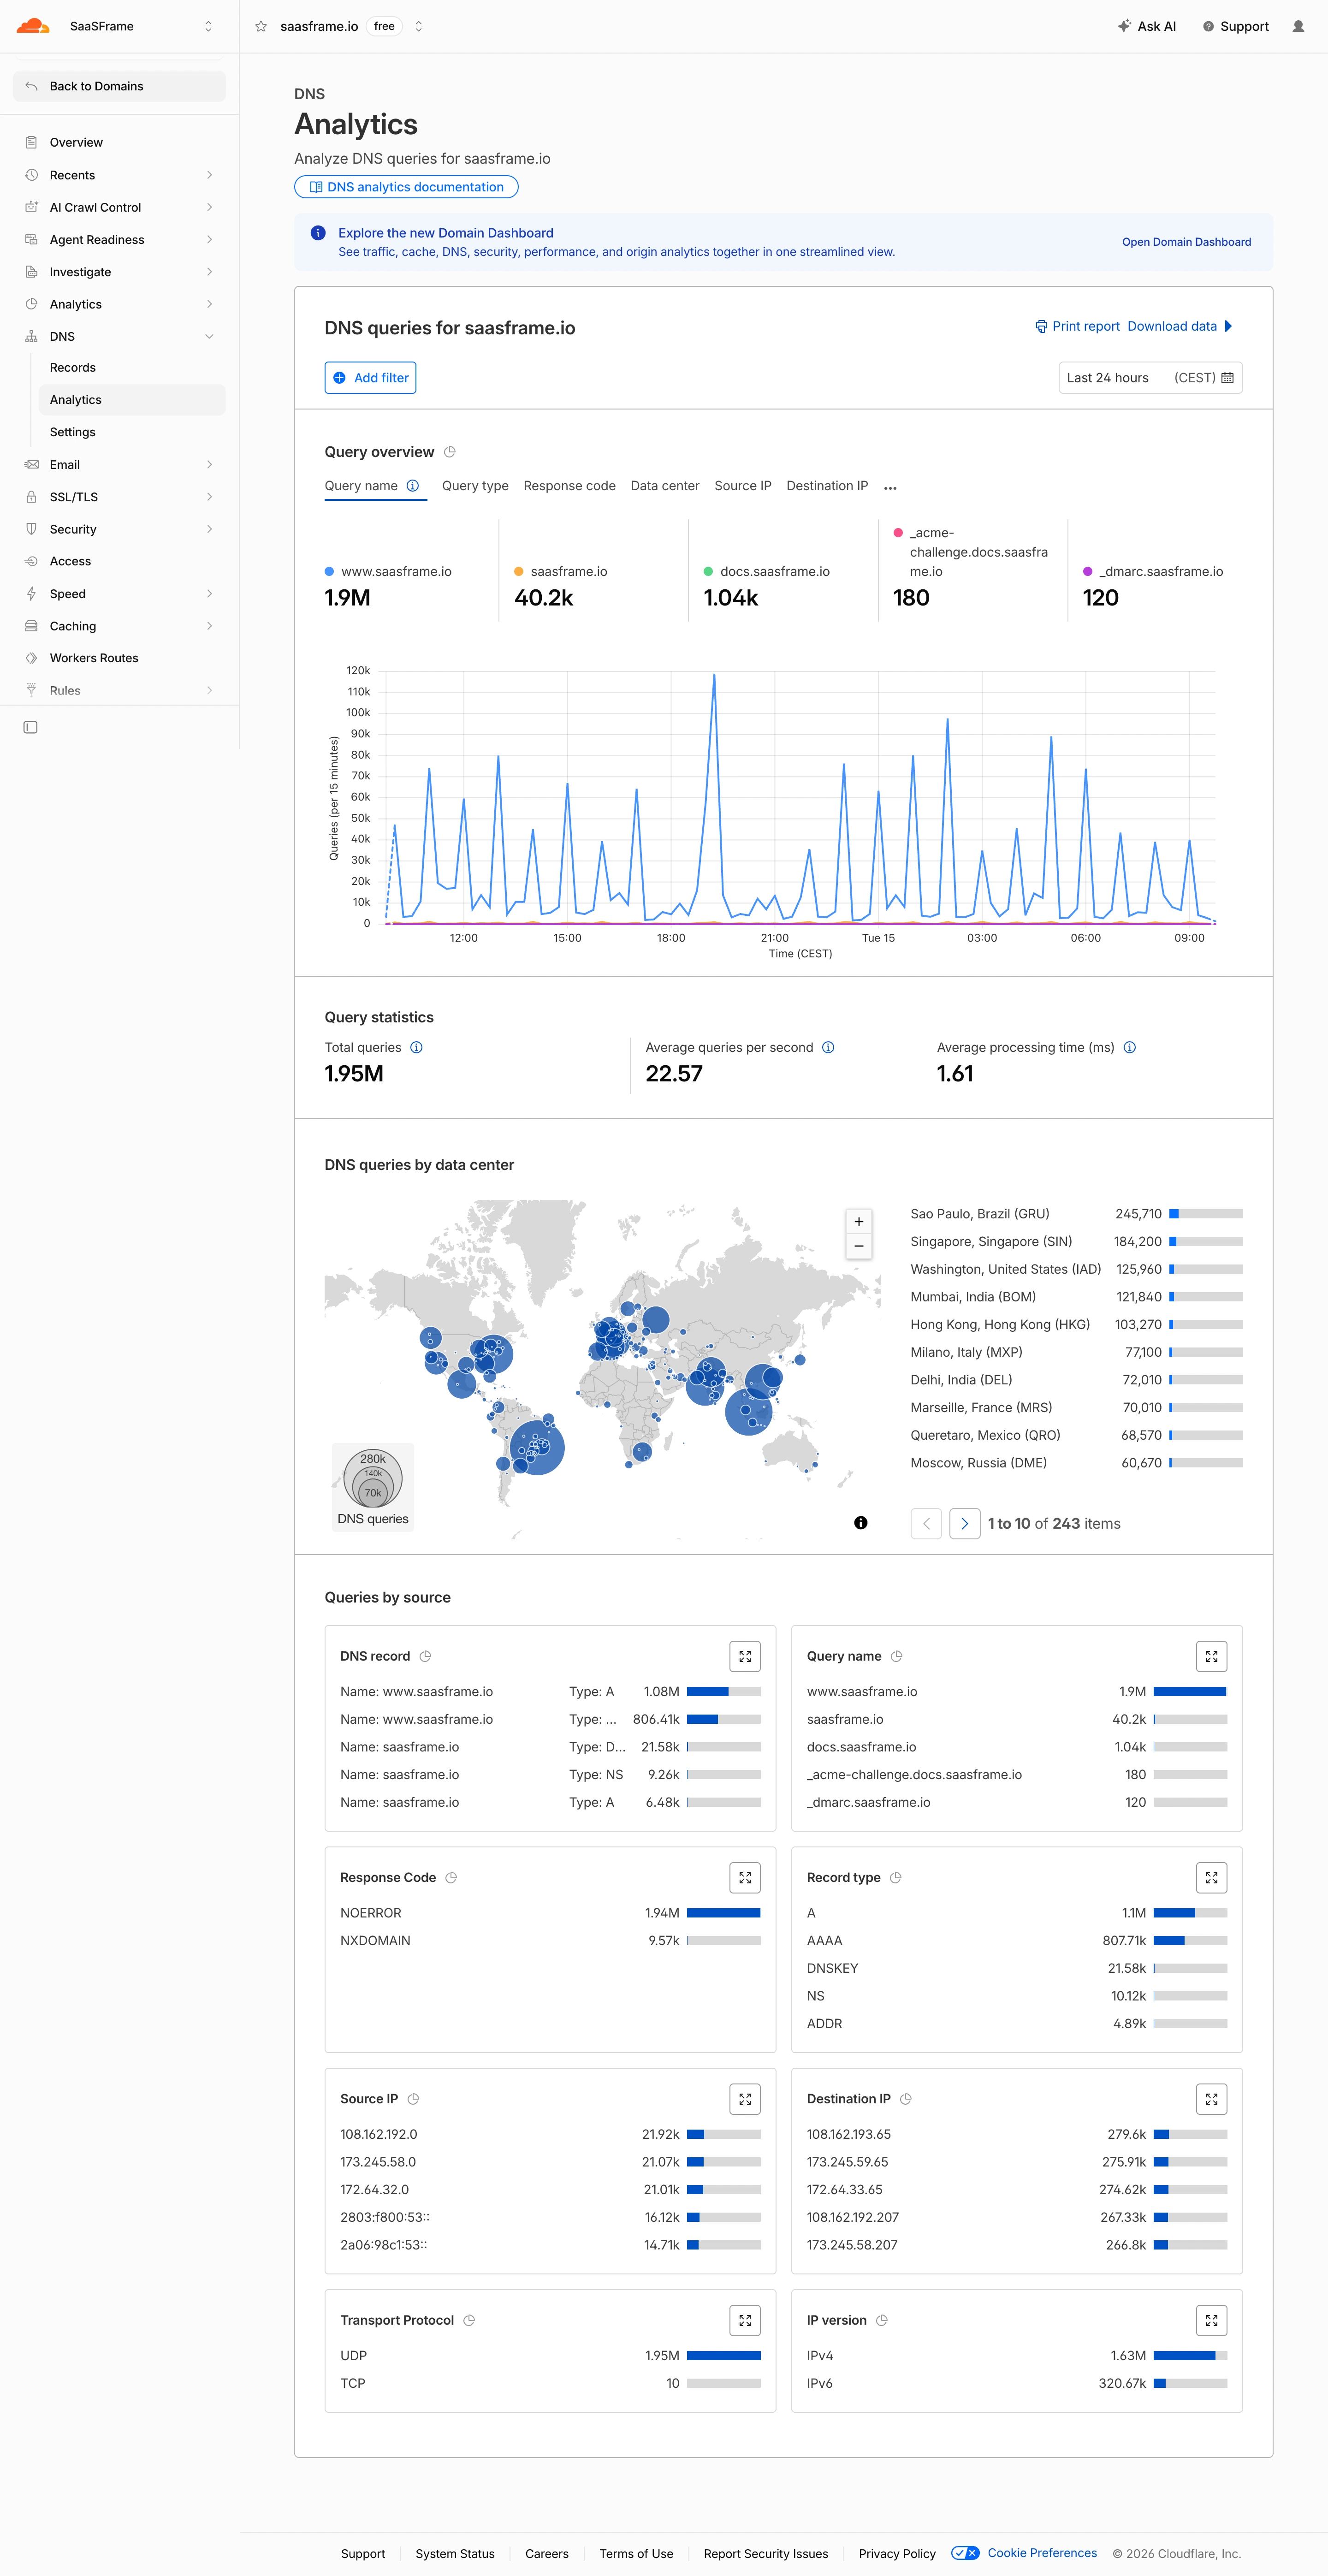
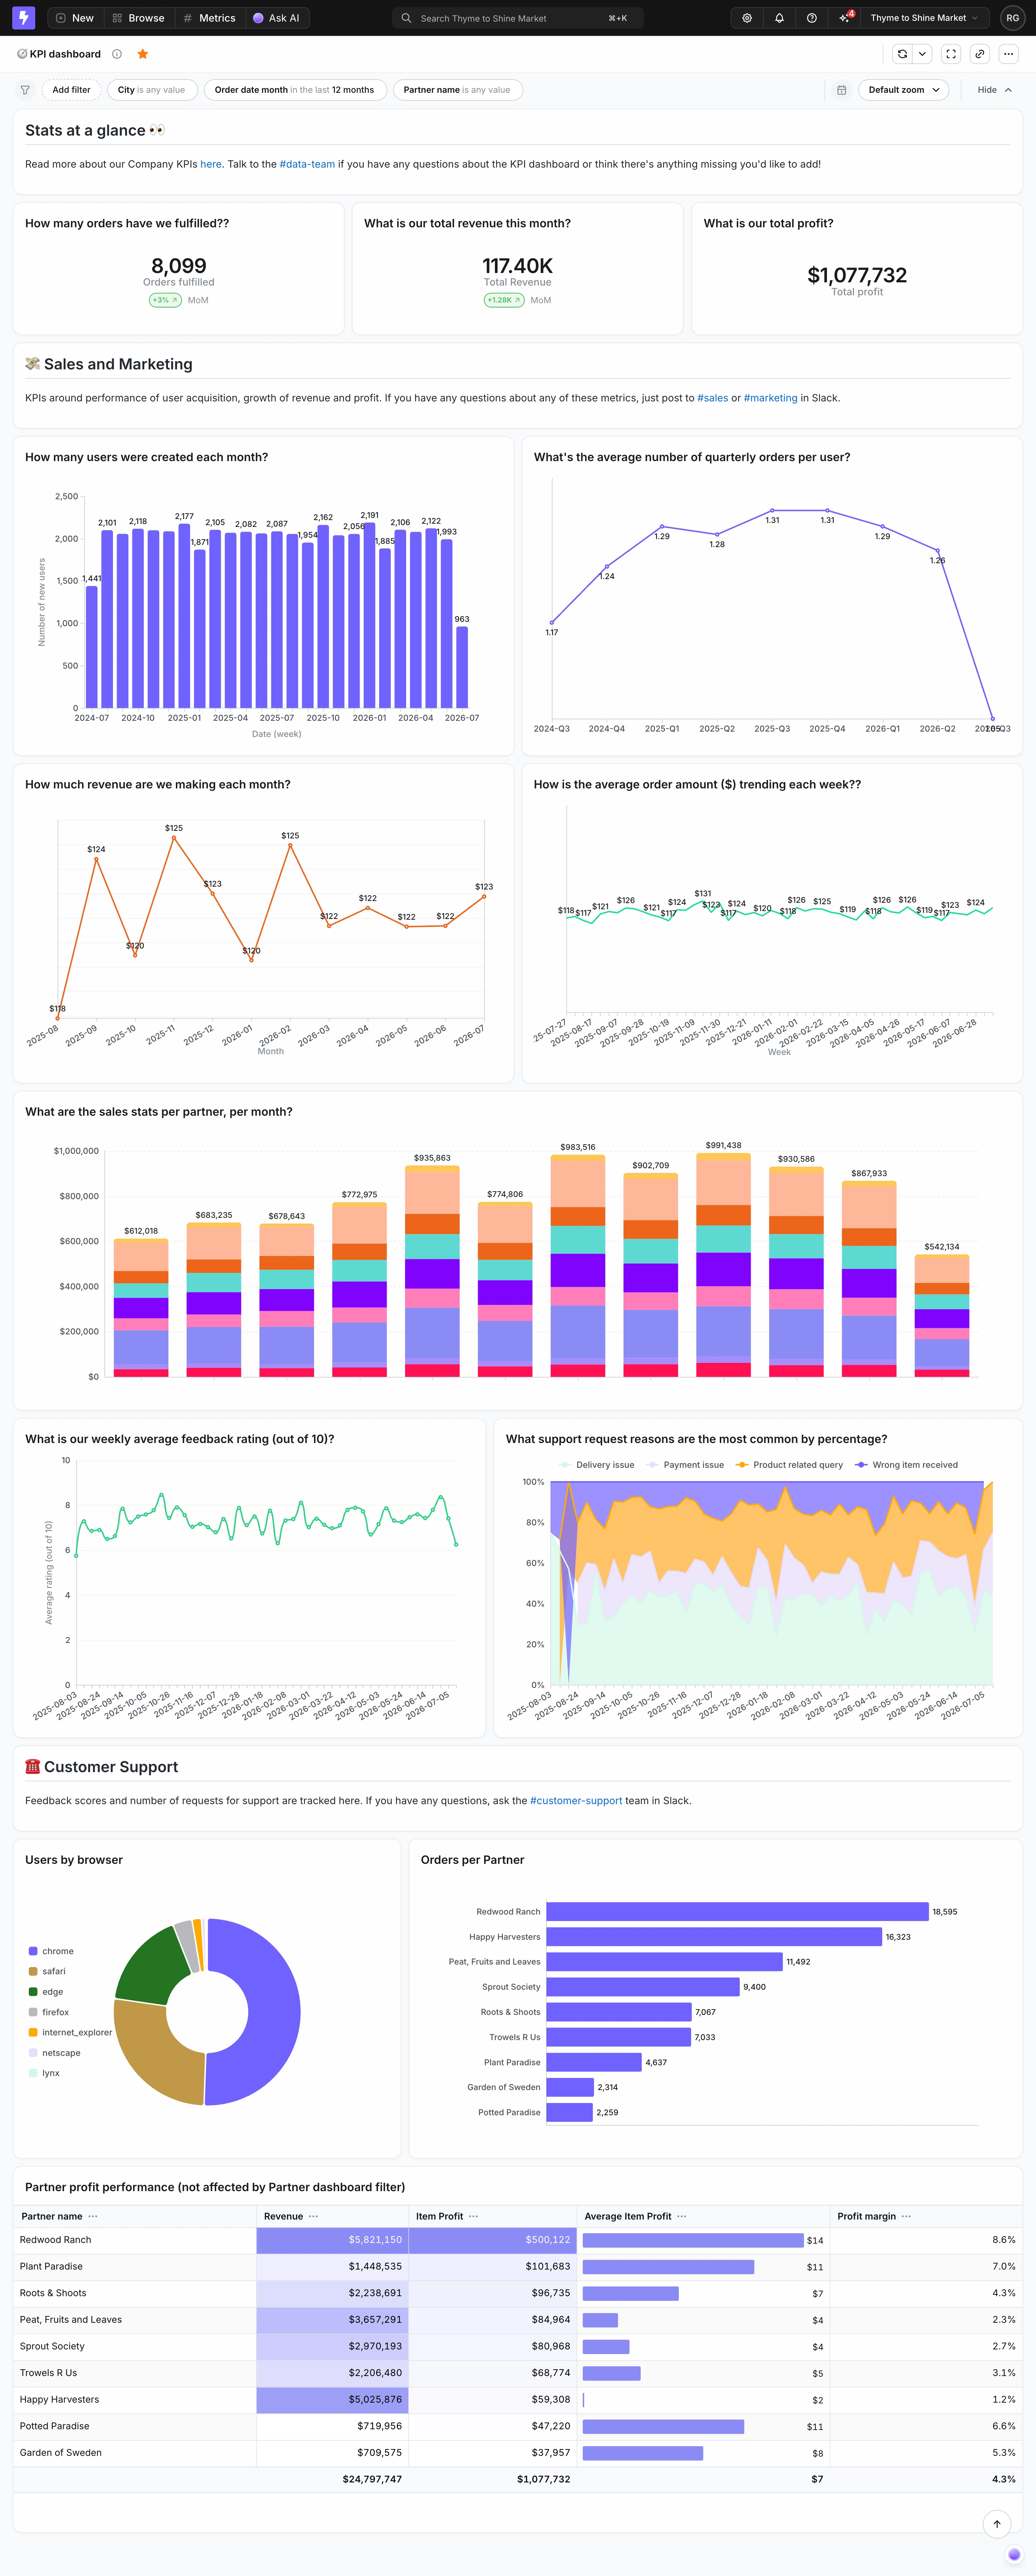
Use grouping to clarify related quantities. Totals and averages should not be mixed without labels, and metrics from different scopes should not look like one coherent set. Avoid a dashboard where proximity encourages invalid comparison between unrelated measures.
A detail action should make its destination predictable. Clicking a count may open matching records; clicking a rate may explain the calculation. Preserve the selected filters and date range when moving to detail, and provide a useful route back. The captured screens show available controls, not verified activation behavior.
Filters can change both the population and denominator. Show active scope and update related metrics consistently. If one panel remains unfiltered, label that distinction. Otherwise users may compare values that no longer describe the same population.
Aggregation across channels or workspaces needs a defined rule. Some measures can be summed; others require recalculation or cannot be combined meaningfully. Do not add percentages or averages merely because a dashboard needs a total. Use the appropriate calculation and explain material limitations.
Shared and saved views should preserve context. A recipient needs to know whether the link captures a fixed state or opens a live report. Account permissions may change which underlying records they can inspect. Keep summary access and detail access aligned with the product's actual boundaries.
Metrics should remain readable at narrow widths and with text enlargement. Keep the label associated with its value and comparison. Long translated labels may need more space than the original design example. Avoid shrinking meaningful text merely to preserve a rigid card height.
Accessible reading order should communicate the same relationship as the visual layout. A screen reader needs the label, value, unit, and relevant change context. An arrow or color alone should not carry the meaning. Exact-value access should not depend entirely on hover.
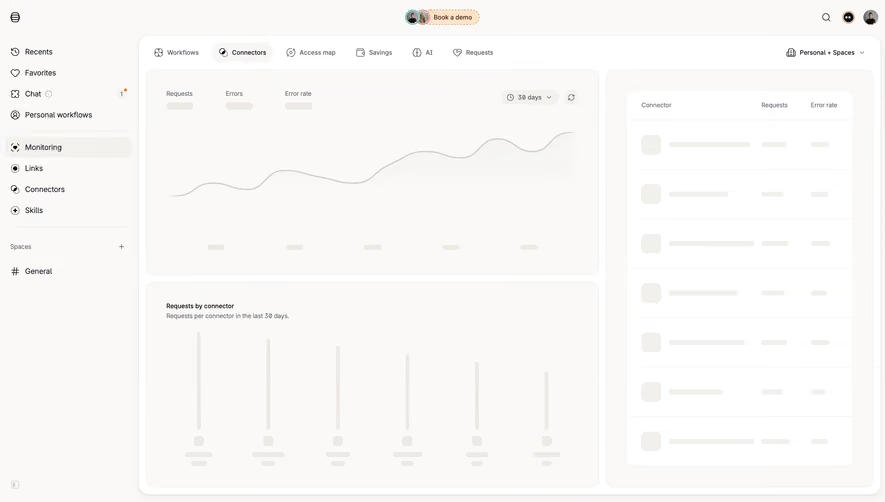
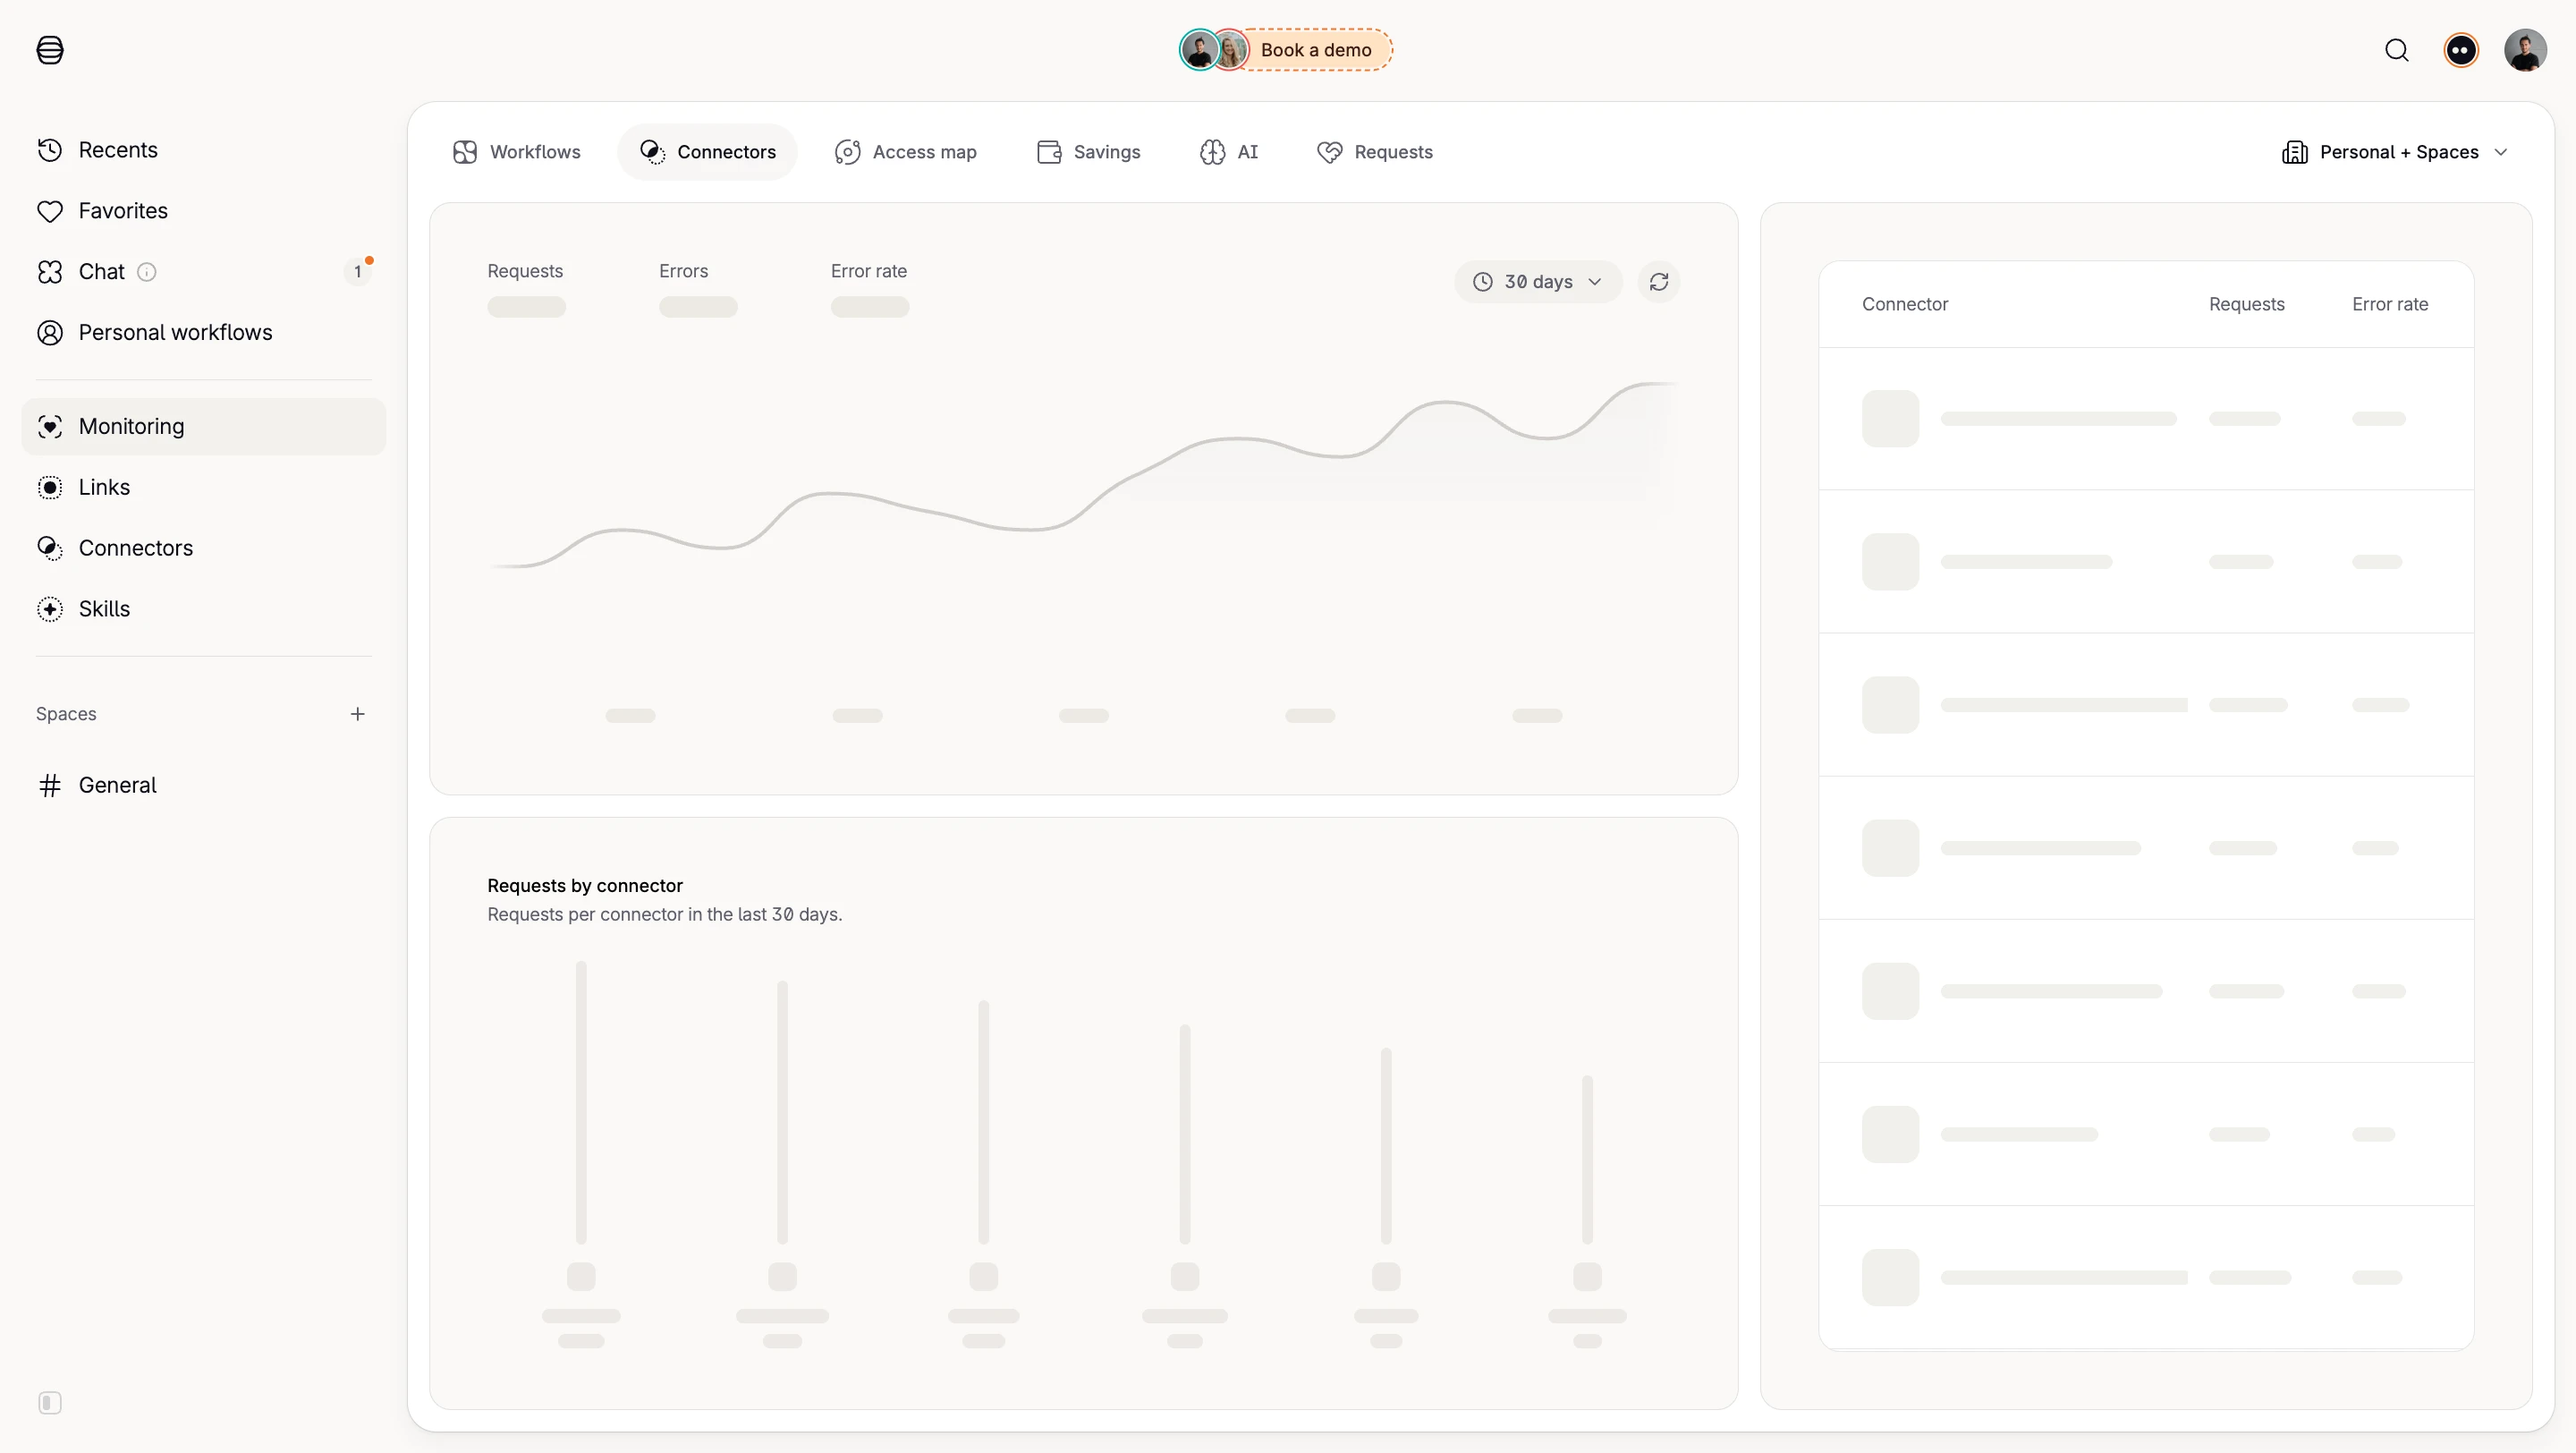
During refresh, distinguish loading from actual measurement. Do not animate placeholders in a way that suggests real changing values. If a refresh fails, identify the last known data where it remains visible. Avoid replacing useful context with a generic empty panel.
For regularly updating metrics, choose announcements carefully. Frequent background changes can overwhelm assistive technology and distract users. Communicate meaningful state transitions and offer inspection without forcing attention to every incremental update.
Ask users to explain the measure, period, scope, and comparison basis. Include a zero value, a missing value, an average, and a small baseline. Observe whether they draw the intended conclusion or rely on a color guess.
Then test the decision supported by the metric. Can users locate the underlying records, identify a contributor, or explain a change in a report? Interaction counts alone cannot show that a metric is useful. Review interpretation errors and the effort needed to correct them.
Use this checklist:
Maintain definitions when the data source changes. A familiar label can conceal a new event rule or counting method. If a comparison crosses that change, explain the discontinuity or use an appropriate comparable period. Visual consistency should not imply that the measurement remained identical.
Set thresholds deliberately. A warning may depend on capacity, a target, or an observed deviation, and each rule has a different meaning. Explain why the value is highlighted and what action is available. A metric should not become alarming solely because it changed, especially when normal variation is expected.
Distinguish a product measurement from a user-entered target. Both may appear in the same panel, but their sources differ. If a team edits the target, preserve the measured value and identify the new comparison basis. This prevents a changed goal from appearing to be a changed result.
For exported summaries, review rounding and notation again. A compact dashboard abbreviation may be unsuitable in a formal report, and an unlabeled percentage may lose context when separated from its panel. Preserve readable definitions and qualification in the format where the metric will actually be used.
No. A change is useful when the reference is meaningful. Some metrics need absolute context, a target, or a distribution instead. Do not add an unexplained percentage merely to make a summary card look analytical.
Usually that would not preserve their meaning. Use the calculation appropriate to the underlying quantities and denominators. Explain aggregation where readers could otherwise interpret it incorrectly.
Distinguish it from a measured zero. Explain whether the value is missing, delayed, or provisional, and identify older data if it remains visible. Provide an appropriate route to inspect or recover the source.
Explore the SaaSFrame metric examples to compare summary values, reporting context, and the interfaces that make measurement interpretable.