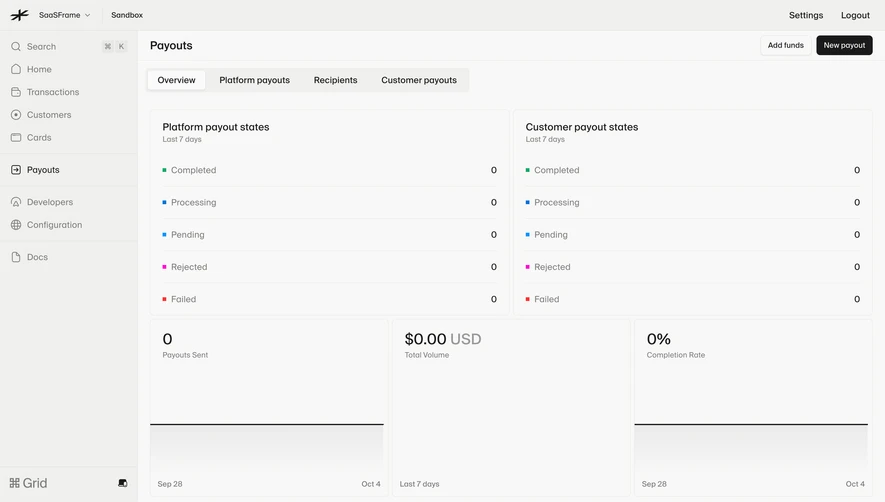
Generate a new design based on this screen using your own content.
Thank you! Your submission has been received!
Oops! Something went wrong while submitting the form.
# Design from Reference: Wiza Analytics
Create an original, high-fidelity visual design inspired by the reference. Prioritize composition, typography, colors, spacing, and component styling over technical implementation.
## Reference
- **Product:** Wiza
- **Category:** Analytics
- **Screenshot:** https://cdn.prod.website-files.com/5e9dc792e1210c5325f7ebbc/6acad57986f1bee9c365086c_6acad4a8cdf07ad61497e57f_cms-445e008fc6efe15f10002035.webp
Analyze the screenshot first. If inaccessible, request it rather than guessing.
## Content
{{content.instructions}}
{{content.data}}
Preserve essential messaging and factual accuracy. Adapt structure and copy length for visual balance; never invent product claims.
## Visual Design
Use this context to reproduce the reference's visual language: layout, typography, colors, spacing, borders, radii, and distinctive elements. The screenshot takes priority if descriptions conflict.
## Direction
{{preferences.fidelityInstructions}}
## Output
{{output.instructions}}
Deliver a polished, cohesive design with precise alignment, hierarchy, and spacing. Produce the requested visual artifact, not just a description. If unsupported, explain the limitation.
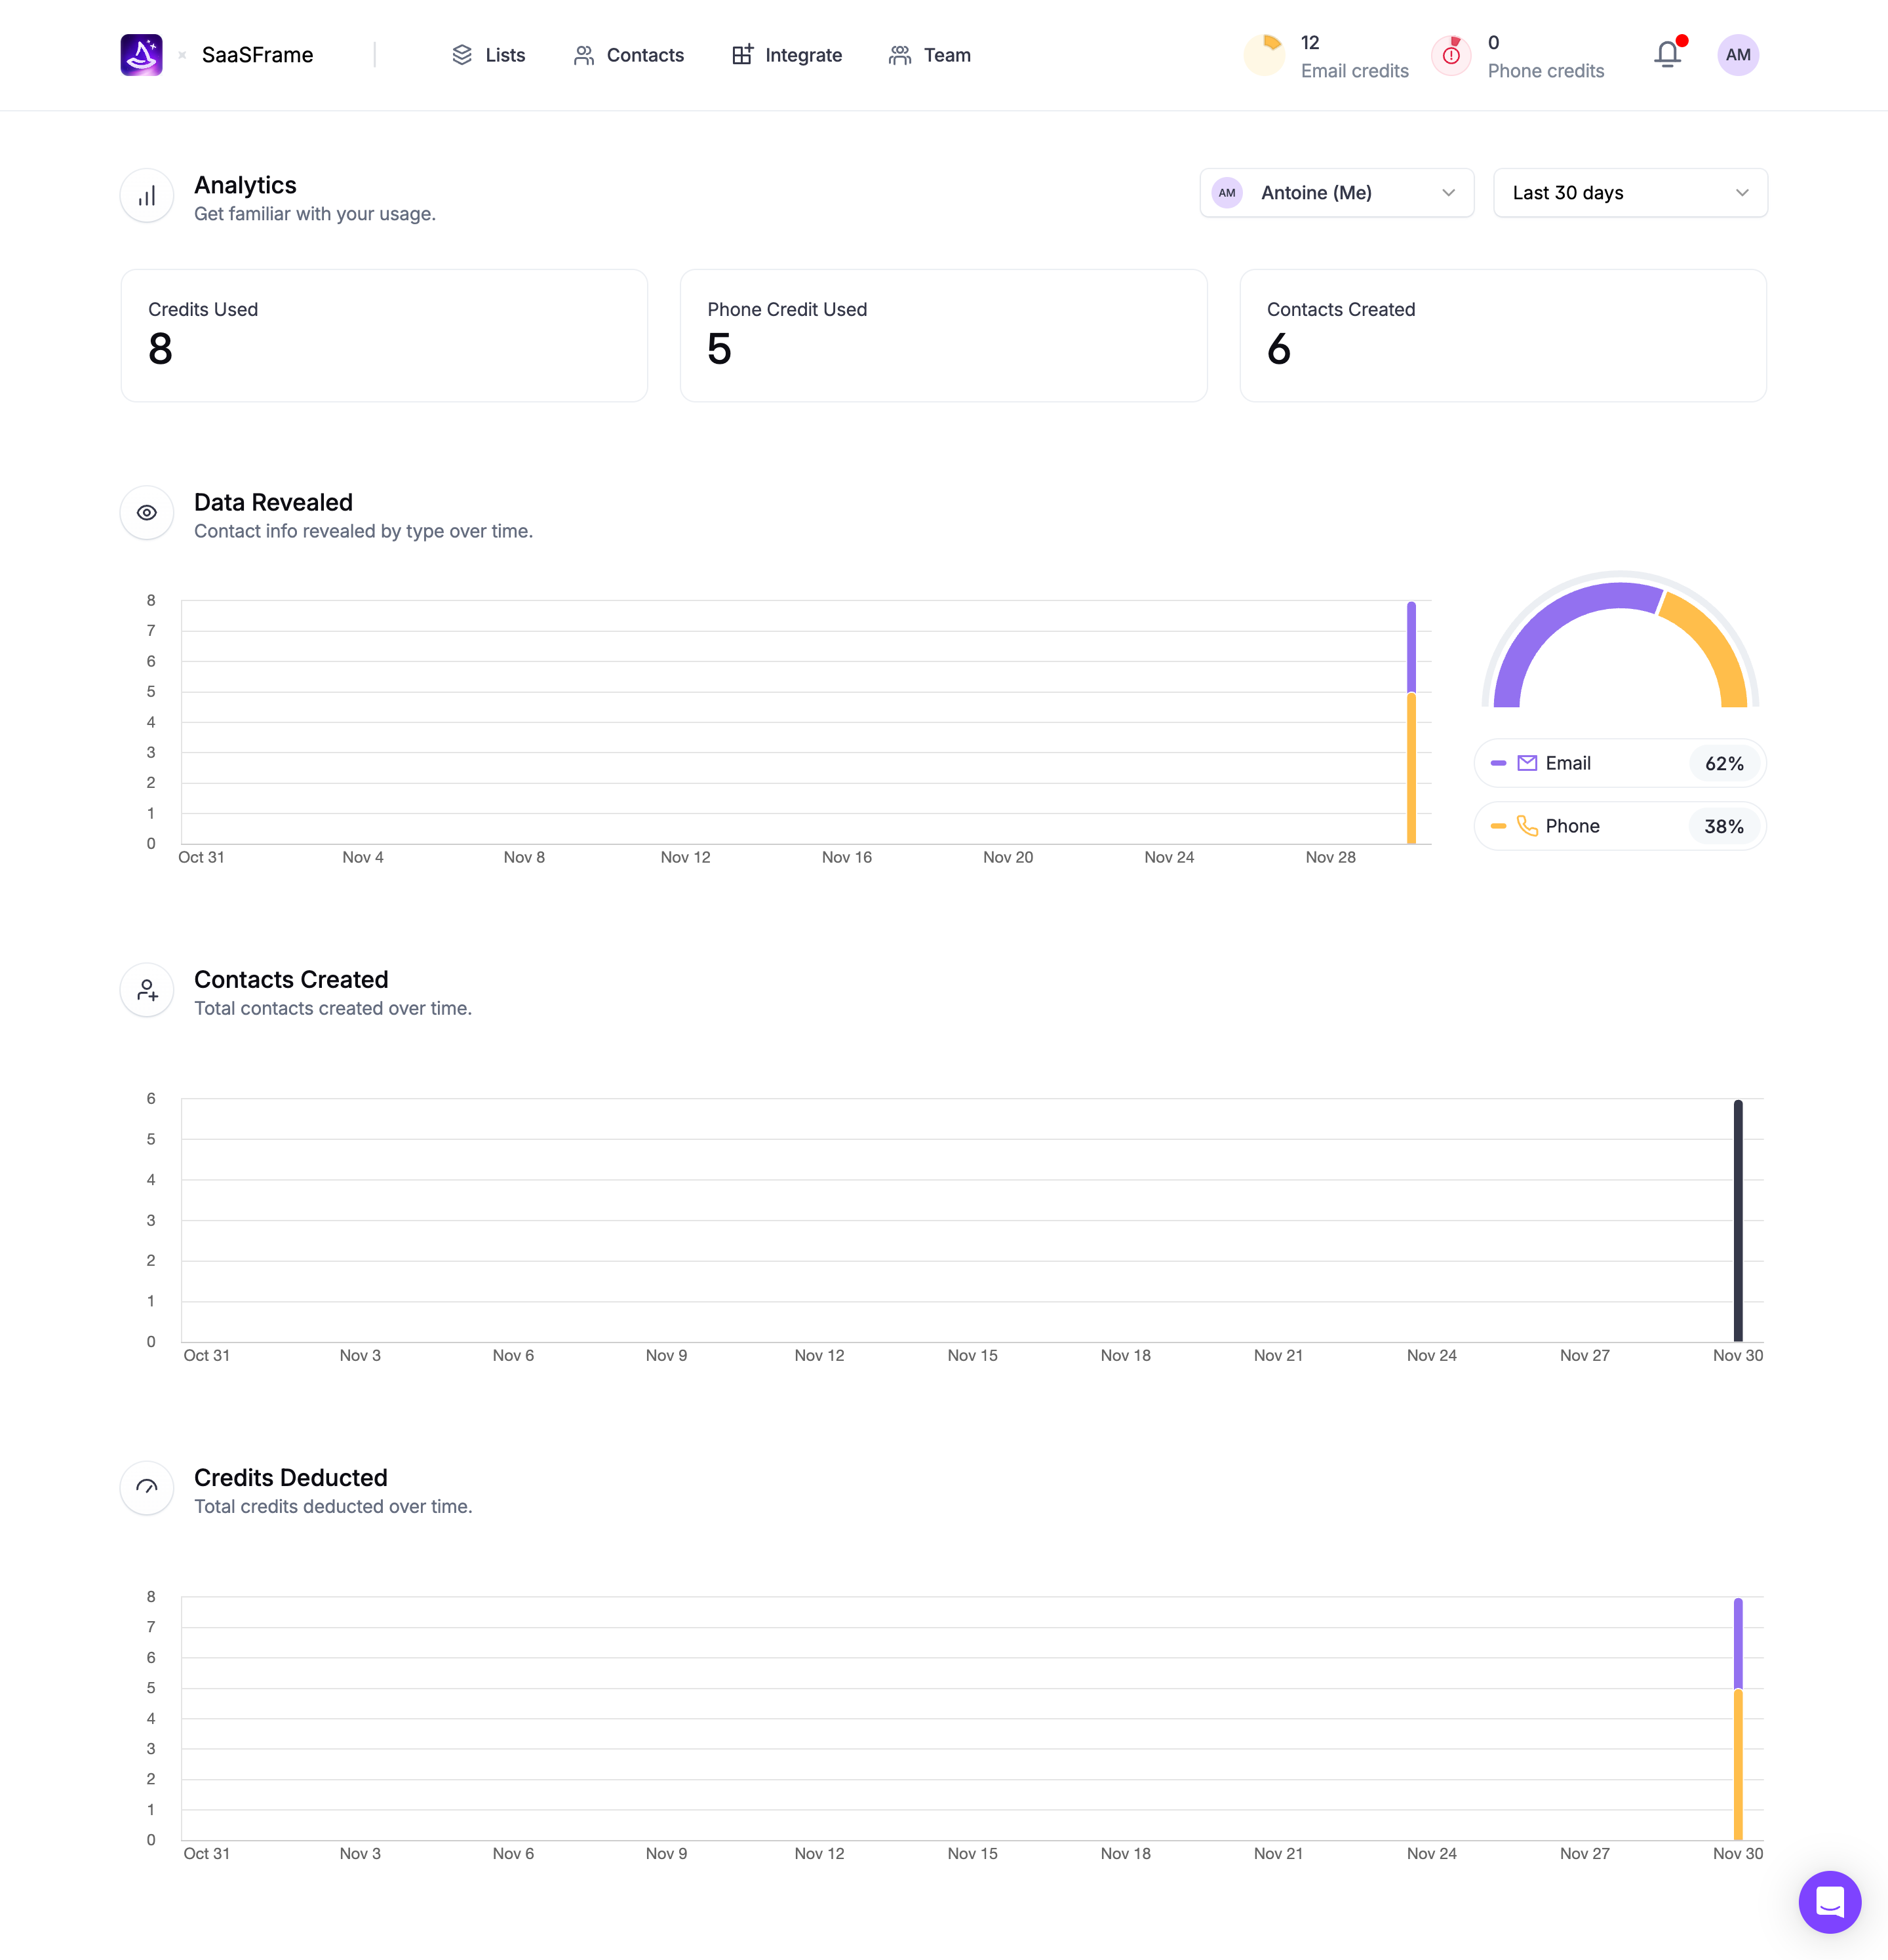
SaaSFrame's analytics dashboard nails the art of whitespace. Everything feels spaced out just right, giving each data block room to exist without competing for attention. The top stat cards hit you first. Credits Used, Phone Credits, Contacts Created. Big bold numbers, zero clutter.
Color With Restraint
The purple and gold palette is doing heavy lifting here. That donut chart on the right with Email at 62% and Phone at 38% pops without screaming. The bar charts use the same two accent colors consistently, which ties the whole page together. Smart choice keeping the background pure white and letting the data do the talking.
What Makes It Work
Typography is minimal. Section headers like "Data Revealed" and "Contacts Created" use tight, medium-weight sans-serif type with subtle gray descriptions underneath. The left-aligned icon + title pattern repeats cleanly across sections. One thing that stands out is how the time-series charts all share the same x-axis date range format, creating a visual rhythm as you scroll. The top nav with credit counters is a thoughtful touch for keeping resource awareness persistent.