 SaaSFrame
📈 Analytics
Visualize data effectively with professional SaaS Analytics and Reporting dashboard designs. See how top products use interactive charts, data filtering, and KPI widgets to turn complex information into actionable insights for their users.
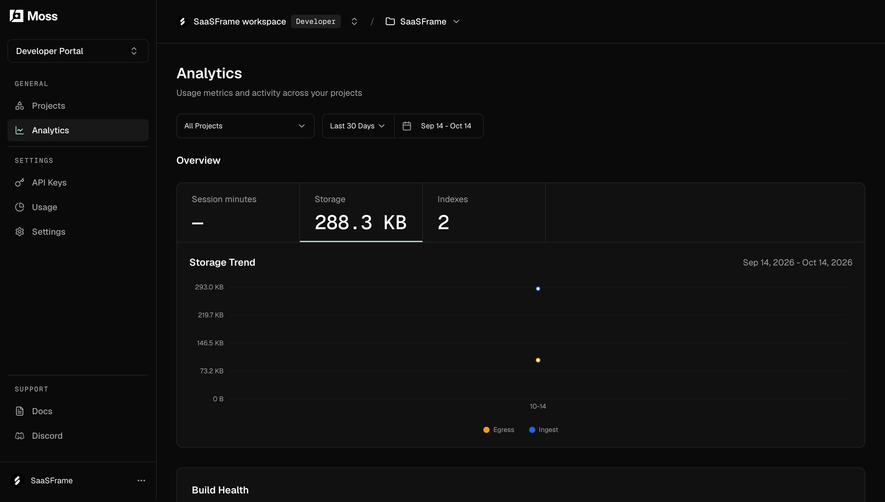

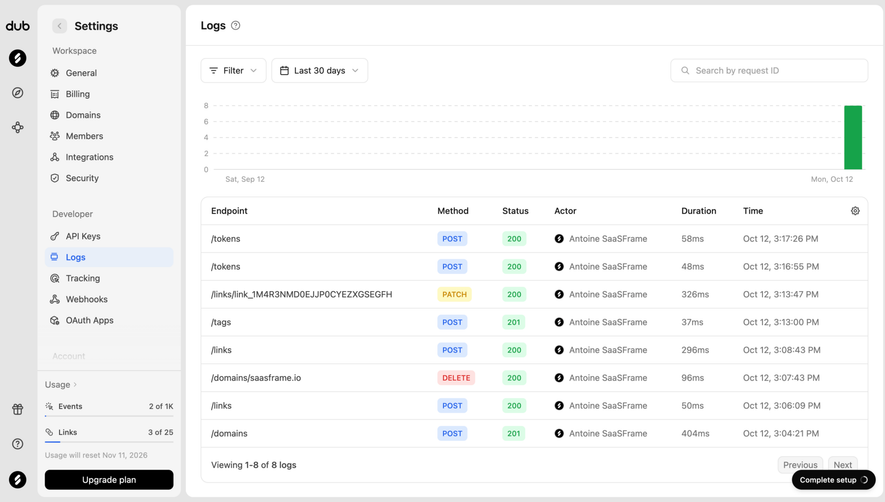

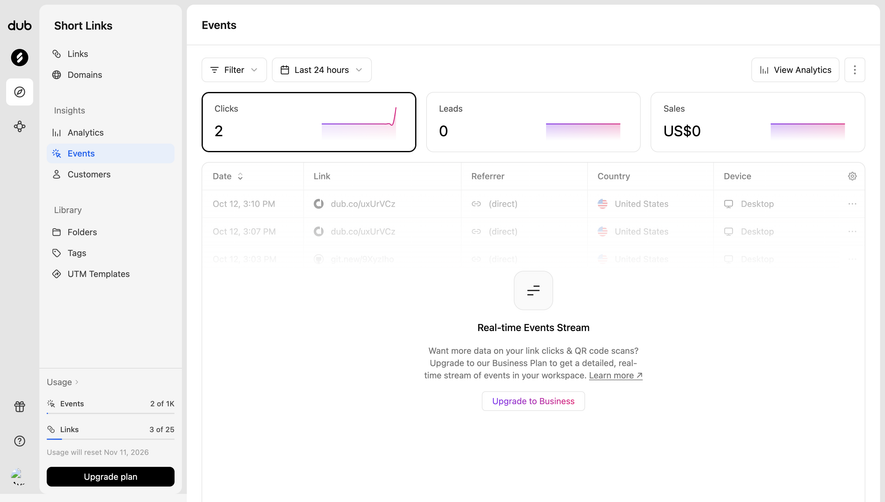
Index of all 81 Analytics examples
- Dub Link performance analytics
- Tines Onboarding Performance Report
- Lightspark Payout Overview
- EigenPal Automation monitoring dashboard
- Cloudflare Speed Observatory
- Cloudflare DNS Analytics
- Cloudflare Traffic Overview
- Cloudflare AI Crawl Metrics
- Cloudflare AI Crawl Overview
- Lightdash Metric Analytics
- Lightdash Company KPI
- Lightdash KPI Dashboard
- Dust Analytics
- Visitors Analytics Dashboard
- Atlas Building Footprints Chart
- Pitch Total Visits Analytics
- Pitch Viewed Slides Analytics
- Pitch Time Spent Analytics
- Customer.io Segments Peoples
- Customer.io Campaign Overview
- Checkout.com Risk Analytics
- Checkout.com Intelligent Acceptance
- Steep Analytics
- Steep Analytics
- Steep Analytics
- Wiza Analytics
- Latitude Project Dashboard
- Intercom Reports
- June Analytics
- June Report
- Dock Activity Analytics
- Plausible Analytics Dashboard
- Meiro Analytics
- Meiro Empty Analytics
- Zeda.io Analytics Details
- Zeda.io Analytics
- Stripe Billing Analytics
- Stripe Analytics
- Mixpanel Analytics
- Mixpanel Analytics
- Mixpanel Analytics
- DataPulse Analytics
- Conduktor Analytics
- Folio Analytics
- Formcarry Form Analytics
- Luma Analytics
- Luma Event Insights
- Pirsch Analytics Dashboard
- Hotjar Analytics
- Lemon Squeezy Dashboard
- Café Directory Analytics
- Café Social Analytics
- Café Locations Analytics
- Crew Analytics
- Narrative BI Analytics
- Narrative BI Analytics
- Narrative BI Analytics
- Buffer Analytics
- Kinsta Analytics
- Kinsta Analytics
- Buffer Analytics
- Kinsta Analytics
- Kinsta Analytics
- Kinsta Analytics
- Aircall Analytics
- Kinsta Analytics
- Buffer Analytics
- Kinsta Analytics
- Teachable Analytics
- Buffer Analytics
- Mixpanel Analytics
- Tapfiliate Analytics
- Proof Analytics
- Aircall Analytics
- Front Analytics
- Guru Analytics
- Clearbit Analytics Interface
- Close Analytics Page
📈 Analytics: design guide
A SaaS analytics interface helps users turn recorded activity into a decision. Its design should make the metric, time window, population, and comparison understandable before a chart invites interpretation.
The SaaSFrame references below show call analytics, social analytics, and payout summaries. Each organizes a different kind of evidence, so the useful design lesson is the relationship between scope and interpretation rather than a universal dashboard layout.
Start with the decision the report supports
A report for operational triage differs from a report for long-term planning. Identify what a user should decide, then choose the metrics and level of detail needed for that decision.
Do not treat the presence of charts as the definition of analytics. A compact status breakdown can be more useful than a trend line when the task is understanding today's queue.
Keep metric labels specific. Count, duration, value, rate, and average answer different questions and should not be presented with interchangeable formatting.
Make filtering part of the report's meaning
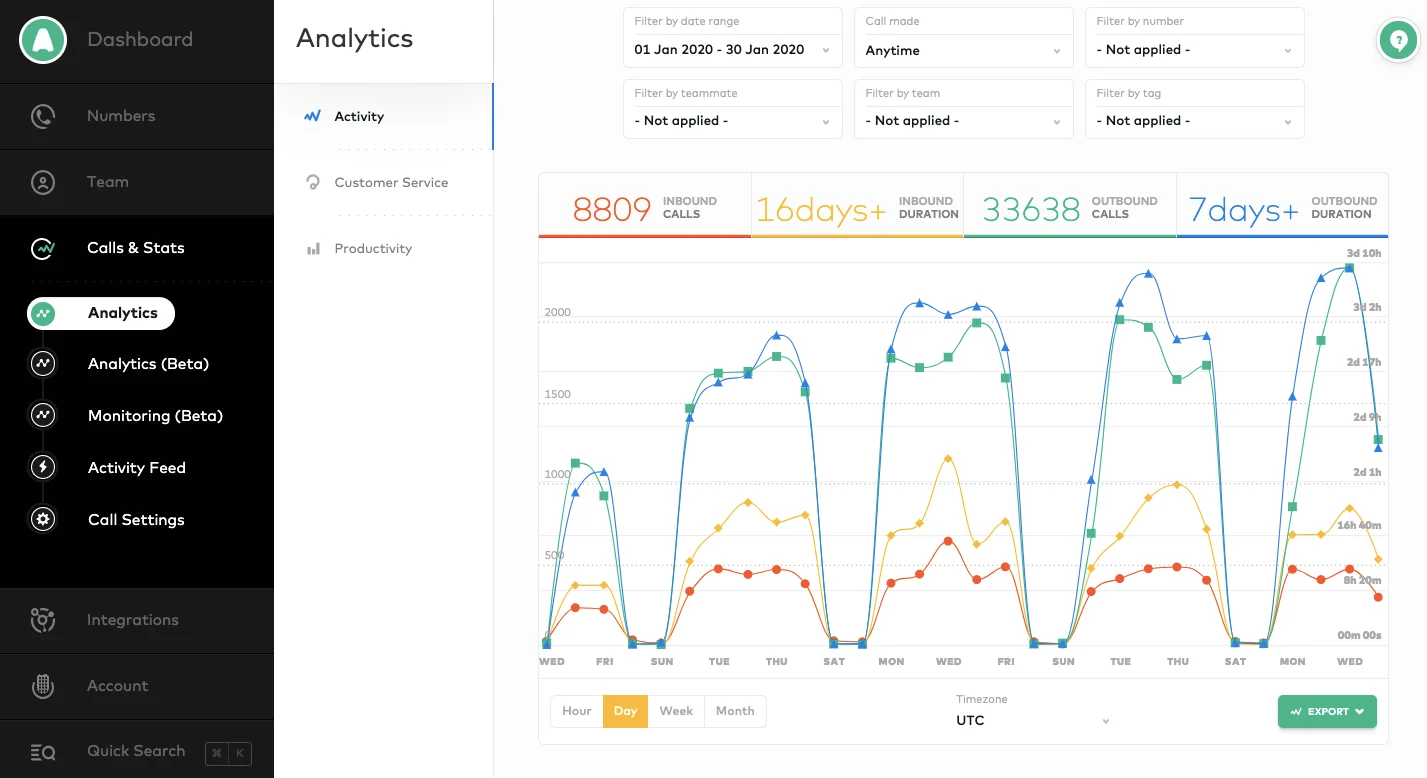
The Aircall reference places date range and filters for call-related dimensions above summary values and a time series. A visible timezone and granularity controls help describe the timeline.
These controls define the population behind the numbers. A report should keep that context visible after interaction, especially when filtered results could be mistaken for organization-wide totals.
Design reset behavior deliberately. Users need to understand whether resetting returns to all available data, a default period, or a saved report configuration.
Explain comparisons beside their values
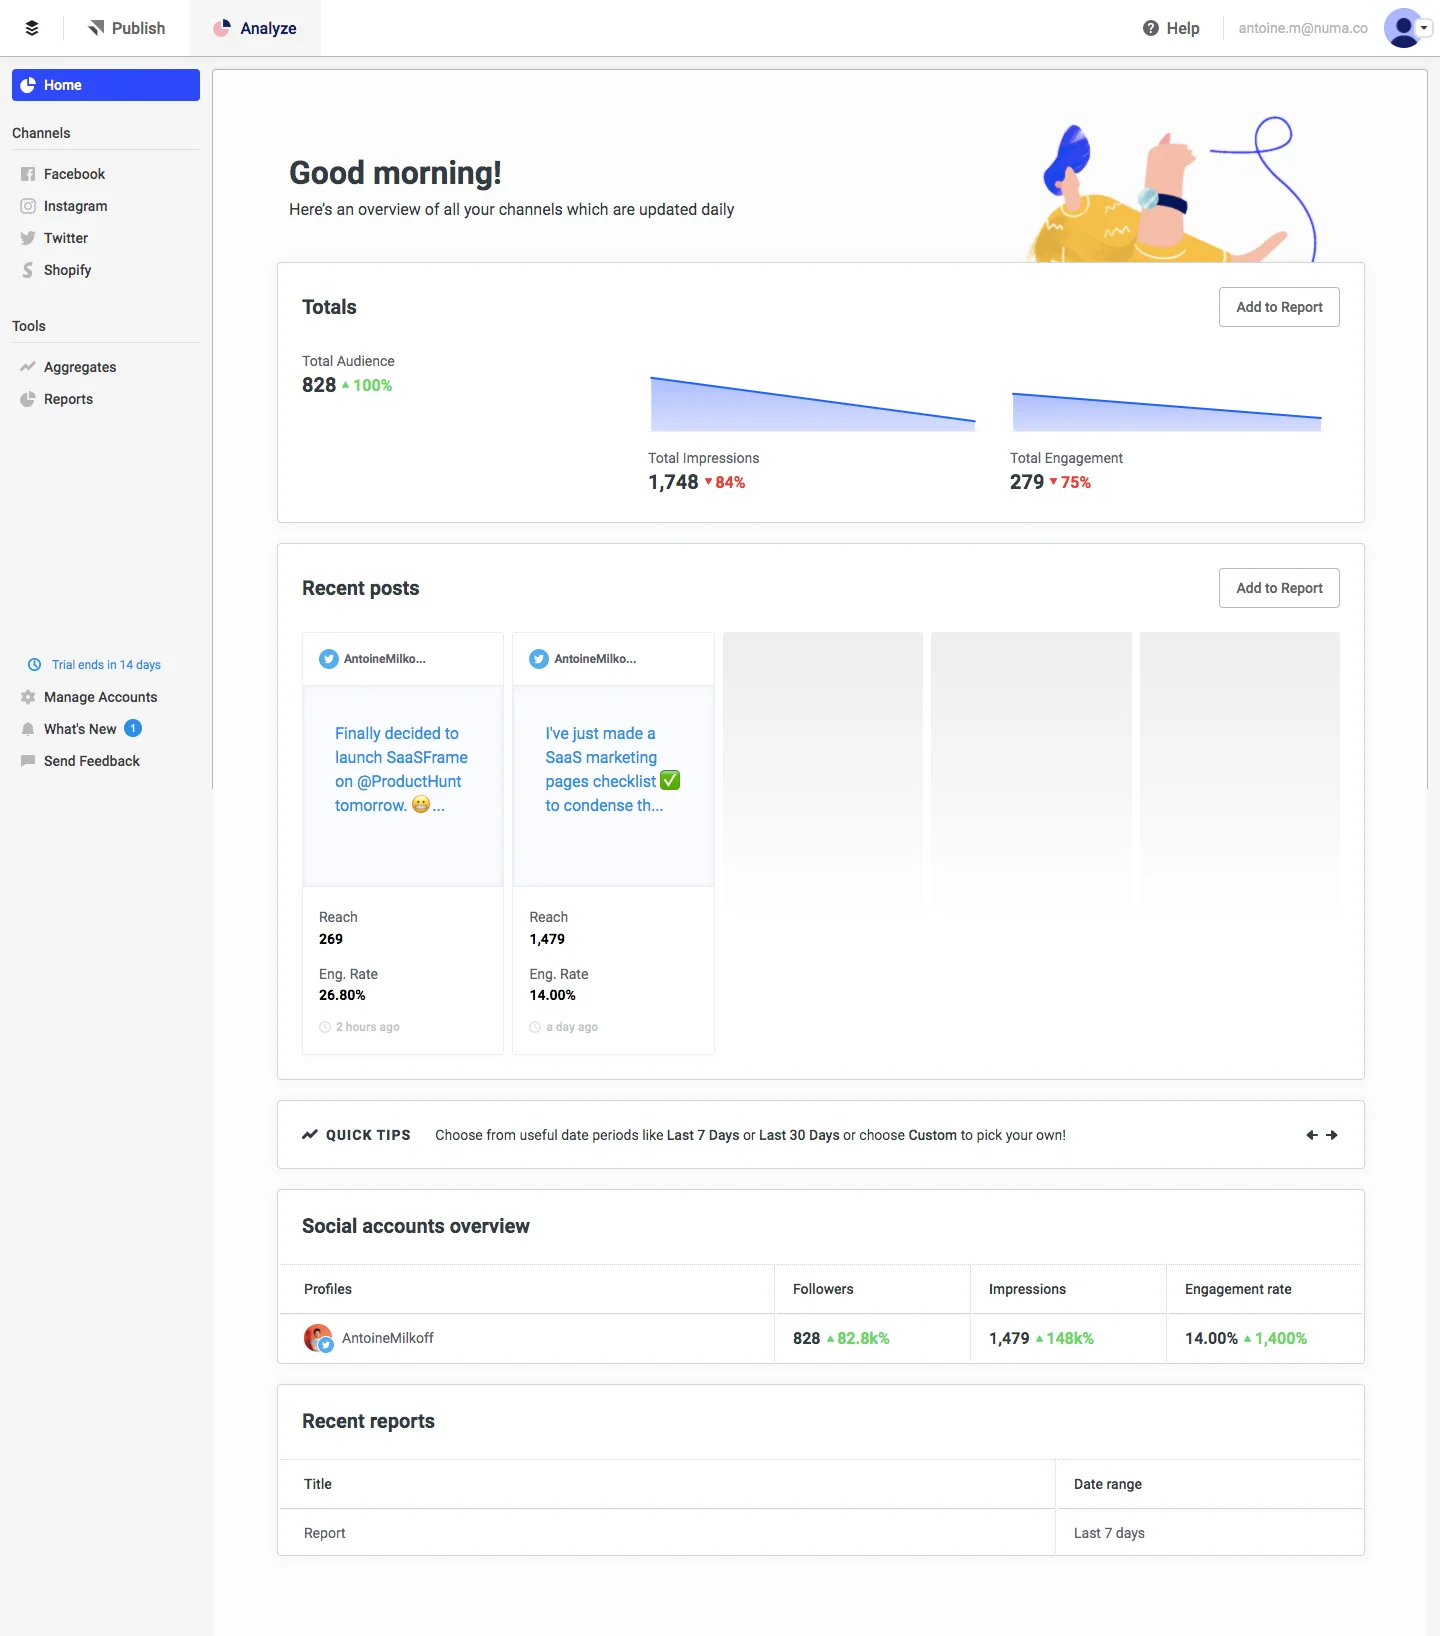
The Buffer analytics capture combines audience, impressions, and engagement summaries with recent posts and channel-level information. Its visible copy identifies an update cadence and the report's overview role.
A summary can connect high-level change to contributing content. Keep the comparison period and calculation understandable so users do not interpret every upward indicator as the same kind of improvement.
Different metrics may have different denominators or refresh times. Explain those differences where they influence interpretation rather than hiding every definition in a general help area.
Distinguish empty activity from unavailable data
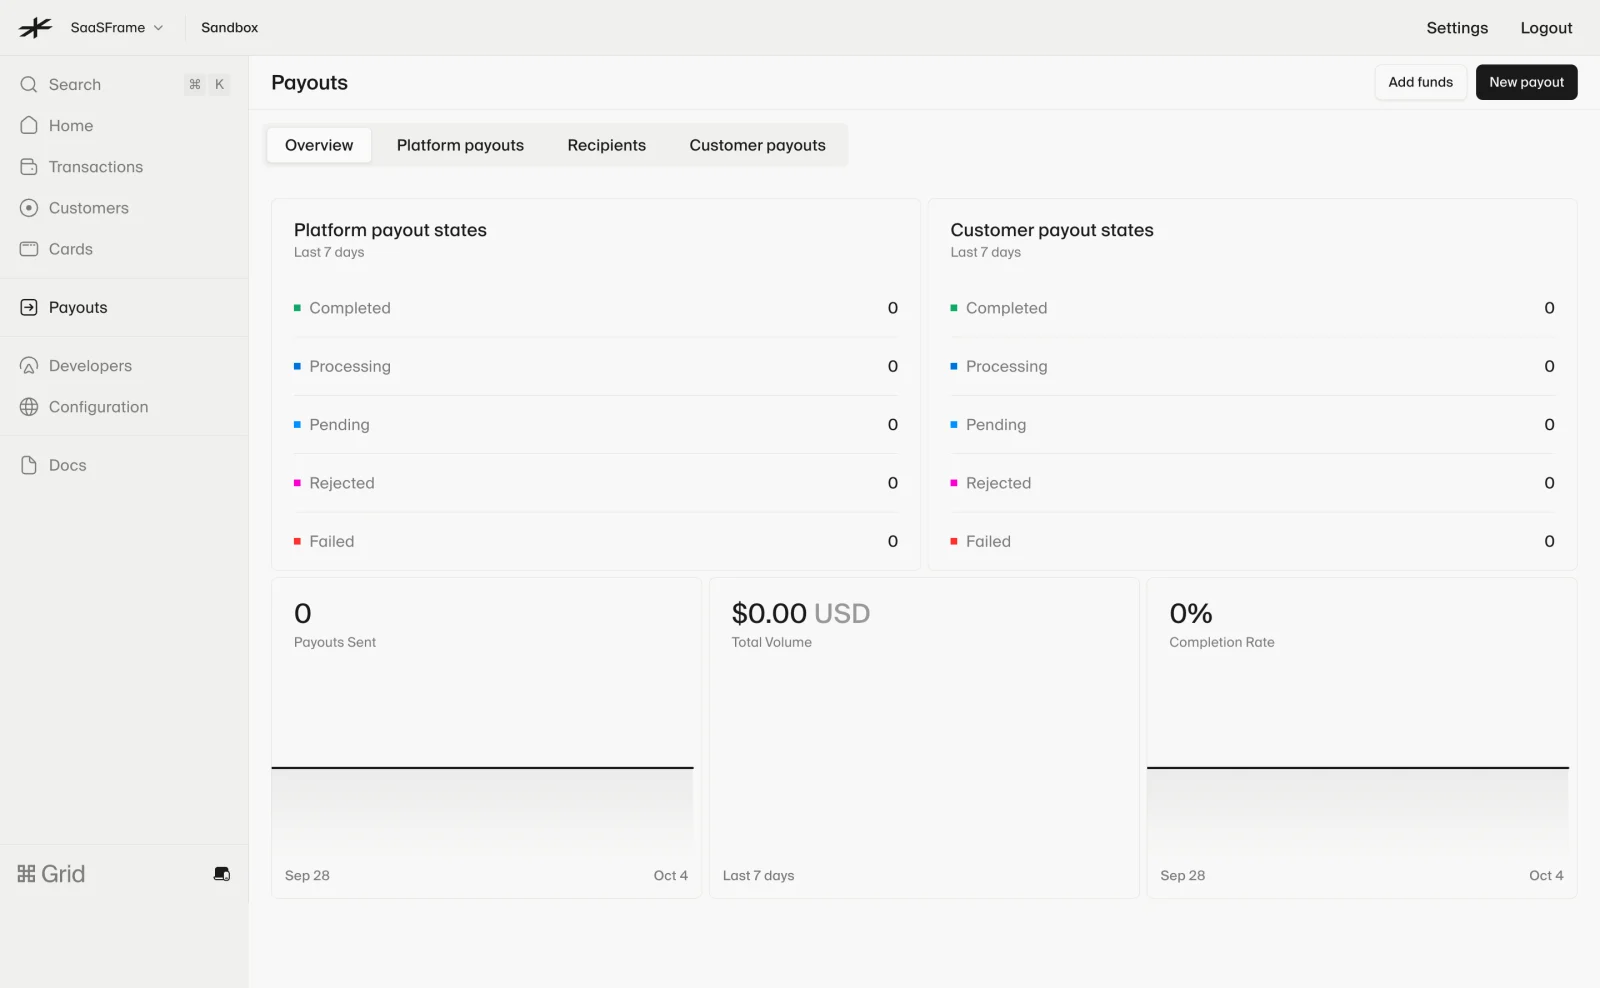
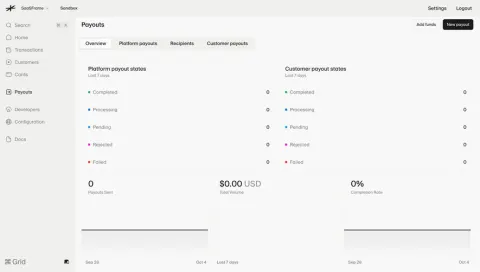
The Lightspark payout overview shows platform and customer payout-state breakdowns alongside zero-valued summaries and a recent-period chart area. The sandbox context is visible in the application header.
Zero can be a meaningful result in a scoped report, but it can also be confused with missing integration data or an unloaded response. State the relevant context and show an unavailable-data state separately.
In a test environment, users may need guidance to create representative activity. Do not describe test totals as live business performance or imply that an empty graph proves a processing failure.
Pair charts with readable summaries
Charts reveal shape and variation, while labeled values support precise reading. Use both when users need to understand a trend and report an exact number.
Match the chart to the relationship: time series for change over time, bars for categorical comparison, and tables for detailed lookup. A decorative visualization can make a simple question harder to answer.
Avoid using color as the only way to identify a series or state. Legends, labels, and accessible representations should preserve meaning for users who cannot distinguish the palette.
Keep metric definitions reachable
A short label rarely explains a metric's full calculation. Provide a nearby definition or help route for terms that can be misunderstood, especially rates and unique-user counts.
Explain included and excluded events when they materially change the result. A conversion count based on completed actions differs from one based on attempts.
Do not make the interface promise more precision than the data supports. Estimated values, delayed ingestion, and partial coverage should be identified through the actual reporting model.
Connect summary and detail coherently
When a summary leads to a detailed table, preserve its period and filters. A drilldown that silently changes scope can create apparent contradictions between the chart and its supporting rows.
Use detail to answer likely follow-up questions: which items contributed, where an exception occurred, or how a total was assembled. Avoid exposing every available field before the user needs it.
If a report supports saved configurations, make their relationship to current unsaved filters clear. A familiar report name should not conceal a changed population.
Make exports reproduce the visible scope
An export action needs an understandable dataset, period, and format. State whether it exports displayed rows, all matching rows, or a summary report.
Keep the data's context with the export where practical. A file without the active date range or metric definitions can become difficult to interpret away from the application.
Show preparation and completion separately for long-running exports. Accepting a request is not the same as producing a downloadable file.
Review reports with questions, not only sample data
Test whether users can explain a metric, identify the active scope, compare periods, and find supporting records. Include no activity, partial data, long labels, and delayed refresh in the review.
Verify that chart and table values agree under the same filters. Check timezone boundaries and formatting appropriate to the reported units.
Explore SaaSFrame's analytics references to compare how products connect filters, summaries, and detail. Choose a reporting structure around the decision your users need to make.
Analytics design questions
Does an analytics page need many charts?
No. Choose the smallest combination of values, tables, and charts that supports the relevant decision and follow-up questions.
Where should the date range appear?
Keep it visible near the report scope and preserve it through detail views and exports. The period is part of the meaning of every number.
How should zero results be presented?
Distinguish valid zero activity from unavailable or incomplete data. Identify the environment and filters that produced the result.