 SaaSFrame
🖍 Flowchart
Visualize logic and automation with SaaS Flowchart and Node-based UI examples. This collection features canvas designs for workflow builders, automation triggers, and decision trees that make complex backend processes easy to manage.



Index of all 33 Flowchart examples
- Customer.io Campaign Workflow
- Checkout.com Strategy Builder
- Latitude Flowchart
- Intercom Set AI Chatbot Live
- Intercom Automation Workflow
- FlowMapp Sitemap Flowchart
- FlowMapp Sitemap Flowchart
- FlowMapp User Flow Flowchart
- FlowMapp User Flow Flowchart
- Cal.com Create Workflow
- Audienceful Automation Flowchart
- Audienceful Add Automation Action
- Audienceful Automation Trigger Selected
- Audienceful Create New Automation
- Sellx Create A Sequence
- Loops Loop Metrics
- Loops Loop Flowchart
- Loops Loop Flowchart
- Loops Loop Flowchart
- Loops Loop Flowchart
- Loops Loop Flowchart
- Conduktor Flowchart
- Conduktor Flowchart
- Conduktor Flowchart
- Logbook Step Deleted
- Logbook Create Element
- Logbook Add A Step
- Logbook Empty Flow
- Crew Create automation
- Crew Create automation
🖍 Flowchart: design guide
Short answer
A SaaS flowchart shows a process as connected steps, conditions and outcomes, often one the product actually executes, such as an automation or campaign. Make start and end states clear, give connections meaning (conditions, delays), separate node settings from structure and show execution results on the flow.
In the libraryas of November 2026
- Screens
- 33
- SaaS products
- 15
- Last added
- Oct 2026
Common patternsWorkflow Builder 18Status Indicator 7Drag & Drop 6Filter 6Side Panel 6
Recently addedTinesEigenPalCloseCustomer.ioCheckout.com
A SaaS flowchart makes a process visible through connected steps, conditions, and outcomes. In a product, it often represents executable behavior rather than a decorative diagram. Users may be building a campaign, editing an automation, or reviewing a decision strategy. The interface must help them understand both the graph and what the system will do with it.
The SaaSFrame references include campaign canvases, strategy builders, workflow input-and-output structures, and linear automation lists. They show why a flowchart screen cannot be evaluated only by the appearance of its nodes. State, configuration, testing, and navigation matter just as much.
Is the user reading the flow or building it?
A read-only process overview needs clear relationships and a route to relevant detail. An editor also needs selection, configuration, connection controls, and reliable save behavior. These tasks can share a canvas but require different interaction priorities.
Identify the intended model: a linear sequence, a branching decision process, or a graph with reusable operations. Do not add a freeform canvas merely because workflows are complex. A structured list can make a strictly sequential process easier to inspect.
Use the vocabulary of the user's work. A campaign message, a risk decision, and an agent step may all be nodes internally, but their labels should explain what they do rather than expose the implementation model.
Make the starting point and end states clear
An executable process needs an understandable trigger or input and a recognizable outcome. Users should be able to identify how work enters the flow and where it can stop, succeed, or fail.
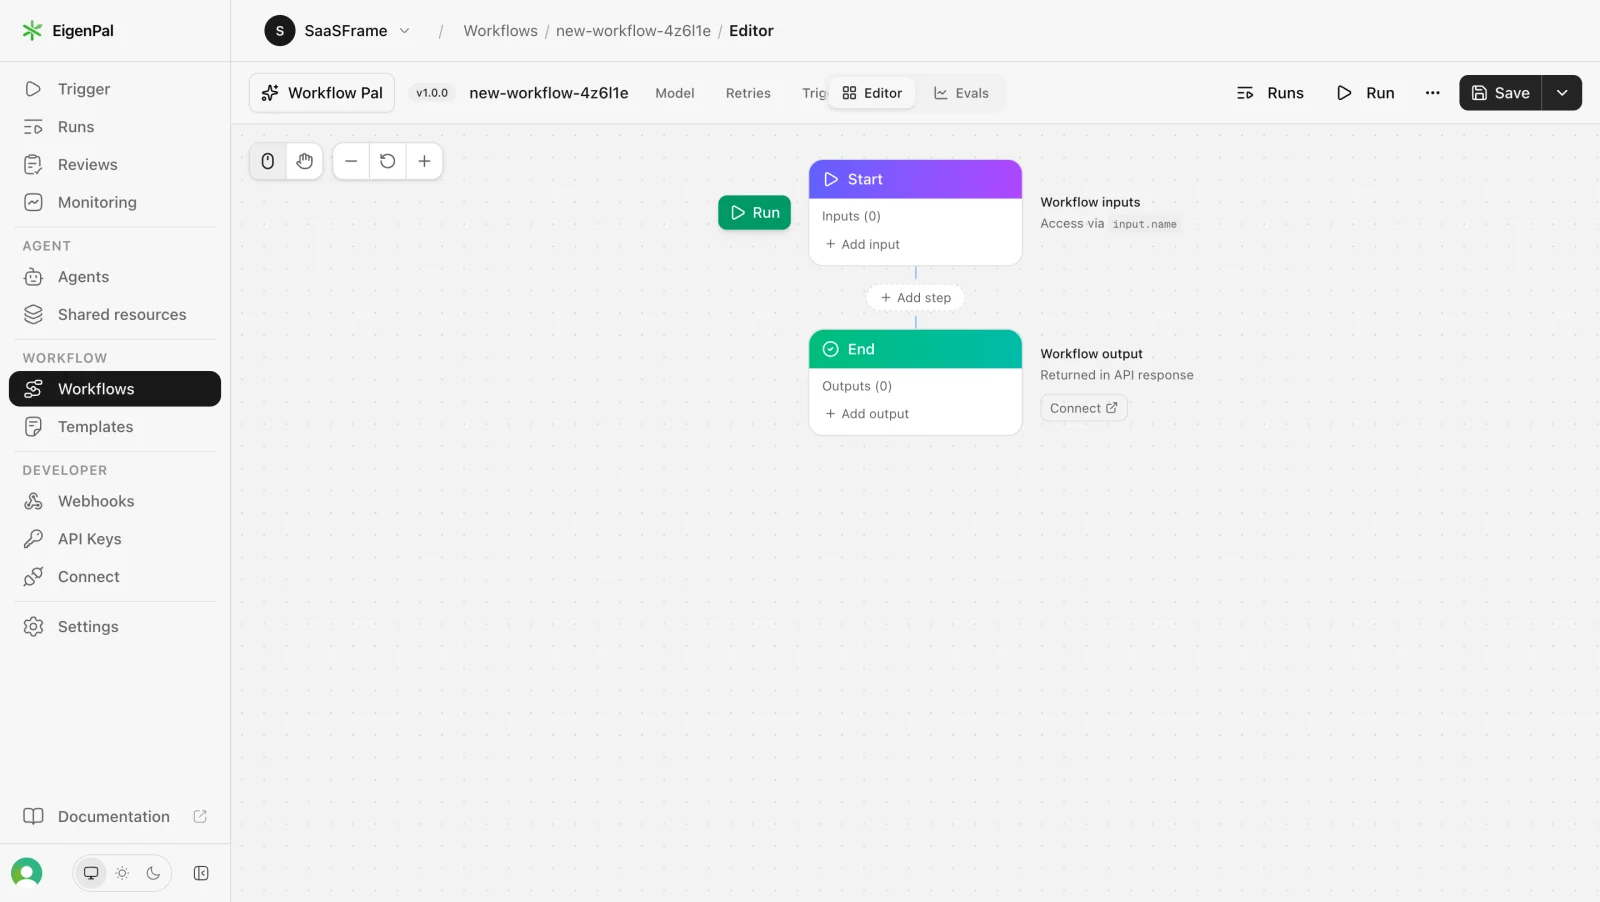
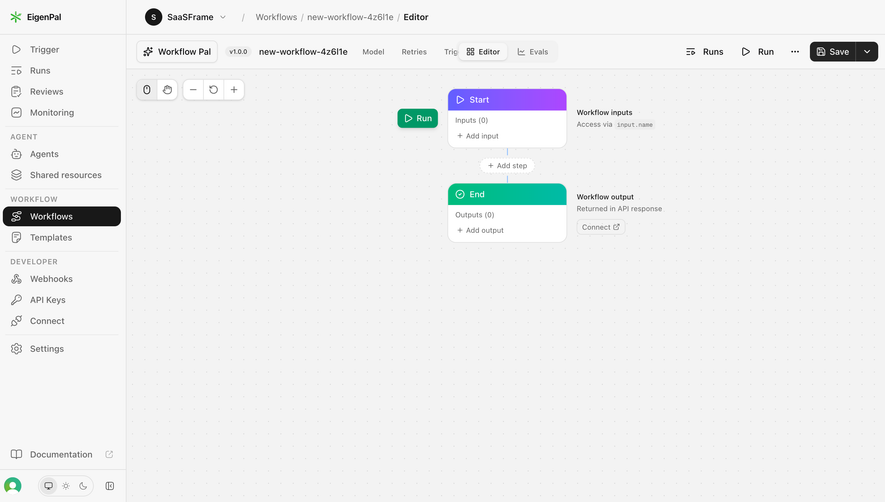
The EigenPal capture presents a start node with inputs and an end node with outputs. It also shows an add-step control, editor and run-related navigation, and save and run actions.
This structure makes the workflow boundary visible before the graph contains many steps. Inputs and outputs provide a concrete way to reason about what the process accepts and returns. The empty structure is a starting configuration, not proof that a usable workflow is already ready to run.
Give connections a meaning beyond direction
Lines should represent a defined relationship. They may indicate execution order, a conditional route, or a data dependency. If several meanings coexist, distinguish them clearly rather than drawing identical connectors for everything.
Label branches according to the condition users need to understand. True and false may suit a clearly described predicate; named outcomes can be more informative when the decision has domain-specific meaning.
Avoid relying only on connector color. A person needs to follow the process at increased zoom, on different displays, and through an accessible alternative where necessary. The diagram should also have a useful textual explanation or structured view when the task warrants it.
Study a campaign with explicit timing and branching
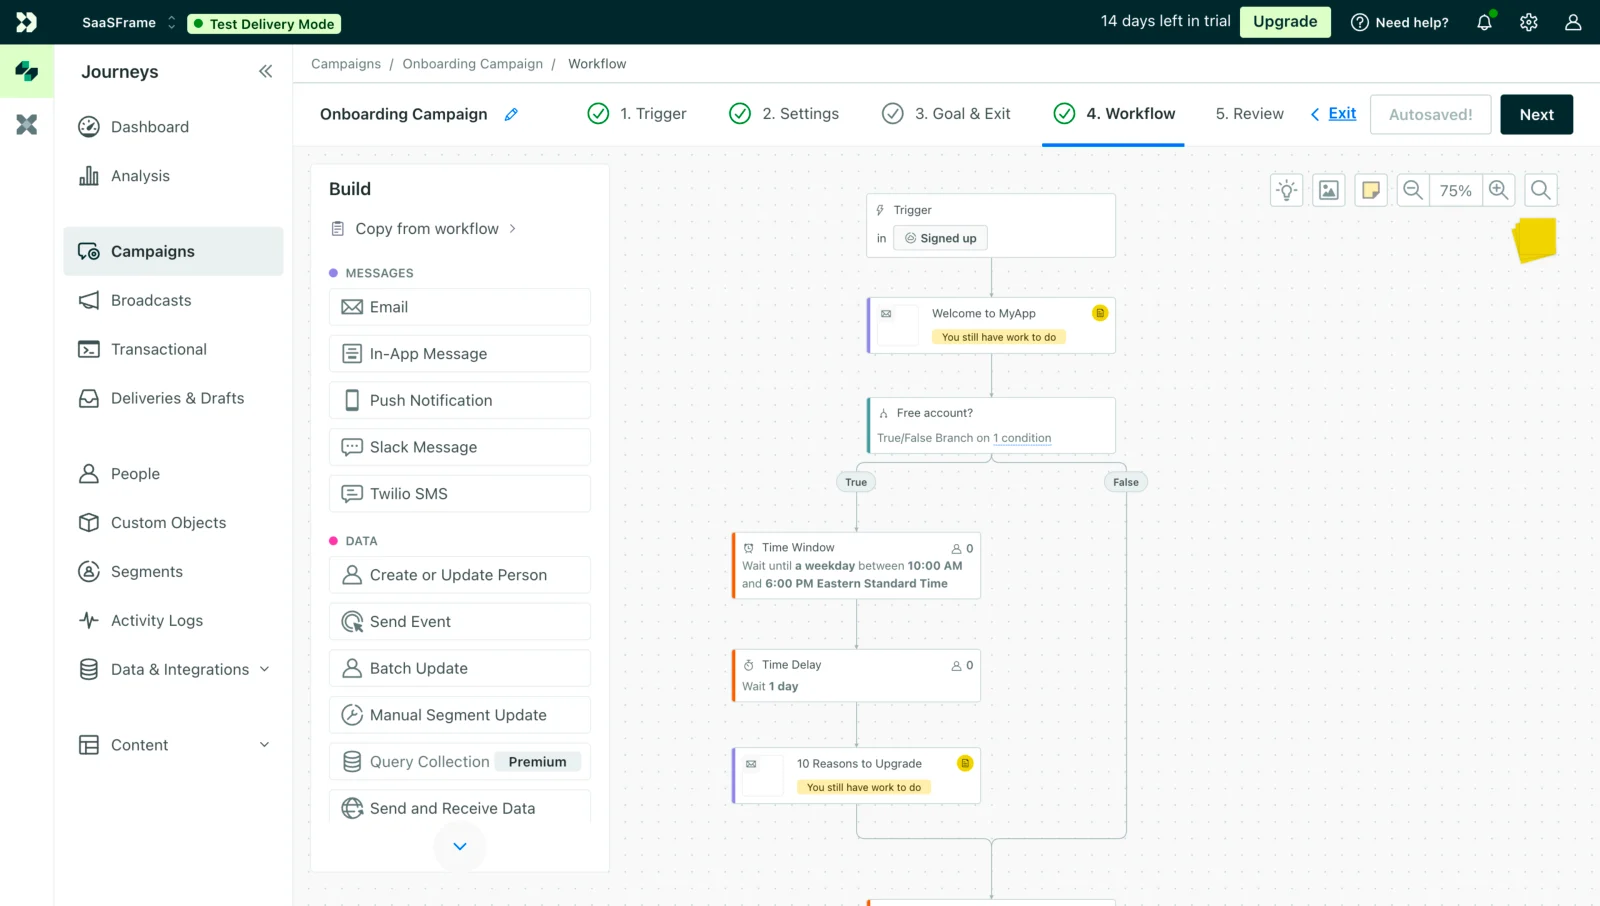
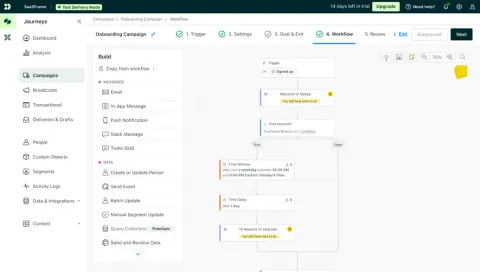
The Customer.io campaign-workflow capture shows a trigger, a message step, a true-or-false branch, and timing steps within a canvas. A build palette sits beside it, while campaign stages and a Test Delivery Mode banner remain visible above.
The relationships matter because a message sequence is not simply a set of cards. A time window and a delay describe different timing behavior. A branch changes which users reach a later message. The interface needs to keep those distinctions inspectable.
The visible warning labels on message nodes also illustrate a separation between a placed step and a configured step. A node can exist on the canvas while still requiring work. Do not let a visually connected diagram imply that the entire process is valid.
Separate node configuration from graph structure
Adding an operation and configuring it are different tasks. Users need to understand which fields are required, what data the operation receives, and what result later steps can use.
A side panel can preserve the graph context while editing a node. A dedicated screen may fit a complex operation, provided the return path preserves selection and position. Avoid moving users between views without a recognizable active step.
Show a concise summary on the node after configuration. The summary should communicate the meaningful decision without repeating the entire form. If it becomes stale after an upstream change, indicate the dependency rather than leaving the old summary looking valid.
Keep live and test behavior distinct
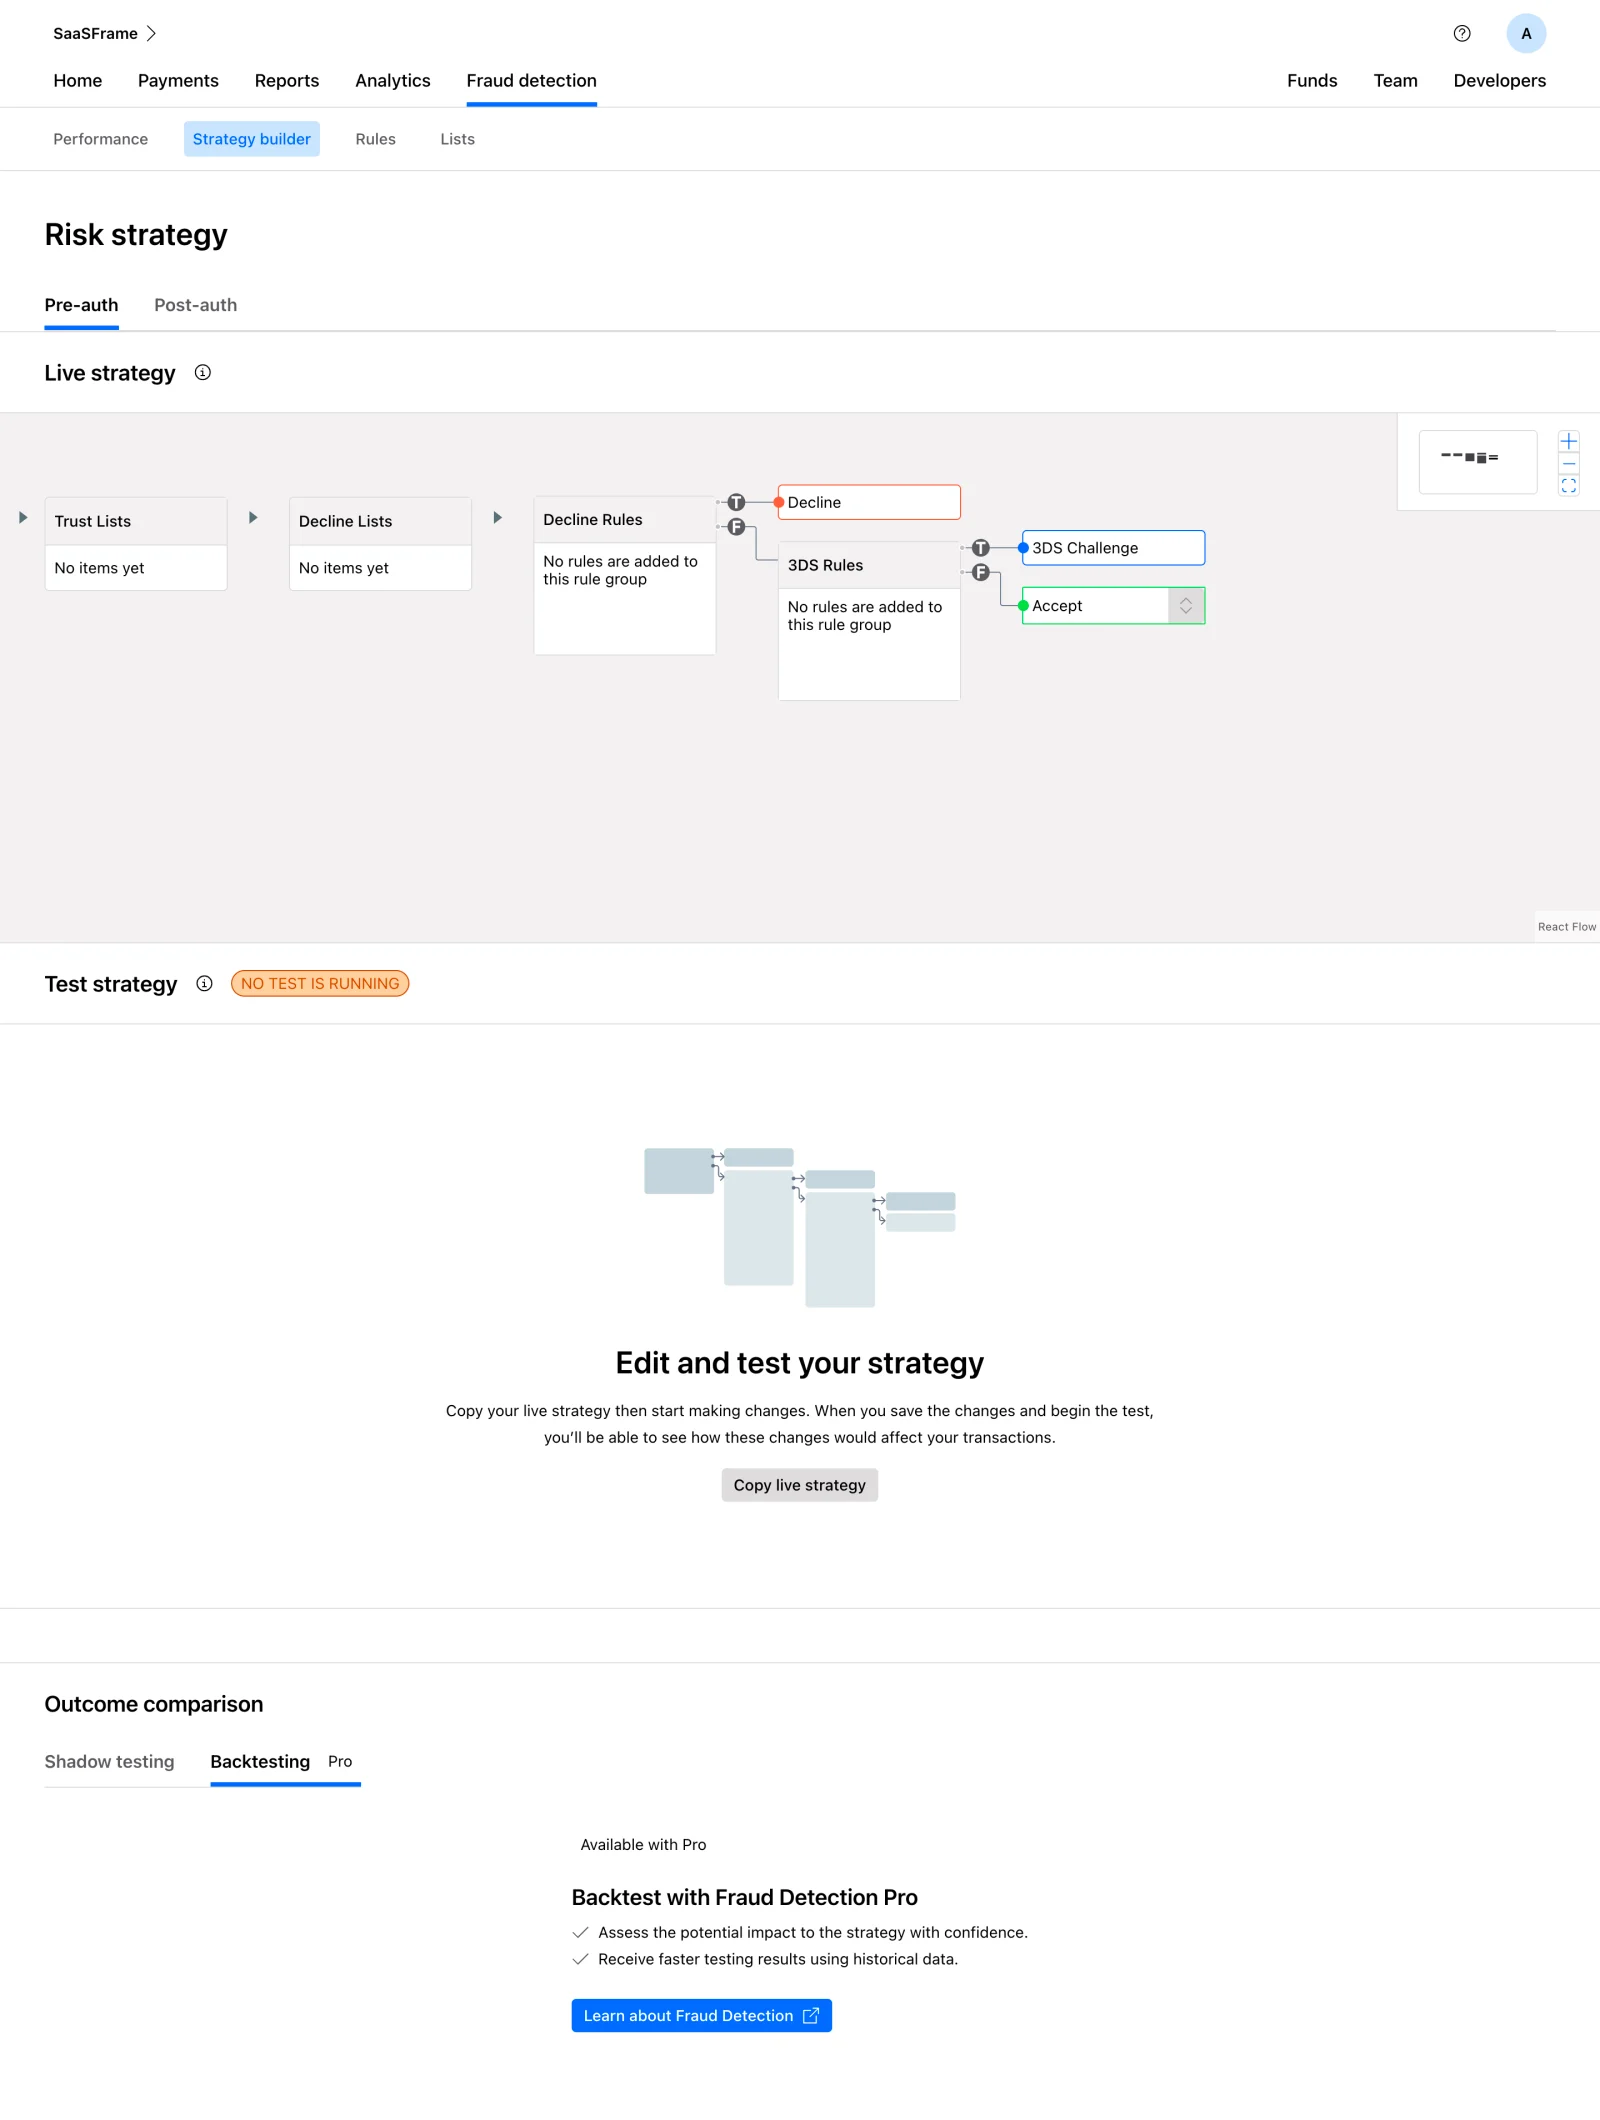
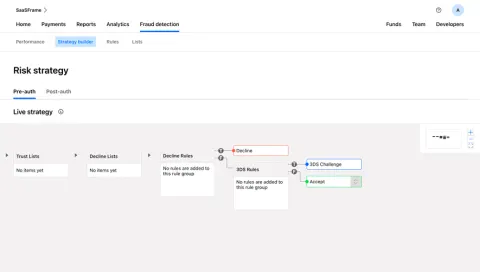
The Checkout.com strategy-builder capture separates a live strategy from a test strategy and includes routes related to outcome comparison and testing. The initial test area invites users to copy the live strategy before making changes.
This distinction is valuable when editing a process can affect active operations. Users need to know whether they are inspecting, drafting, testing, or changing live behavior. A save button and a publish or activate button may have different consequences.
Use state labels that reflect the actual system. A successful test is not necessarily a live deployment, and a saved draft is not necessarily valid. Keep the commitment stages visible so users can predict what the next action changes.
Use a linear view when it fits the process
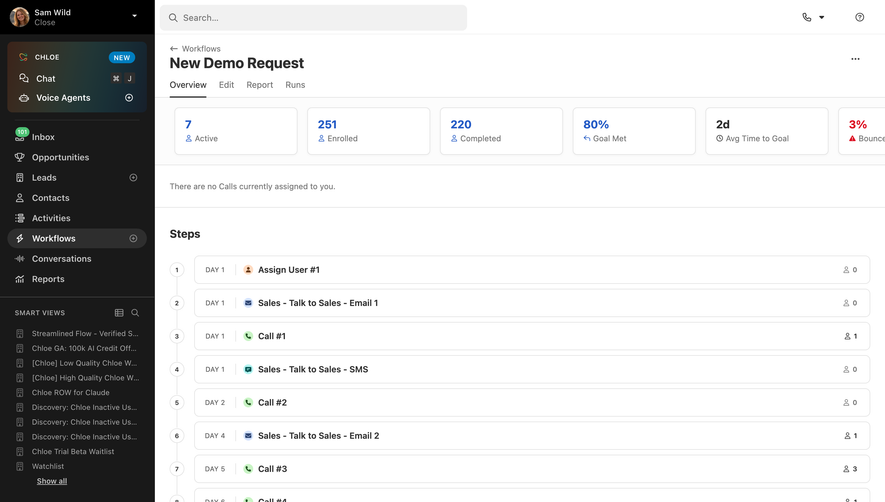
The Close sales-automation capture presents ordered steps with day labels and actions such as assignment, email, calls, and tasks. Performance measures appear above the sequence. The screen is part of the flowchart category, but its main process presentation is a list.
A linear structure can make timing and step order easier to scan than a large canvas. It also provides a compact route to editing or reviewing individual actions. The right choice depends on whether branching or spatial relationships are essential.
Consider offering complementary views when users have different needs. A canvas can show structure, while a list or run history can support detailed inspection. Keep their terminology and state consistent so they describe the same workflow.
Design insertion and deletion around consequences
When users add a step, show where it will enter the process. An insertion between connected nodes should not leave ambiguous connections. If the product automatically reconnects the graph, make the resulting structure inspectable.
Deleting a node may affect downstream inputs or branch destinations. Explain meaningful consequences rather than only asking whether the person is sure. Where possible, provide undo or preserve a recoverable draft.
Handle invalid connections explicitly. A loop, missing branch destination, or incompatible input should produce a useful explanation at the relevant point. Do not wait until an opaque run error to reveal a problem the editor can detect.
Make navigation work beyond the ideal diagram
Large flows need zoom, pan, fit-to-view, and a route to the selected node. Search or an outline can help when the graph has many steps. Users should not spend most of their time finding the part they want to edit.
Preserve the viewport when returning from detail or reviewing a result. A forced reset to the canvas origin can be costly in a large process. Use selection and breadcrumbs to maintain orientation.
For keyboard and touch users, provide usable alternatives to precise dragging. Connection and ordering operations need understandable controls. A visual editor should not make its essential actions depend on a mouse-only gesture.
Connect execution results to the configured flow
A run view can show which path was taken, what each step received, and where work failed. Make clear that this is one execution of the configured process, not a permanent change to its structure.
Keep error context close to the relevant step and provide a route back to configuration. Distinguish failures caused by input, unavailable services, and invalid setup where the product can establish the difference.
Do not imply that a successful individual run validates every branch. Testing needs representative inputs and paths. The interface can help users identify which parts were exercised and which remain untested.
Validate comprehension and recovery
Ask users to explain the trigger, a branch condition, a timing rule, and an end state. Then ask them to edit a step and predict whether the change affects live behavior. These tasks reveal ambiguities hidden by an attractive diagram.
Test large graphs, incomplete nodes, missing credentials, interrupted saves, upstream changes, failed runs, and restricted permissions. Include narrow screens and increased zoom.
Measure whether people can create a valid process and investigate a failure without guessing. Canvas engagement alone is not evidence that the editor supports reliable work.
Frequently asked questions about SaaS flowcharts
Does every workflow need a canvas?
No. A linear sequence may be easier to manage as a list. Use a canvas when branching, dependencies, or spatial structure materially help the task.
Should saving activate the workflow?
Only if that consequence is explicit and appropriate to the product. Many workflows benefit from separate draft, test, and activation stages.
How should incomplete nodes appear?
Identify the missing configuration or validation problem at the relevant step. A placed and connected node should not automatically appear ready to execute.