 SaaSFrame
Pricing Plan Comparison
Help users choose the right tier with SaaS Plan Comparison tables. These designs focus on feature-by-feature breakdowns and 'Best Value' highlights to drive expansion and conversion.
Website sections 28
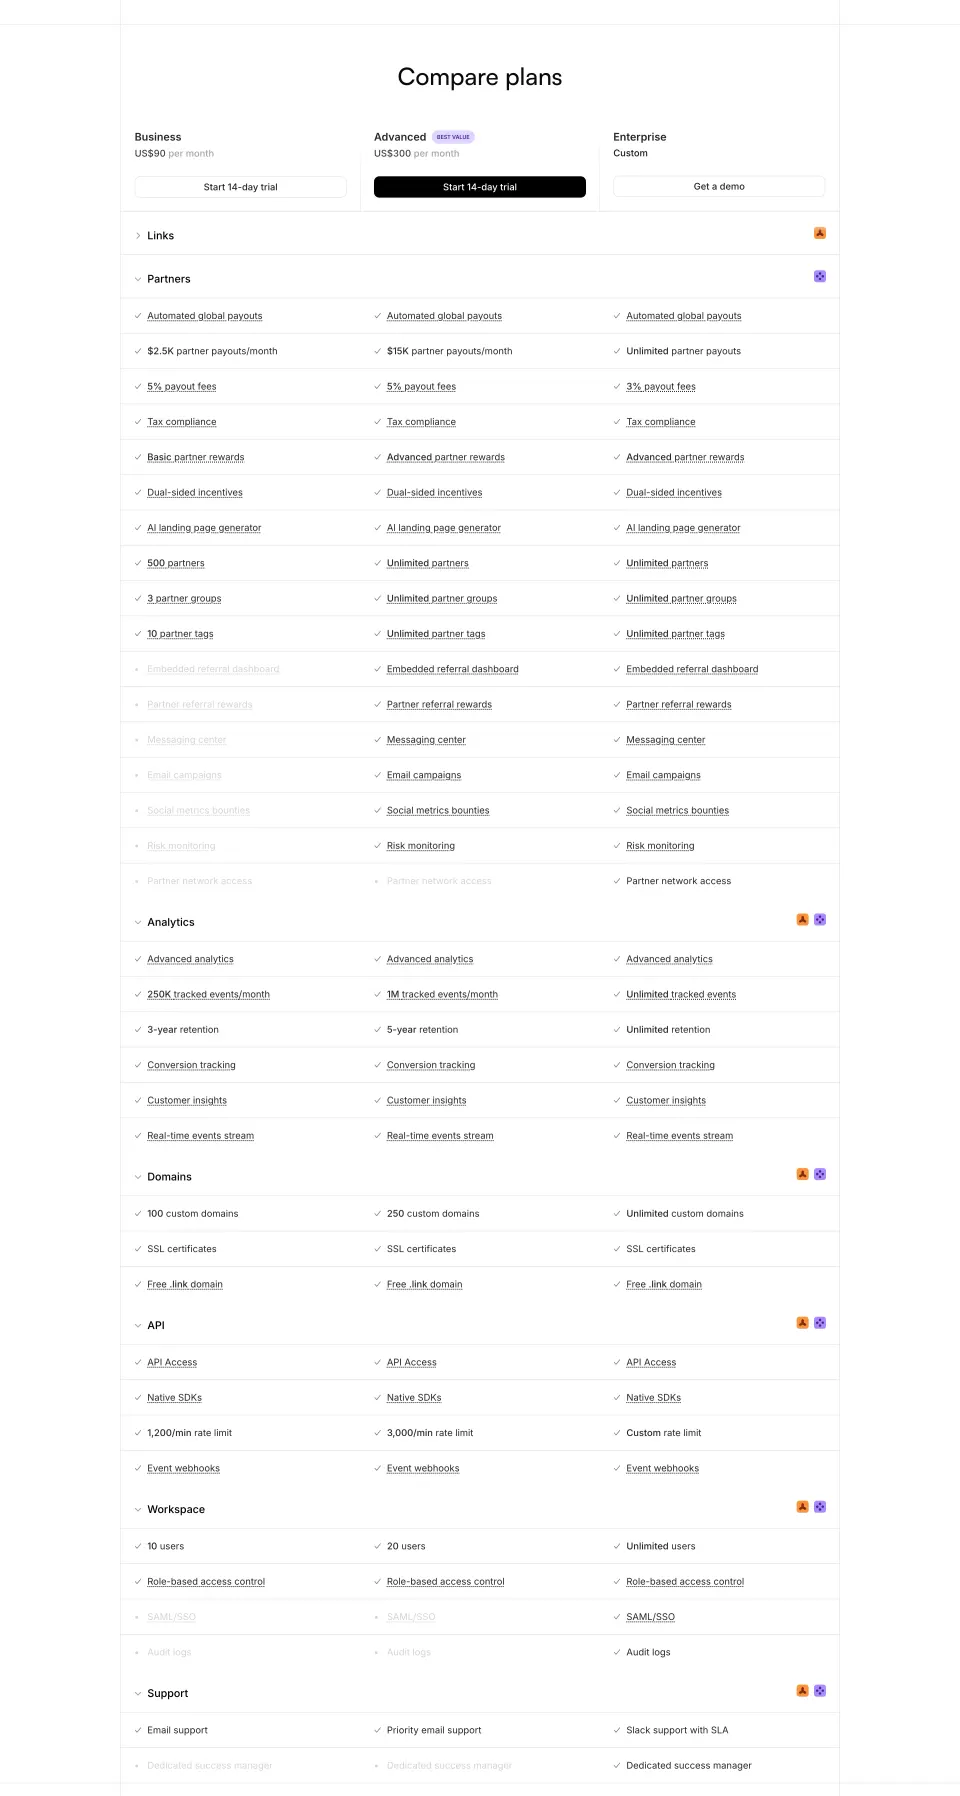

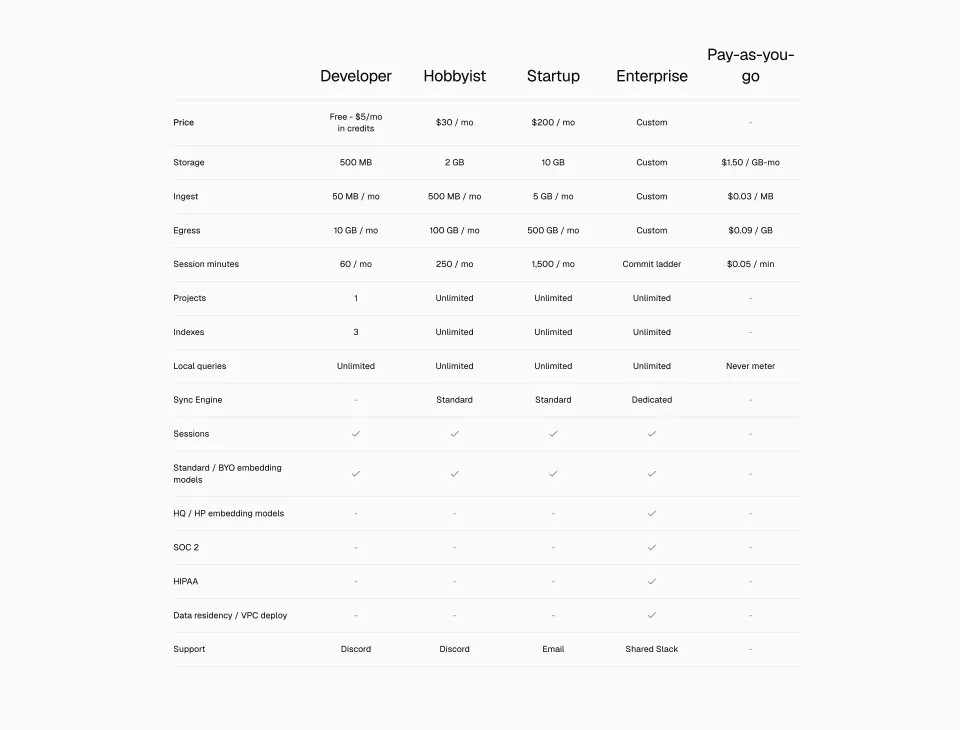


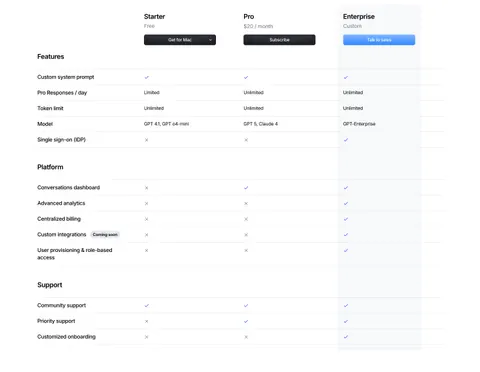
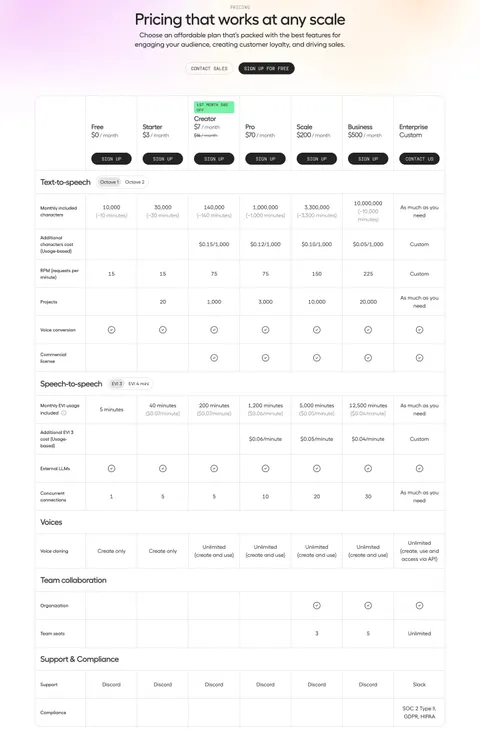
Product screens 6
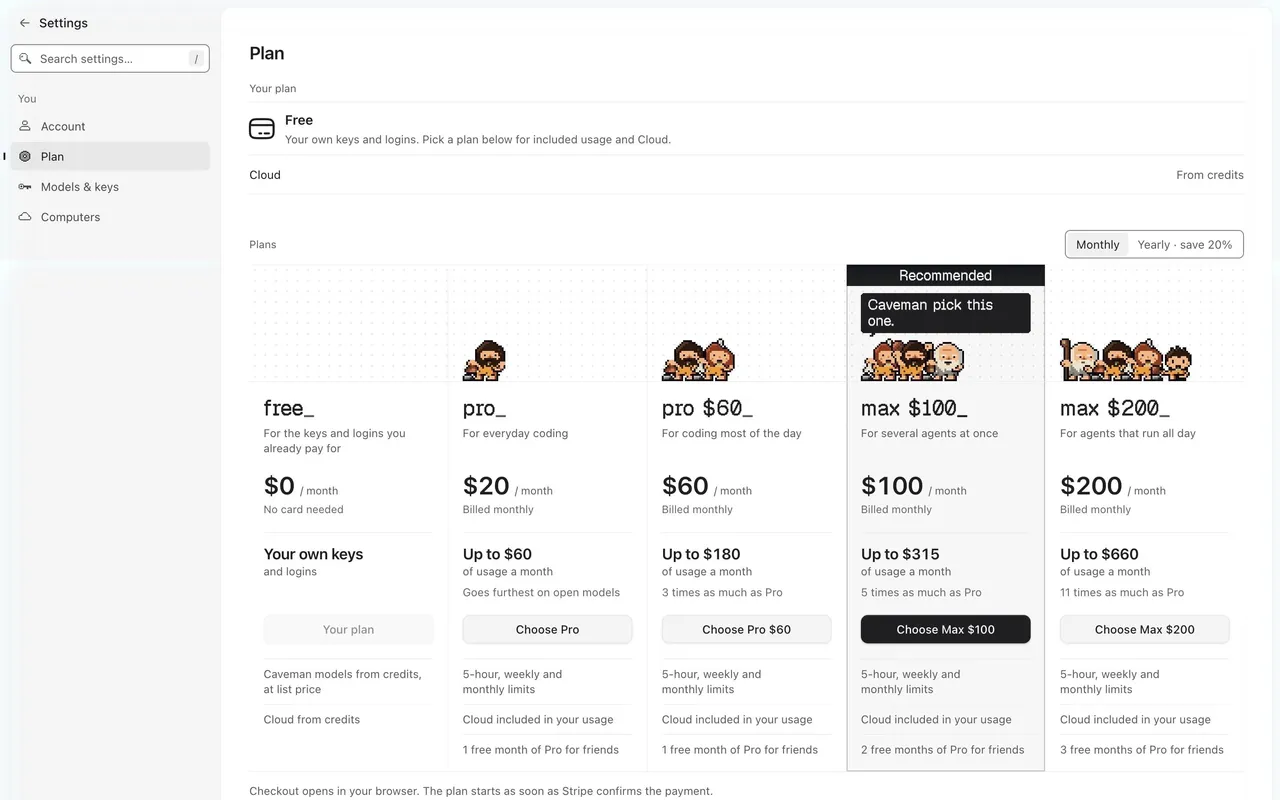

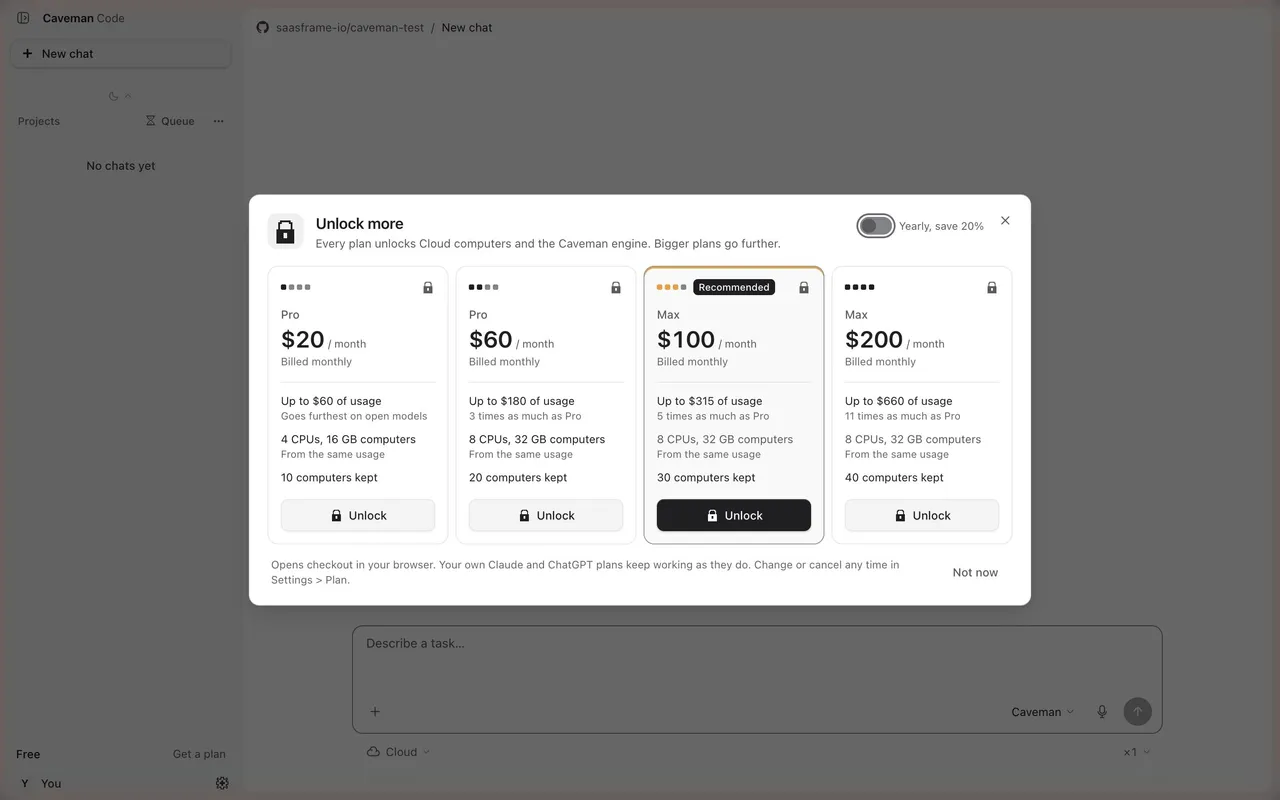
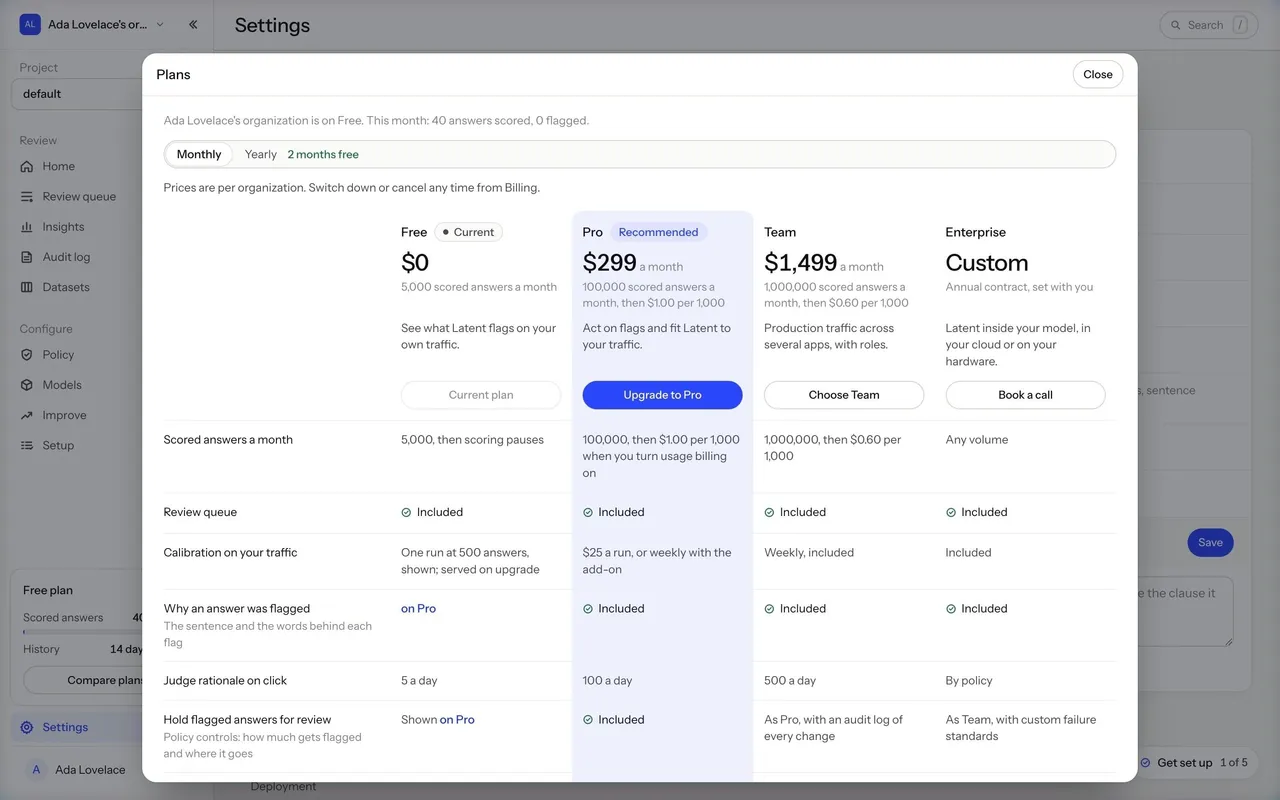

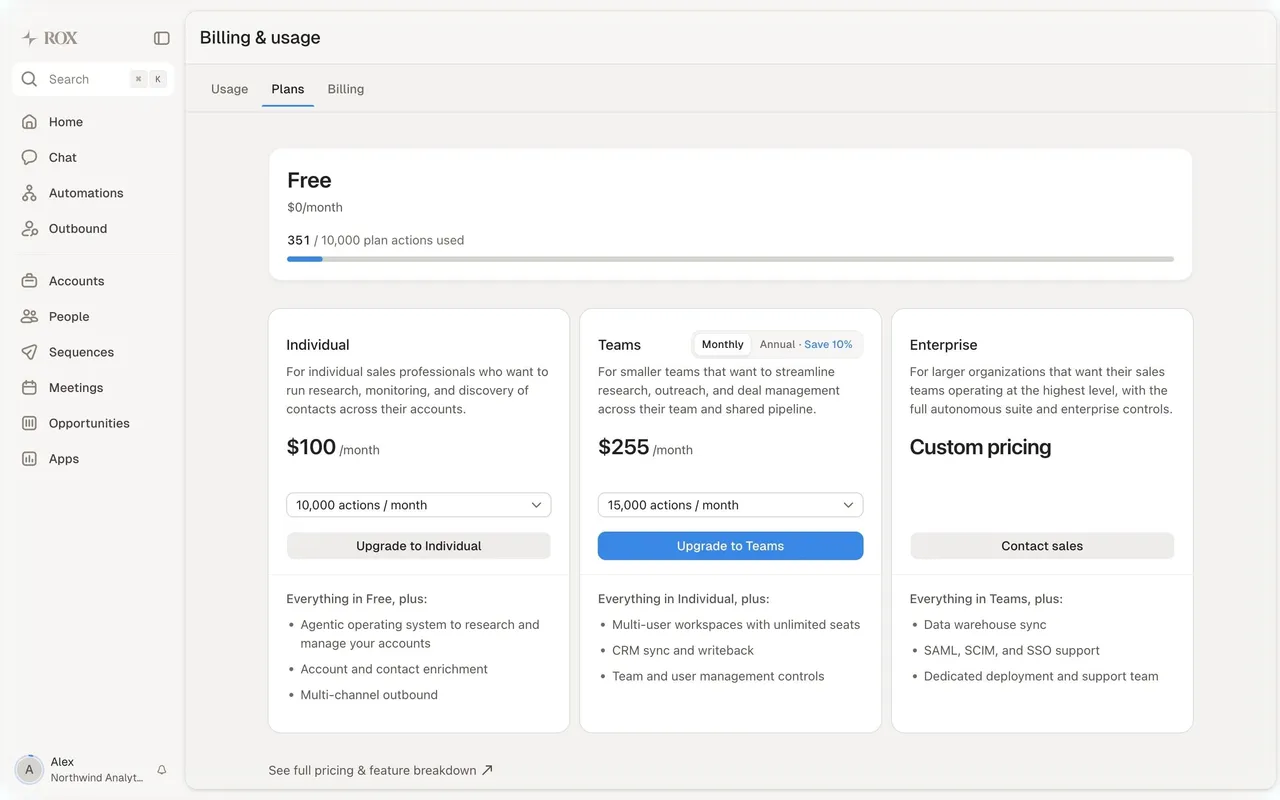
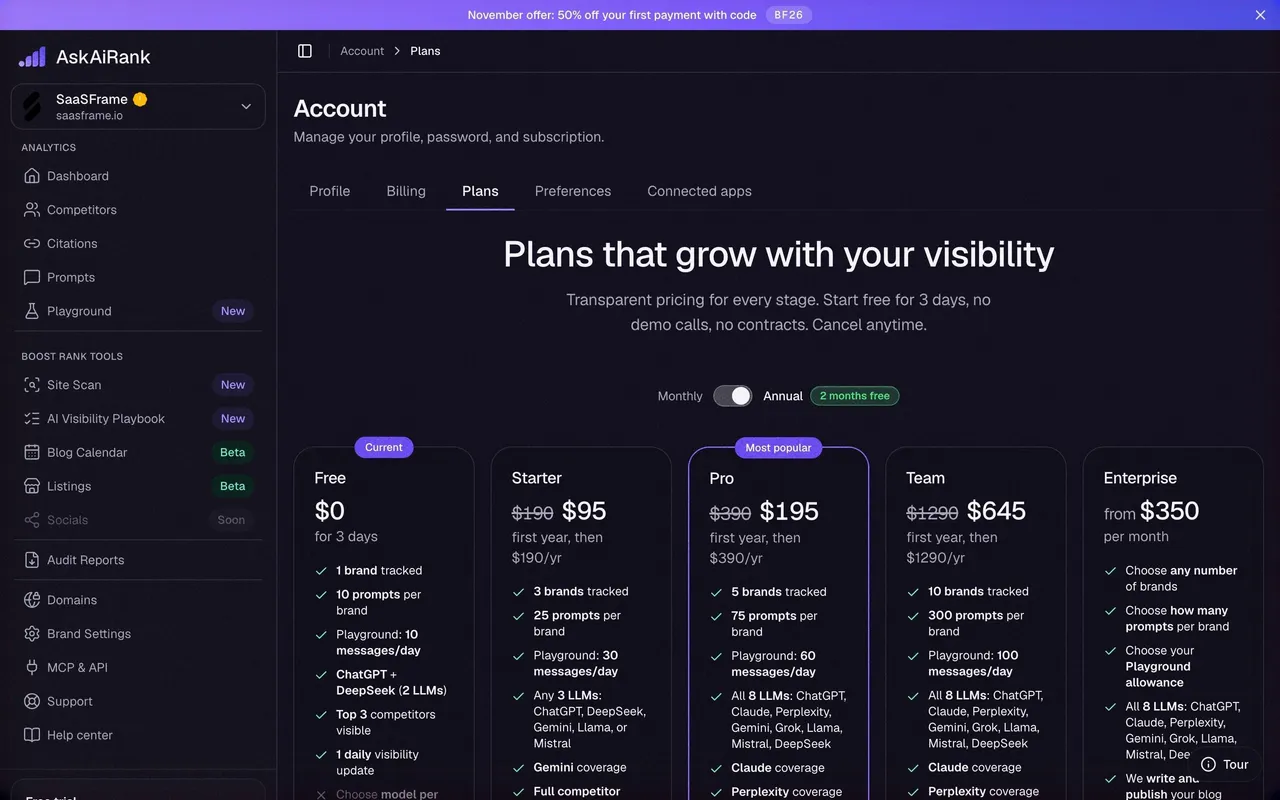
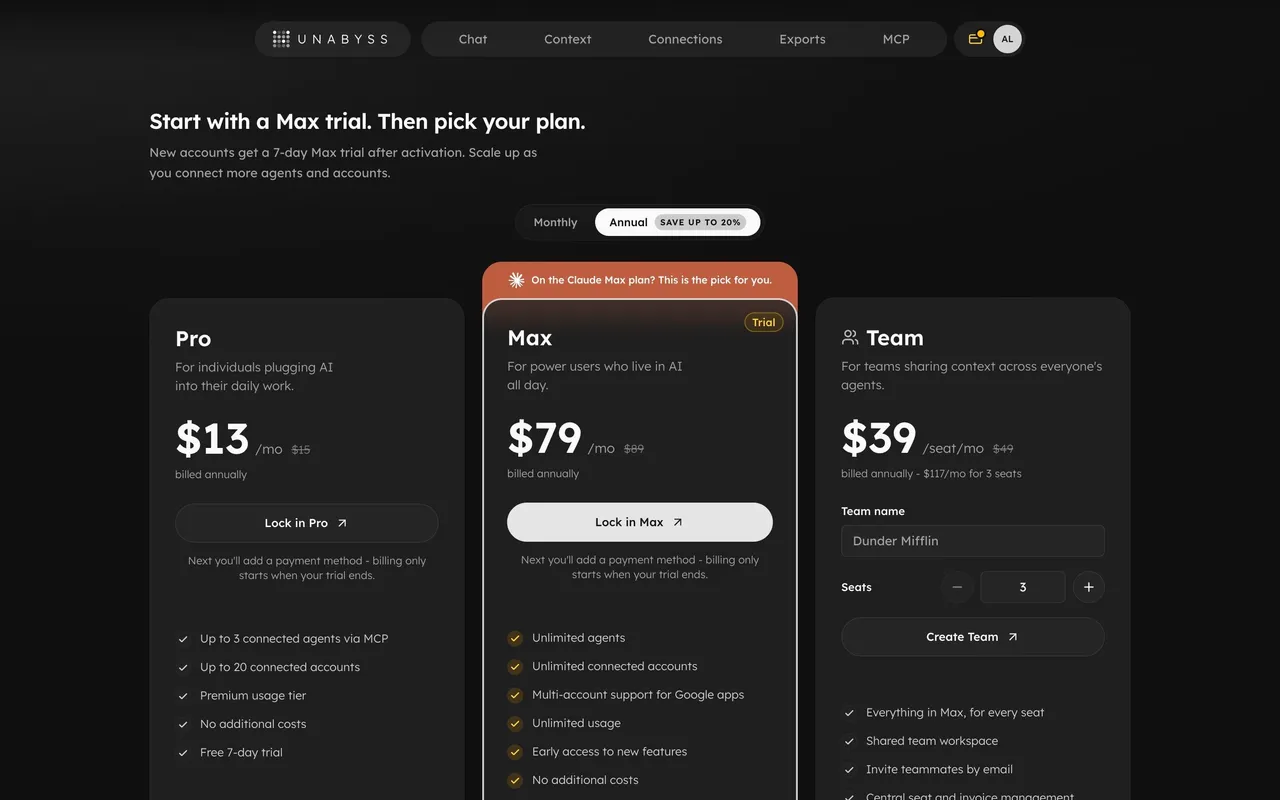
Index of all 6 Pricing Plan Comparison examples
Pricing Plan Comparison: design guide
A pricing comparison table lets visitors check which plan includes the features and limits they need. Define the decision it supports, group rows by topic, use values rather than ticks when amounts differ, explain unfamiliar feature names and keep the recommended plan visible without distorting the comparison.
In the libraryas of November 2026
- Examples
- 34
- SaaS products
- 32
- Last added
- Nov 2026
Most common inPricing Page 27Plans 6Upgrading 4Billing 1Comparison Page 1
A pricing plan comparison helps visitors verify which tier includes the capabilities and limits they need. Unlike a compact pricing card, it supports detailed evaluation across a consistent set of rows. Its usefulness depends on accurate values, understandable feature names, and a layout that preserves the relationship between each row and its plan.
Steep and Linear show two different comparison scales: a two-plan matrix with many shared capabilities, and a four-plan table with progressively differentiated features. Their historical captures provide design evidence about grouping and hierarchy. They should not be treated as current entitlement or pricing information.
What decision does the comparison table support?
Begin with what the visitor must verify. They may need a capacity limit, a collaboration feature, an administrative control, or a support level. The comparison should make those distinctions easier to find than they would be in separate plan cards.
Use the matrix as a detailed layer, not as a replacement for explaining the pricing model. A visitor still needs the amount, billing unit, period, and action associated with each plan. The comparison can focus on capabilities and limits while staying connected to those offer details.
Choose rows that support evaluation. Including every minor product function can make a table long without making the choice clearer. Keep important differentiators visible, then decide whether shared capabilities need full rows, grouped summaries, or a separate explanation. Preserve a complete and accurate source even when the displayed table is concise.
Make shared capabilities and upgrade differences distinguishable
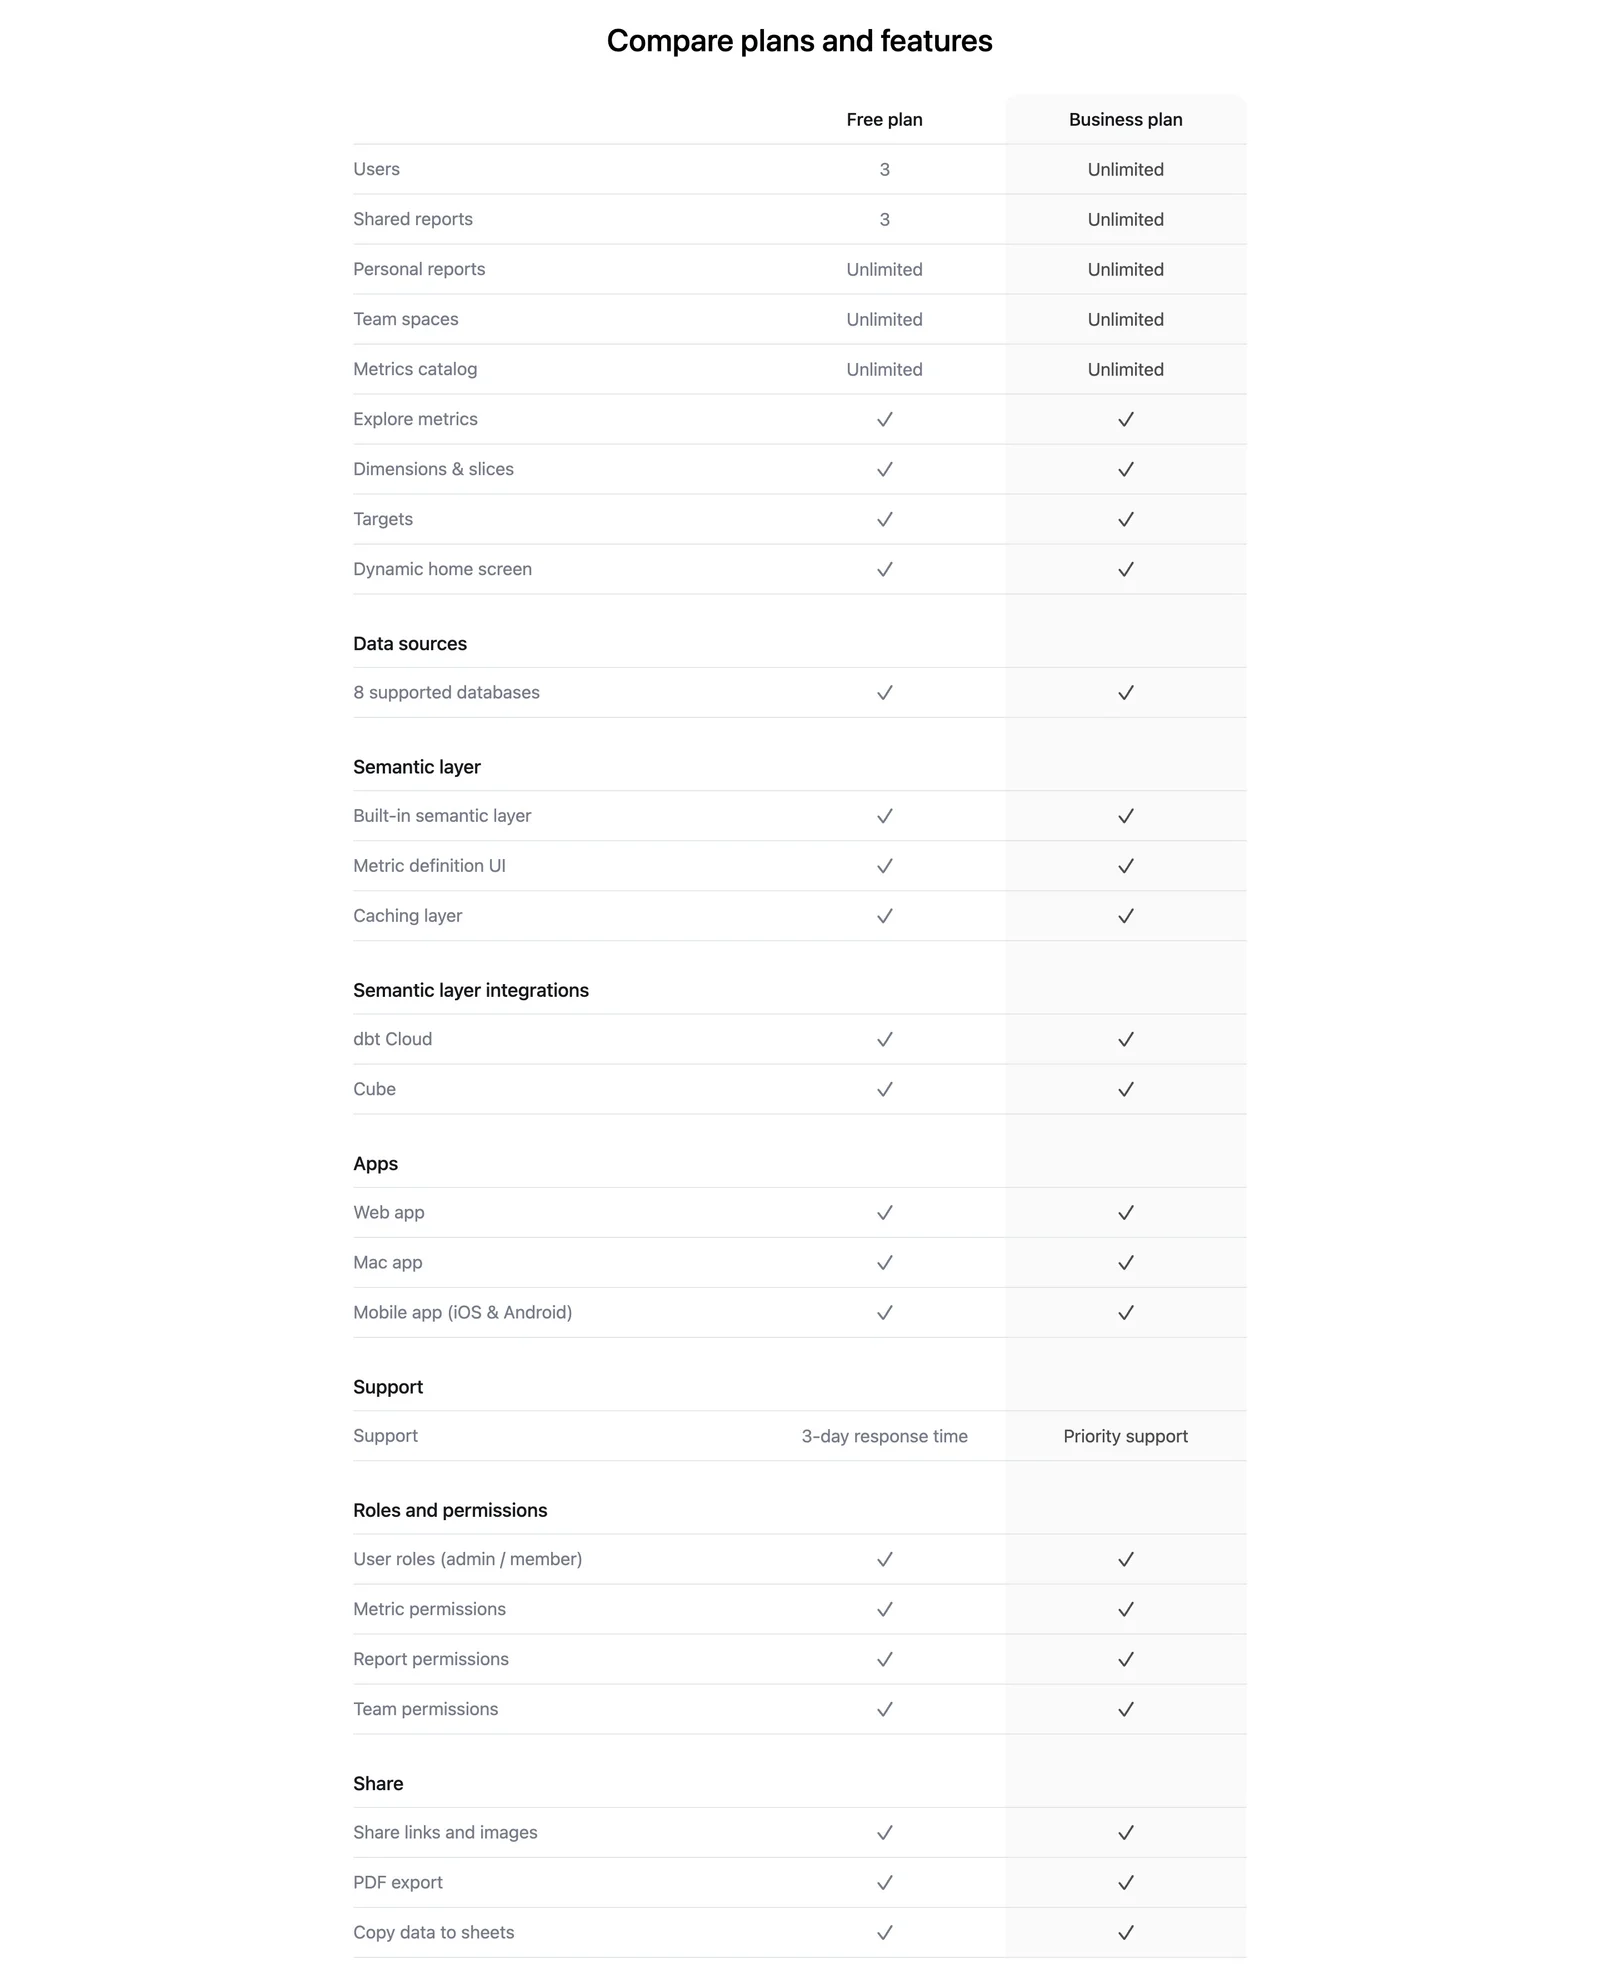
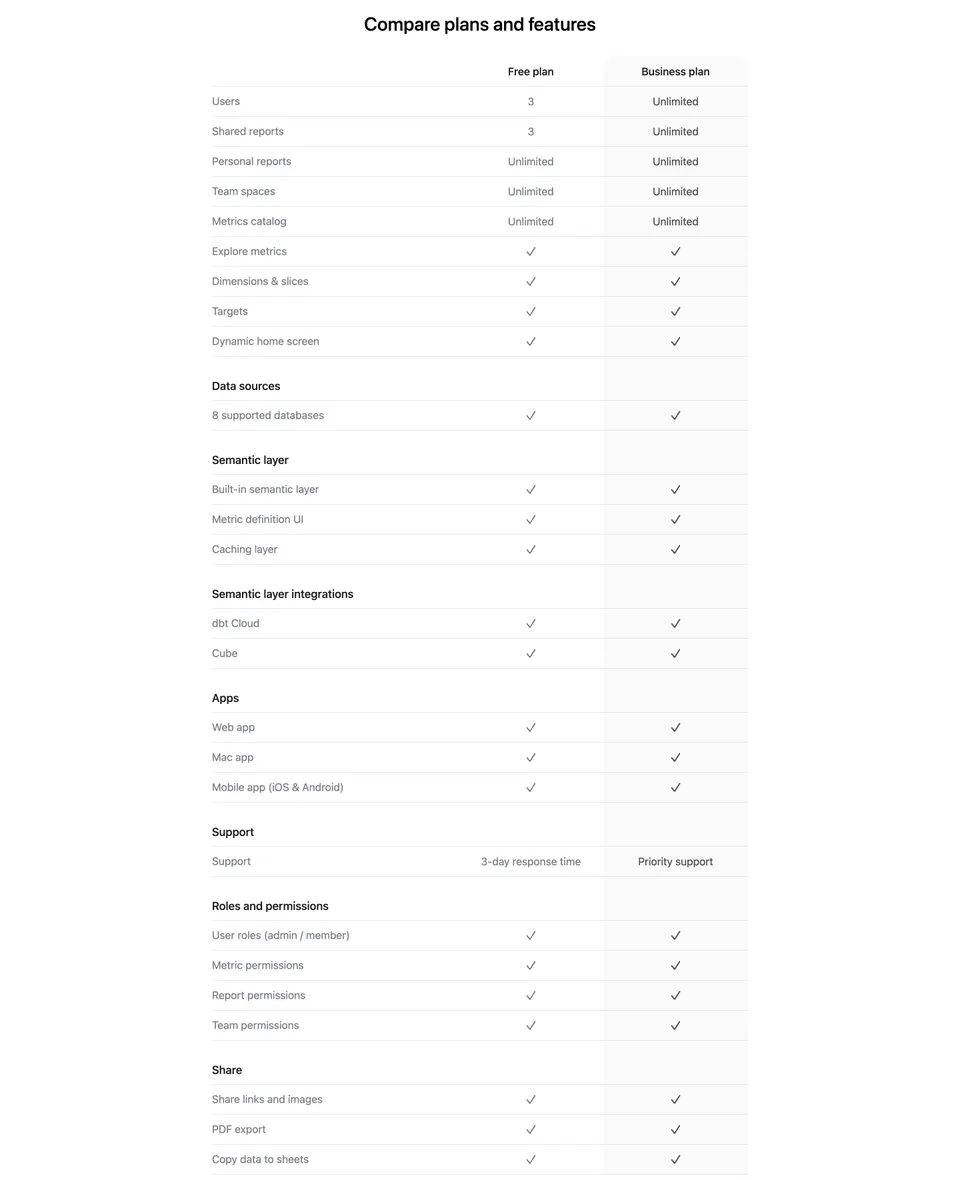
Steep compares a free and a business plan. The first rows show numerical or unlimited allowances, followed by many capabilities checked in both columns. Later groups separate data sources, a semantic layer, apps, support, permissions, and sharing.
This structure reveals that the plan distinction is not simply the presence of every core feature. Capacity and support can be meaningful differences even when many functions are shared. A two-column table helps visitors verify that relationship without scanning several unrelated feature lists.
The tradeoff is length: rows with identical values provide reassurance but can obscure the differences a buyer is looking for. Consider a visible differences summary near the top or a carefully labeled comparison mode. If shared rows are collapsed, make it clear that the table is showing differences rather than silently omitting available capabilities.
Group a large matrix by evaluation topic
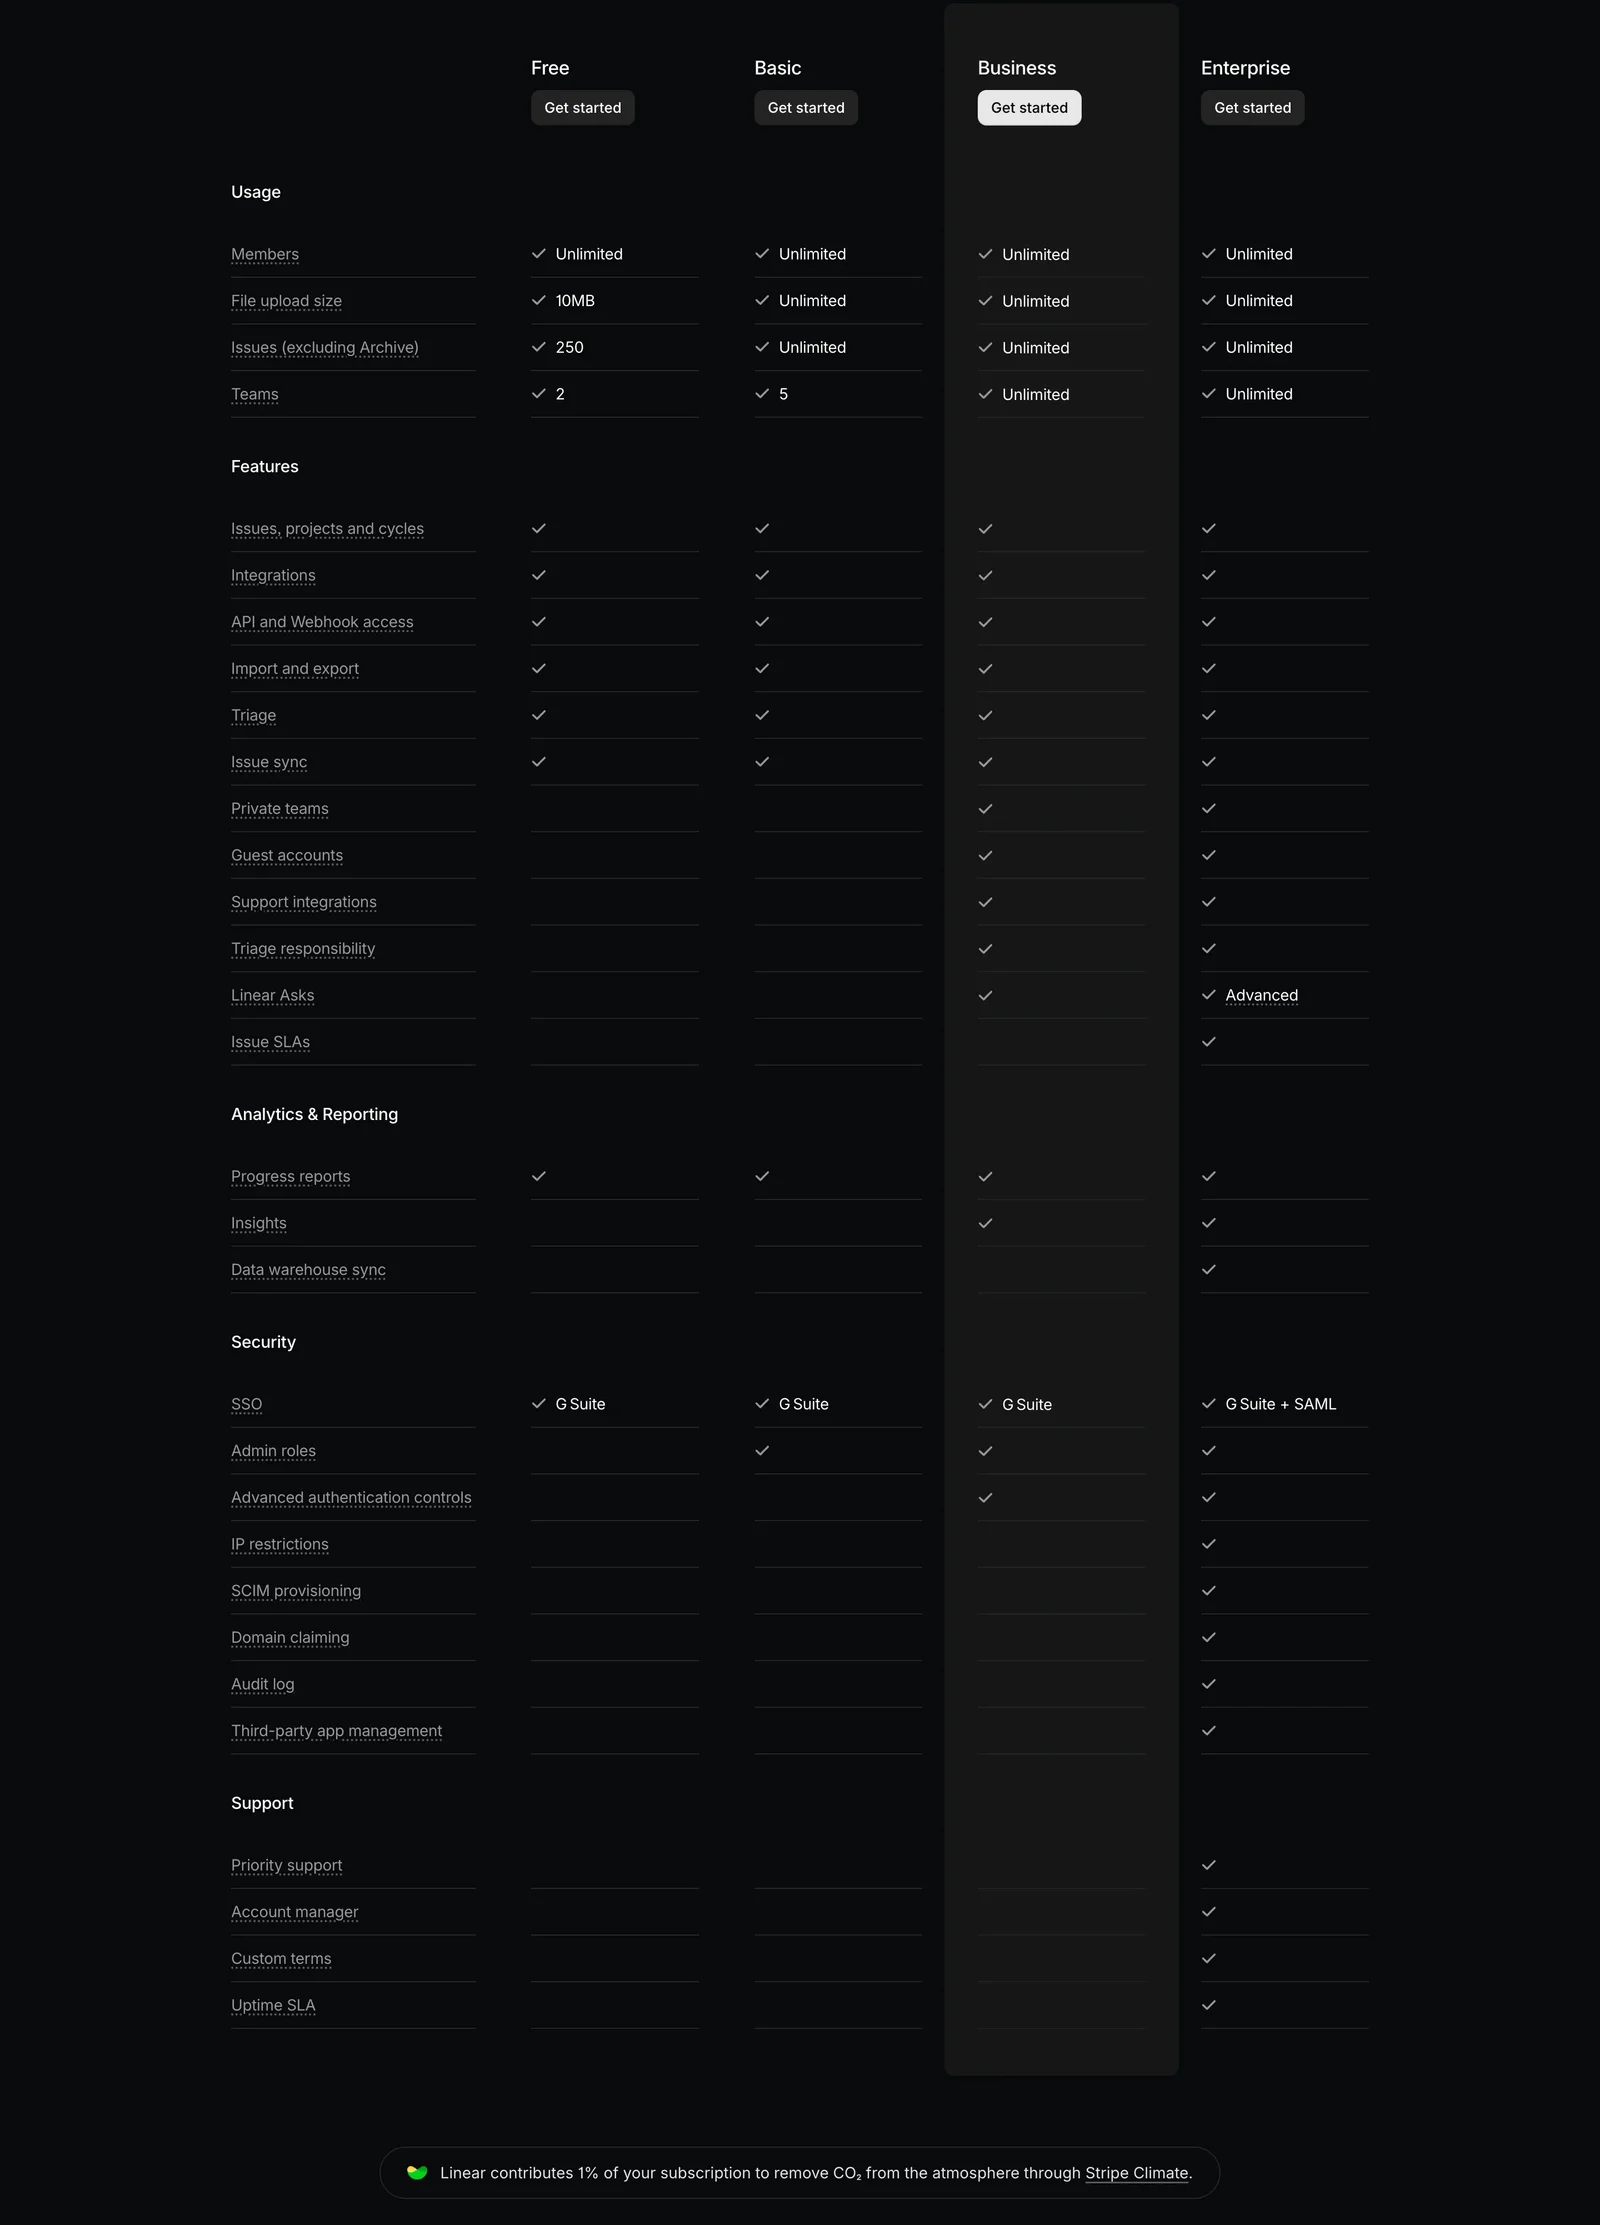
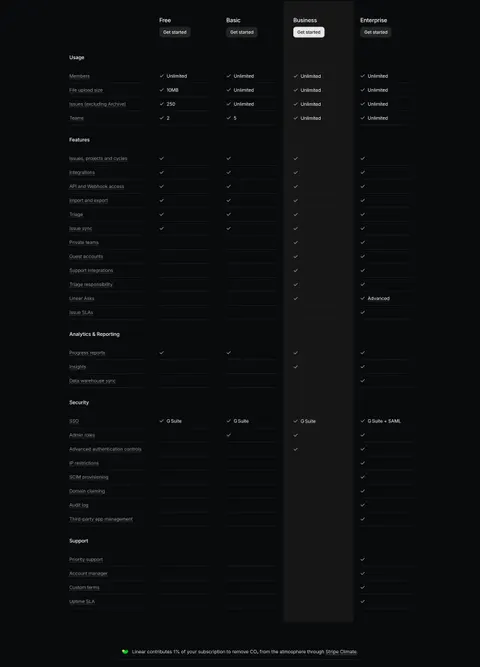
Linear organizes its table into Usage, Features, Analytics and Reporting, Security, and Support. Four plan columns sit alongside the row labels, and the Business column has a distinct background and action treatment. The grouping helps readers enter the matrix at the topic relevant to their decision.
This is useful when a product has several tiers and different kinds of entitlement. A buyer checking team capacity can start with usage, while an administrator evaluating controls can move to another group. Clear section headings reduce the effort of scanning a long undifferentiated list.
Use category names familiar to the audience. Avoid internal component names or overly broad headings that mix unrelated questions. Keep category styling distinct from feature-row styling so the visitor can understand the structure at a glance. The hierarchy should remain apparent when the table is read as text.
Use values when checkmarks are not enough
A checkmark can communicate inclusion, but it cannot explain every difference. Both captures use text or quantities where the allowance changes. Linear's usage rows show limits, and some capability rows include qualified text rather than a bare mark.
Use a number, scope, or level when that is the meaningful entitlement. A feature available in a limited form should not look identical to an unrestricted version unless supporting detail makes the distinction clear. Likewise, Unlimited needs an accurate definition and should not conceal a relevant policy limitation.
Choose a consistent convention for unavailable values. A blank cell can mean not included, unknown, not applicable, or missing data. A dash or explicit label may be clearer. Explain symbols when interpretation is not obvious, and ensure assistive technology can convey the inclusion state rather than reading an unlabeled icon.
Explain unfamiliar feature names without hiding essentials
Comparison tables often expose product vocabulary that a visitor has not learned yet. A short description, help link, or accessible disclosure can explain a feature without expanding every row into a paragraph. Use the explanation to clarify the practical task, not repeat the feature name.
Linear's capture uses underlined row labels that visually suggest additional detail, but the static image does not establish their interaction. If your implementation uses tooltips or disclosures, make them available to keyboard and touch users and keep the trigger's behavior understandable.
Do not hide the main limitation inside a hover-only explanation. The cell should state the essential allowance or availability, while the supporting content explains scope and examples. If an entitlement is consequential, link to maintained documentation or offer information that a visitor can read without holding a pointer in one place.
Keep the recommended plan legible without distorting choice
Linear gives one column a highlighted background and more prominent action. This helps visitors track that plan down a long matrix, but every other column still needs readable values. The emphasis should guide attention while leaving the comparison usable.
Align plan names and actions consistently. A visitor should not lose track of the selected or recommended column after moving into lower categories. Sticky headers can help in a long table, but their behavior needs to be checked for overlap, keyboard visibility, and mobile space.
If a plan is recommended, explain the basis in the broader pricing content. A highlighted column alone does not tell the reader whether the recommendation reflects popularity, suitability, or commercial preference. Let actual requirements drive selection, and keep alternative plans easy to understand and choose.
Preserve row and column relationships on small screens
A four-plan matrix can be too wide for a narrow viewport. Choose a responsive model intentionally. Horizontal scrolling preserves direct comparison but needs readable headers and a clear indication that more columns exist. A plan selector can reduce width but makes side-by-side evaluation harder.
Stacked plan details can work when each value repeats its feature label and category. Do not remove the labels and leave a sequence of checks or numbers that relies on remembering a different screen. Keep the plan identity visible as the visitor moves through the list.
Use semantic table structure when presenting a true matrix, with correctly associated headers. Test keyboard access to horizontal scrolling or plan controls where required. Zoomed text and long translated feature names should not overlap adjacent columns. Responsive layout should preserve meaning before it preserves compactness.
Maintain one source for entitlements
A comparison table can conflict with pricing cards, checkout, product documentation, or in-app upgrade prompts when each is maintained separately. Establish a common source or a review process that keeps plan names, limits, and capabilities aligned across these surfaces.
Review text values as well as symbols. A plan may still include a capability while its scope changes, so a checkmark-only update can miss the difference. New product terminology can also make an old row confusing even when the entitlement has not changed.
For controlled or staged rollouts, make availability understandable. A capability that is announced, restricted, or not yet broadly accessible should not appear as an unconditional included feature. Keep the matrix accurate to the offer a visitor can actually select, and provide relevant qualifications without overloading every cell.
Test real requirement-based choices
- Can visitors find the category relevant to their requirement?
- Are plan names and columns easy to track?
- Do numerical limits include their units or scope?
- Are inclusion symbols understandable?
- Does an unavailable value have an unambiguous meaning?
- Do explanations define unfamiliar terms?
- Are essential restrictions visible without hovering?
- Does emphasis preserve the readability of other plans?
- Can the matrix be used on mobile and with assistive technology?
- Do entitlements match pricing cards and the next selection flow?
Ask users to choose a plan for a realistic requirement, then explain their reasoning. A correct choice with a mistaken interpretation still signals a design problem. For example, someone may select the right tier while misunderstanding a quantity as a monthly allowance rather than a total limit. Improve the label and supporting explanation where those errors appear.
Check the entire path after selection. The selected plan, billing period, and relevant requirement should remain coherent in signup or purchase. A detailed matrix has done little useful work if the next screen obscures which offer the visitor chose. Repeat verification after entitlement changes, rather than relying on the table's initial launch review.
Consider a concise difference summary above a particularly long table. It can explain the main reason to move between tiers while the matrix provides verification. Keep that summary consistent with the rows, and avoid using it to omit a difference that would materially affect a visitor's decision.
Frequently asked questions about pricing comparisons
Should a comparison show every feature?
Show enough detail to support the plan decision accurately. A very long table may need grouping, a shared-features summary, or a differences view. Make any reduction explicit and preserve access to complete information where it matters.
Are checkmarks better than text values?
Use checkmarks for simple inclusion when their meaning is clear. Use text or numbers for limits, levels, qualifications, and scope. A mixed table can be effective when the conventions are consistent and unavailable states are unambiguous.
How should a plan table work on mobile?
Choose a model that preserves feature-to-plan relationships: readable horizontal scrolling, a clearly labeled plan selector, or stacked details with repeated labels. Test the actual comparison task instead of shrinking the desktop table until it fits.
Explore SaaS pricing plan comparison examples on SaaSFrame to compare category structure, entitlement values, highlighted columns, and responsive evaluation paths.