 SaaSFrame
Case Study
Feature real-world success with SaaS Case Study patterns. This gallery shows how to combine pull-quotes, hero images, and metric callouts to create a compelling narrative for your potential customers.
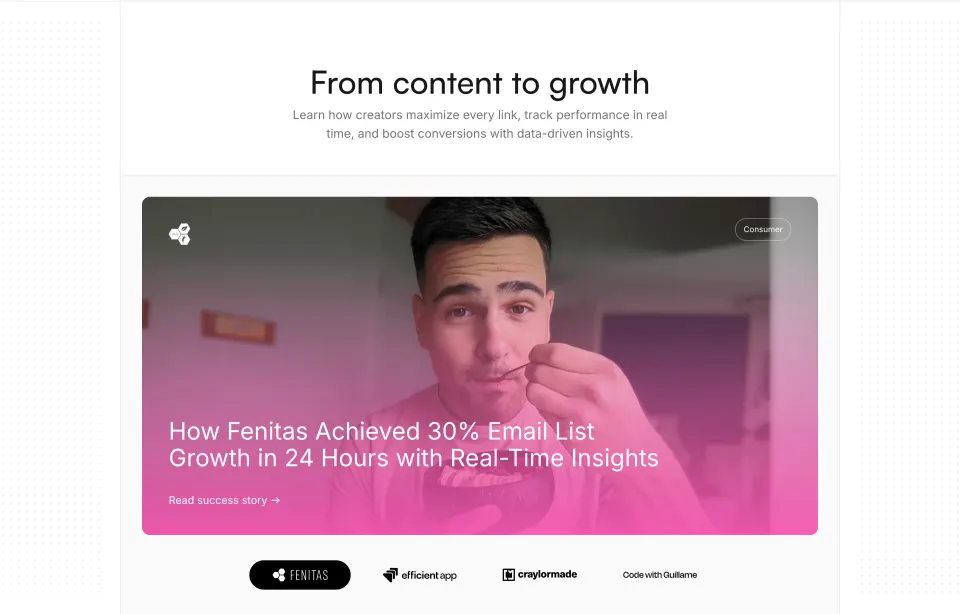

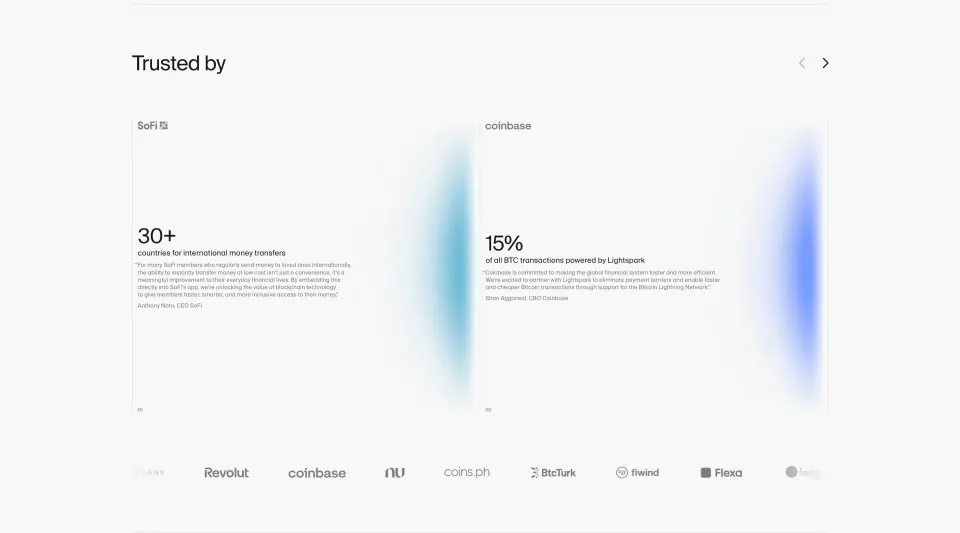


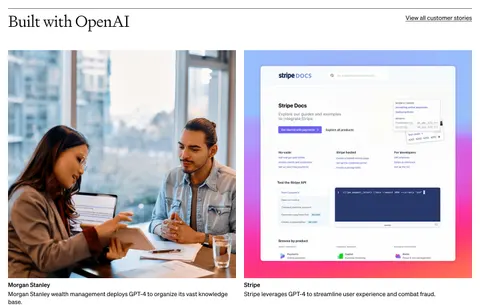

Case Study: design guide
A SaaS case study section gives visitors a path from a product claim to a customer's experience. Its preview should establish who the customer is, what changed, and why the story might be relevant. The section is strongest when its visible results lead to an explanation of the work behind them, rather than leaving impressive numbers without context.
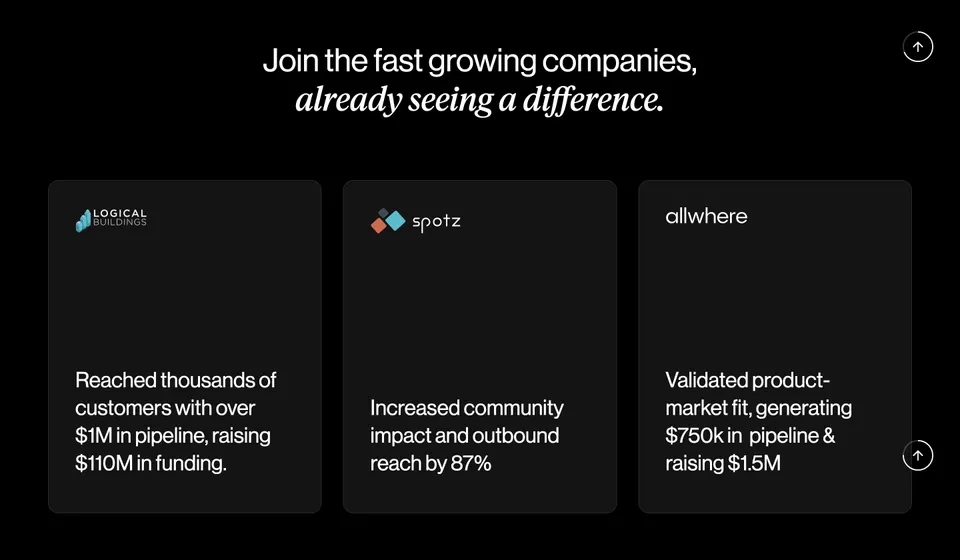
Sellx and Paddle show two result-focused approaches: parallel customer cards with short outcome summaries, and a featured customer story alongside smaller metric cards. The screenshots illustrate how results are presented. They do not independently verify the business outcomes or establish that the same results are typical for other customers.
Give each case study a recognizable problem and outcome
A case study is more than a logo or a positive quotation. It should explain a customer's starting situation, the product's role, and the resulting change. A preview cannot include the whole narrative, but it can identify enough of that relationship to help a visitor choose a story.
Start with the audience's evaluation question. A buyer may want to see a similar organization, a comparable workflow, or evidence about a specific implementation challenge. Choose featured stories that answer those questions rather than simply selecting the largest customer name.
Keep the preview connected to the full story. If a card highlights a revenue result, the destination should explain the period, context, and relevant work. If it highlights operational improvement, describe the workflow and what changed. The preview should invite informed reading rather than imply a universal promise.
Use parallel cards for quick customer recognition
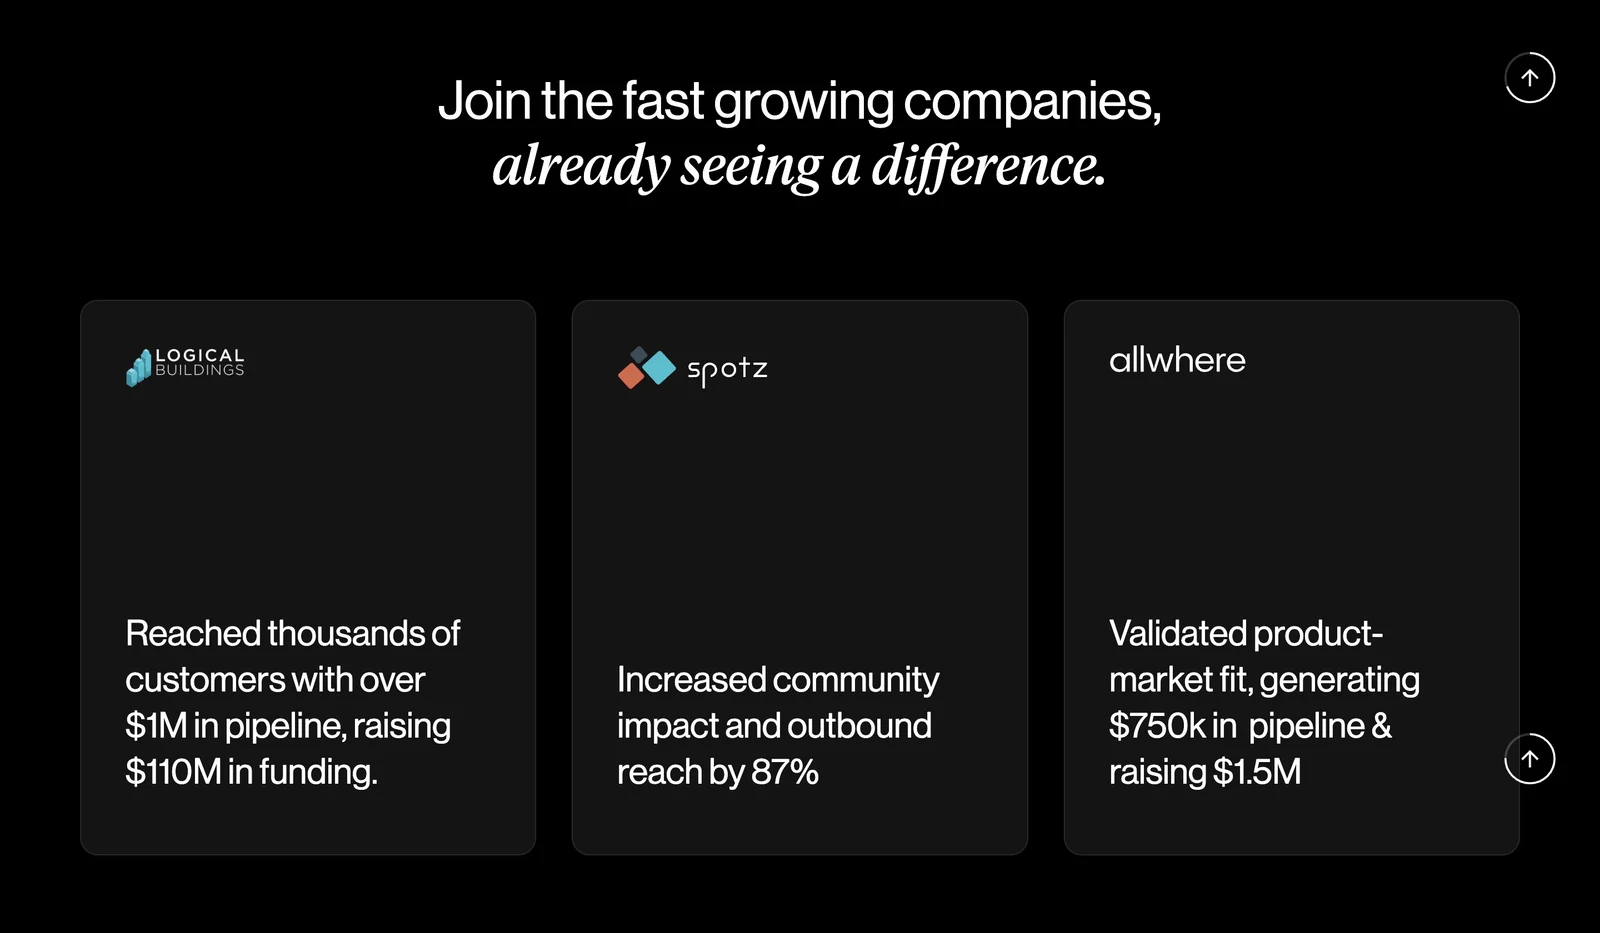
Sellx gives three customer cards a similar structure and visual weight. Each contains a logo and a short outcome statement. The large space between brand and result keeps the layout sparse, while the outcome text provides more information than a logo collection alone.
This structure supports a quick scan across customers. The visitor can identify a company and see the kind of result associated with it without opening every story. However, short summaries can combine several kinds of outcome, such as pipeline and funding, that need explanation at the destination.
When using parallel cards, keep the information comparable where practical. A mixture of percentages, pipeline figures, and broad praise can still be useful, but the card copy should make the measurement type clear. Do not give unrelated metrics an appearance of direct comparability simply because the cards share a layout.
Feature one story when it deserves more explanation
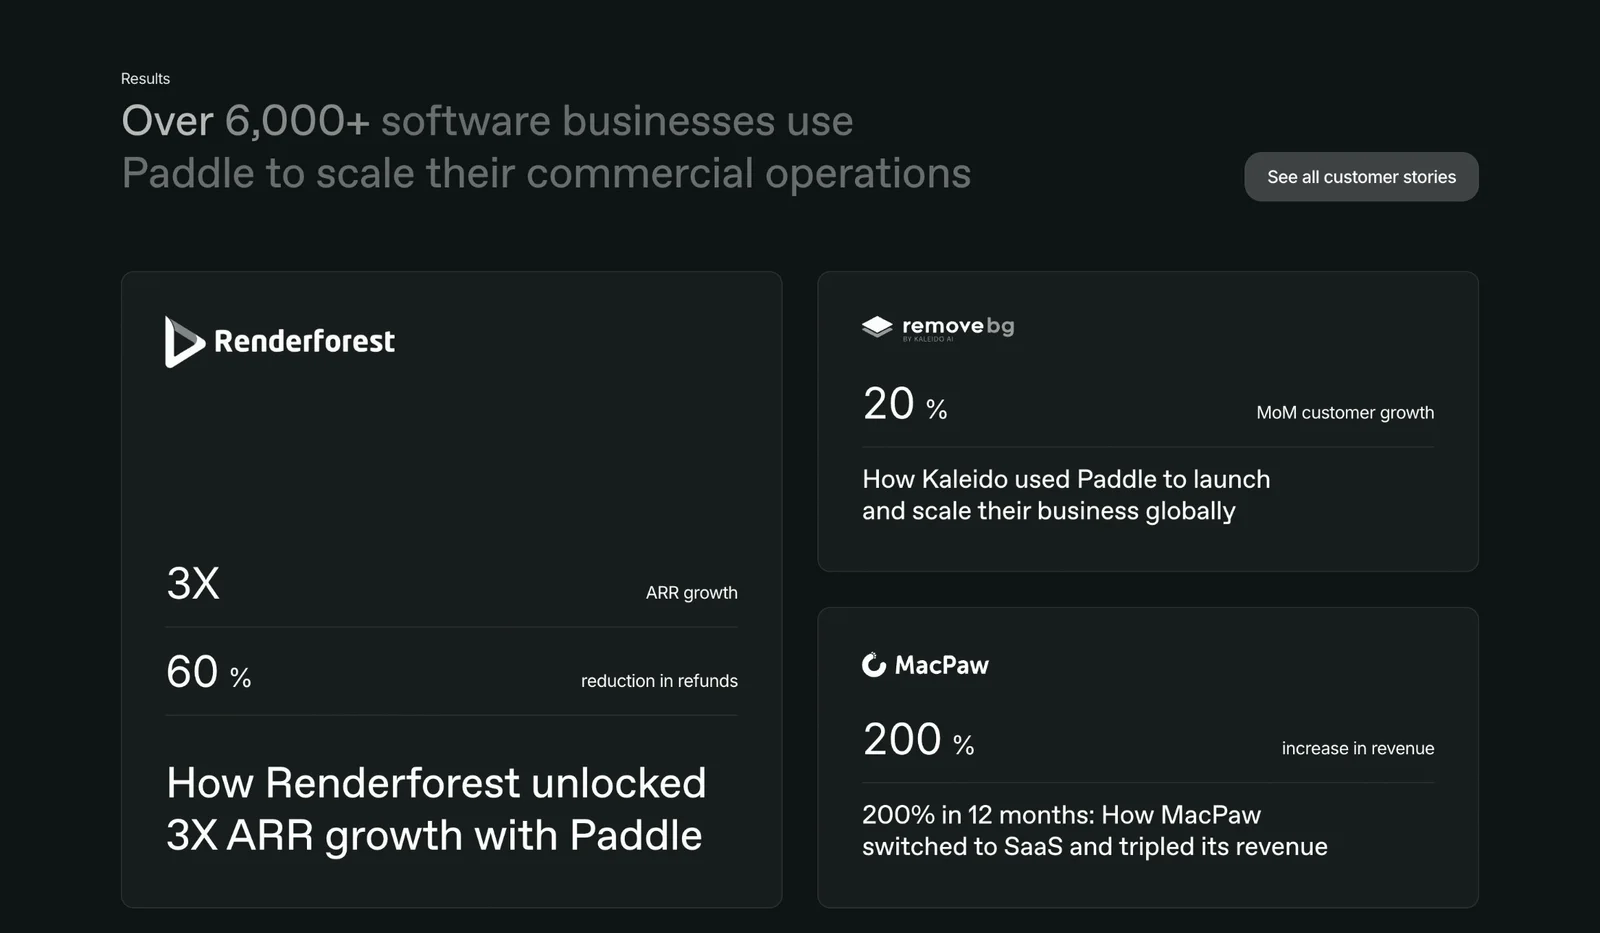
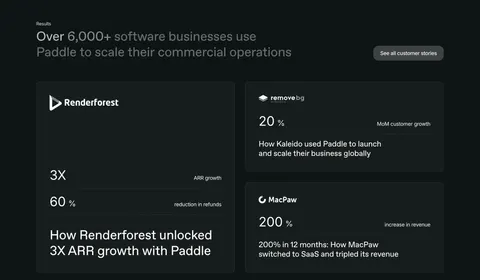
Paddle gives Renderforest a larger card with two result lines and a substantial story title. Smaller cards for other customers show one prominent result and a title. A See all customer stories action provides access to the wider collection.
The larger card establishes editorial priority and makes room for more than one dimension of the customer's story. Its hierarchy is useful when one example closely matches the page's promise or has a particularly informative narrative. The supporting cards show breadth without requiring the same amount of space.
Choose that hierarchy deliberately. A story should not remain featured forever only because its original asset fits the large card. Revisit relevance, accuracy, and audience fit. Keep the archive action visible so visitors whose needs differ from the featured example can find another story.
Label metrics so they mean something
A percentage or multiplier needs a label. Paddle pairs its visible figures with terms such as revenue growth and reduction in refunds, giving readers an initial understanding of what changed. A number without a measurement can create attention but little useful evidence.
The full story should establish the baseline, timeframe, scope, and source where those details affect interpretation. A growth rate, a total, and a reduction are different kinds of measurement. Avoid compressing them into a generic Results label that leaves visitors to infer the meaning.
Preserve qualifiers when shortening the preview. Do not turn one customer's experience into an unconditional product benefit. If the result depends on a particular configuration, period, or broader business change, make the destination explain that context. Design can improve the visibility of evidence, but it cannot make an unsupported interpretation more reliable.
Write story titles that reveal the product's role
A strong case study title connects the customer to a change and, where useful, names the product's contribution. The Paddle capture uses titles that describe growth, launch, and a business transition. These give the visitor more reason to open a story than an isolated customer name would.
Keep causal language proportionate to the evidence. A customer's result may reflect several actions, including changes outside the software. The story should explain what the product helped with rather than imply that the software alone caused every business outcome.
Use clear language that survives outside the card. Titles may appear in search, related-content modules, or accessible link lists. A title such as Customer success is difficult to distinguish from its neighbors. A specific title helps both discovery and accurate expectations about what the visitor will read.
Choose evidence relevant to the surrounding page
A homepage can use stories that establish the product's general value. A feature page benefits from customers using that capability. An industry page benefits from a similar context and relevant constraints. The same story can appear in several places, but its preview should remain true to the original evidence.
Do not use a famous customer as a substitute for fit. A visitor may find a smaller organization with a comparable workflow more informative than a recognizable brand operating in a different environment. Provide categories or filters in a larger archive so readers can find stories by task, audience, or product area.
Pair quantified results with explanatory stories when possible. A quote can add a person's perspective, while a workflow image can show what was implemented. Keep each evidence type clearly attributed. A customer logo establishes identity, a quote conveys a statement, and a metric describes a measurement; none automatically proves the others.
Provide a clear route into the full story
Case study cards need a recognizable action or linked title. If the whole card is interactive, give it one clear destination and a visible focus state. If there are several resources, such as a written story and a video, label those choices separately.
The destination should preserve context. A visitor selecting a named customer's outcome should arrive at that customer's story, not a generic signup page. If access is gated, explain that before requiring personal information. Avoid hiding a download form behind a label that suggests immediate reading.
Keep an archive path available when only a small selection is visible. Paddle's See all customer stories action acknowledges that the highlighted examples cannot match every visitor. A searchable or categorized archive can extend the usefulness of a compact section without overcrowding the original page.
Design for long titles, dark themes, and narrow screens
Both captures use dark backgrounds and large result text. This gives the outcomes prominence, but supporting labels and story titles still need sufficient contrast. A faded section heading or subdued metric label can make the context harder to read even when the largest number is clear.
Allow customer names and titles to wrap naturally. A result card should not depend on a fixed character count, and a logo should preserve its proportions rather than stretch to match neighboring brands. On mobile, maintain the relationship between customer identity, metric, and title when the grid stacks.
Use a document order that reflects the intended priority. A featured story should appear in a sensible place for keyboard and screen-reader users, not only in a visually prominent position. Test zoomed text and missing logos. The story should remain identifiable through its real text when an image is unavailable.
Review the evidence and the preview together
- Does the preview identify the customer?
- Does it name a specific change or result?
- Are metrics labeled rather than left as isolated numbers?
- Does the full story explain timeframe, scope, and context?
- Is the product's role described without overstating causality?
- Are featured stories relevant to this page's audience?
- Does the link lead directly to the promised story?
- Can visitors find other stories when the featured examples do not fit?
- Does the layout support long titles and readable labels?
Maintain the evidence after publication. Customer roles, branding, product capabilities, and permission to use assets can change. Give each story an owner and retain the approved source material. If an outcome is no longer presented accurately, update the preview and the full story together rather than changing only the visible metric.
For evaluation, distinguish interest in a recognizable brand from understanding of the product. Ask visitors what they learned from a preview and which story they would choose for their own situation. This reveals whether the section is acting as useful evidence or merely as a collection of impressive names and figures.
Frequently asked questions about case study sections
Does every case study need a quantified result?
No. A well-explained workflow change or implementation lesson can be valuable without a headline number. Use quantitative results when they are accurate, meaningful, and supported by context. Do not invent a metric to make every card look equally persuasive.
How many customer stories should appear on a landing page?
Show a small set that answers the page's main evaluation questions, then provide access to the wider collection. A focused selection is easier to scan than a long archive embedded in the page. Choose relevance over an arbitrary target count.
How is a case study different from a testimonial?
A testimonial presents someone's statement about their experience. A case study explains a customer's situation, implementation, and outcome in more depth. A quote can support a case study, but it does not replace the narrative and context.
Explore SaaS case study section examples on SaaSFrame to compare customer previews, result labels, featured-story hierarchy, and archive navigation.