 SaaSFrame
Table
Master data management with SaaS Table patterns. Explore sortable headers, sticky columns, inline editing, and row-selection features for professional-grade data grids.
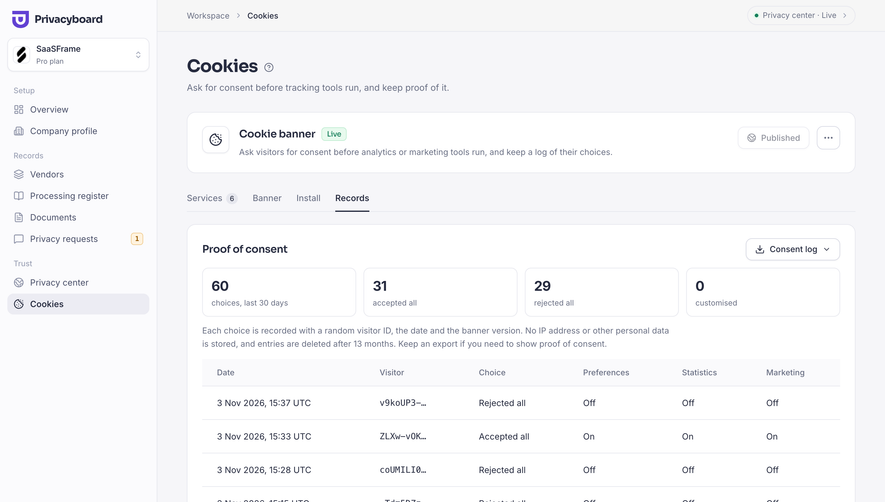

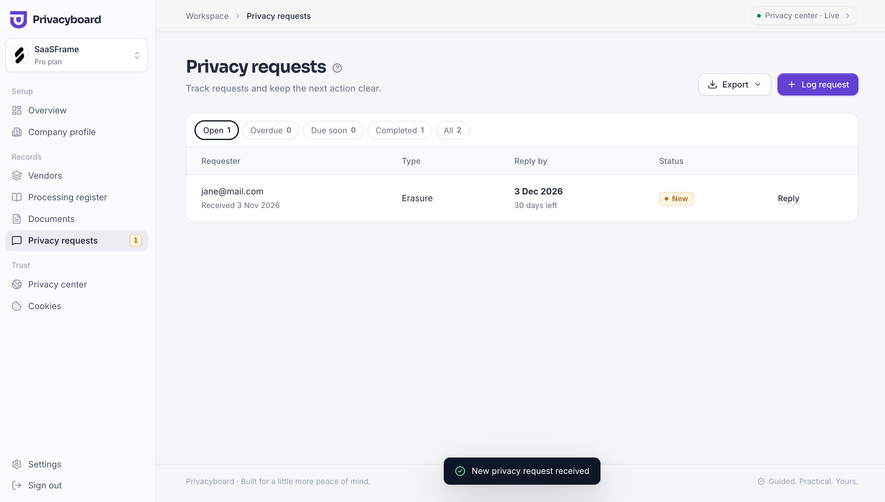
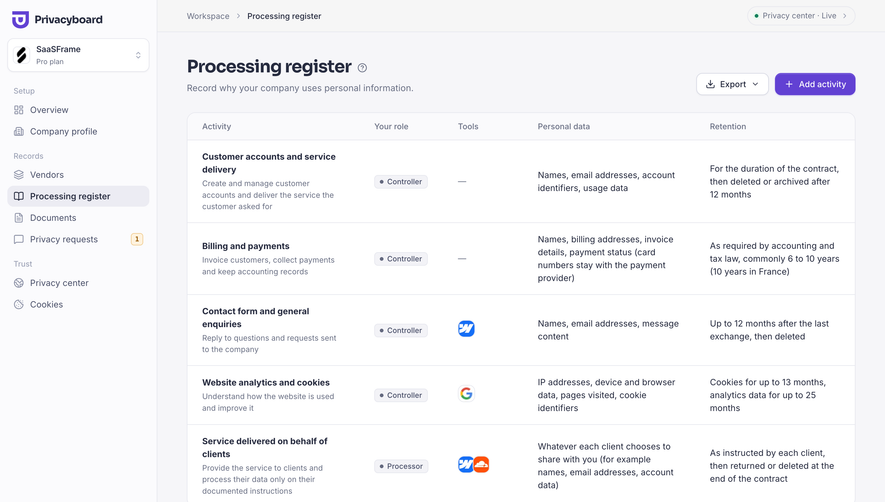
Index of all 182 Table examples
- Privacyboard Vendor register
- Moss Usage and cost breakdown
- Moss Storage and query analytics
- Moss Website crawl in progress
- Moss Indexed documents list
- Moss Search index created
- Moss Search indexes overview
- Dub Referral program dashboard
- Dub API request logs
- Dub API keys overview
- Pangram Developer dashboard
- Pangram Text checks history
- Tines Audit Log
- Tines Workspace Members
- Tines Onboarding Performance Report
- Tines Employee Onboarding Dashboard
- Tines AI Token Usage & Costs
- Tines Workflow Savings Report
- Tines Personal Workflow Library
- Tines Onboarding Workflow Runbook
- Tines Workflow Workspace
- Lightspark Account & Security Settings
- Lightspark Transaction History
- Context.dev Usage history
- EigenPal API keys list
- EigenPal Webhook endpoints list
- EigenPal Workflows list
- EigenPal Triggers empty state
- EigenPal Shared resources library
- Hugging Face Repositories overview
- Hugging Face Dataset details and viewer
- Cloudflare DNS Analytics
- Cloudflare Traffic Overview
- Cloudflare AI Crawl Optimization
- Cloudflare AI Crawl Security
- Cloudflare Domain Overview
- Cloudflare Transfers List
- Cloudflare Domains List
- Lightdash AI Analysis
- Lightdash Metric Analytics
- Lightdash Metrics Catalog
- Lightdash KPI Dashboard
- Lightdash Main Dashboard
- Profound Content Dashboard
- Profound Prompts
- Claude Billing
- Claude Skeleton Screen
- Claude Logs
- Claude API Cost
- Claude API Usage
- Claude Usage Settings
- Dust Invite new users
- Dust Programmatic Usage
- Dust Subscription
- Dust People & Security
- Dust Drive Connected Data
- Dust Connections List
- Prelude Invite Team Members
- Prelude Team Members
- Prelude Billing
- Prelude Region List
- Unkey Audit Log
- Unkey Create New Permission
- Unkey Create New Role
- Unkey Roles
- Unkey Manage Role And Permissions
- Unkey API Table
- Unkey Billing Settings
- Unkey API Key Ready
- Unkey Create First API Key
- Unkey Create First API Key
- Visitors Invite Team Members
- Visitors Usage Settings
- FullEnrich Billing
- FullEnrich Export A Contact
- Huly Cards
- Hume AI Expression Measurement Billing
- Hume AI Text to Speech Billing
- Hume AI Usage
- Hume AI API Keys
- Hume AI Voices Library
- Atlas Export Map
- Pitch Import Presentation
- Pitch Workspace Members
- Pitch Analytics Links Overview
- Pitch Invite Team Members
- Customer.io Segments Table
- Customer.io Activity Logs
- Customer.io Contact Table
- Customer.io Data Import Mapping
- Customer.io Upload CSV
- Customer.io Import CSV
- Checkout.com Team Permissions
- Checkout.com API Key Details
- Checkout.com Manage API Keys
- Checkout.com API Keys Overview
- Checkout.com Set Up API Keys
- Superlist Invite Team Members
- Wiza Billing Settings
- Wiza Import Data Configuration
- Wiza Import Data Output
- Wiza Import Data Mapping
- Wiza Invite Team Members
- Wiza Team Members
- Wiza Contacts Table
- OpenAI Billing Page
- OpenAI Usage Activity
- OpenAI Usage Cost
- OpenAI New Assistant Created
- OpenAI API Keys
- OpenAI API Key Created
- OpenAI Create API Key
- OpenAI Verify Phone to Create API Key
- Mintlify Team Members
- Latitude Project Dashboard
- Intercom Content Table
- Intercom Empty Content List
- Intercom Articles List
- Intercom Workflows Table
- Intercom Users Table
- Uvodo Billing
- Uvodo Team Members
- Uvodo Team Members
- Uvodo Inventory Table
- Uvodo Products Table
- Remote Time Off Summary Table
- Remote Time Off Requests Table
- Remote Hire & Onboarding Table
- Hyperline Invoices Dashboard
- Copperx Payment Links Table
- Audienceful Content Table
- Audienceful Automations Table
- Audienceful People Table
- Audienceful People Table
- Duffel Order Dashboard
- Meiro Analytics
- Supabase Table Editor
- Supabase Column Deleted
- Supabase Delete Column
- Supabase Empty Table
- Stripe Invoices Dashboard
- Stripe Customers Dashboard
- Stripe Payments Dashboard
- Mixpanel Events Dashboard
- Mixpanel Users Dashboard
- Cake Equity Notes Dashboard
- Cake Equity Shareholders Dashboard
- Clay Contacts Dashboard
- Resend Logs History
- Resend Emails History
- Reflect Dashboard
- Mercury Referral Dashboard
- Mercury Checking Dashboard
- Mercury Capital Dashboard
- Mercury Cards Dashboard
- Mercury Payments Dashboard
- Mercury Transactions Dashboard
- Phantombuster Automation Results
- Height Tasks List
- Olvy Users List
- Better Stack etter Uptime Hearthbeat Created
- Better Stack etter Uptime Incidents Dashboard
- Better Stack etter Uptime Monitors Dashboard
- Hotjar Recordings Dashboard
- Lemon Squeezy Products List
- Lemon Squeezy Discount Dashboard
- Lemon Squeezy Orders Dashboard
- Attio Company Team
- Attio Companies List
- Campsite Tag Settings
- June Dashboard
- June People Table
- Wope Volume trends
- Wope Daily progress
- Wope Performance Summary
- Reveal Dashboard
- Upflow Dashboard
- Upflow Dashboard
- Upflow Dashboard
Table: design guide
Short answer
A comparison table lines up options in rows and columns so values can be compared directly, as in feature matrices and plan comparisons. Choose criteria that matter to the decision, keep column headers identifying each option, keep row meanings stable, state units and highlight a recommended option without hurting readability.
In the libraryas of November 2026
- Examples
- 182
- SaaS products
- 57
- Last added
- Nov 2026
Most common inTable 79Dashboard 18Usage 12Billing 10Analytics 9
Recently addedPrivacyboardMossDubPangramTines
A table organizes information through shared rows and columns so visitors can compare corresponding values. On SaaS websites it often appears as a feature matrix, plan comparison, or structured comparison with another approach. The pattern is useful when readers need to examine the same criteria across several options.
This collection uses the Table name with a comparison URL, and its available references emphasize comparison layouts. The guide therefore focuses on the table's information structure and readability. An editable data grid inside an application has additional interaction needs that a marketing comparison does not necessarily require.
Which criteria support a real comparison?
Start with the visitor's decision rather than the available marketing claims. Which differences affect fit, cost, workflow, or eligibility? A table can make those differences inspectable, but it cannot make irrelevant criteria useful simply by aligning them in rows.
Use comparable information in each row. If one cell contains a numeric limit and another contains a vague adjective, visitors cannot make a straightforward comparison. Explain a difference in scope when the options are not measured on the same basis.
Keep the criteria selective enough to scan. A very long matrix may need groups or a route to detailed specifications. The purpose is to help someone evaluate alternatives, not to display every fact the organization can collect.
Make headers carry the identity of each option
The ConvertKit capture includes a structured comparison with two named plan columns and a left-hand column of criteria. Rows cover subscriber-related information, email volume, automation, segmentation, and monthly price. One option receives a shaded background and a colored top edge.
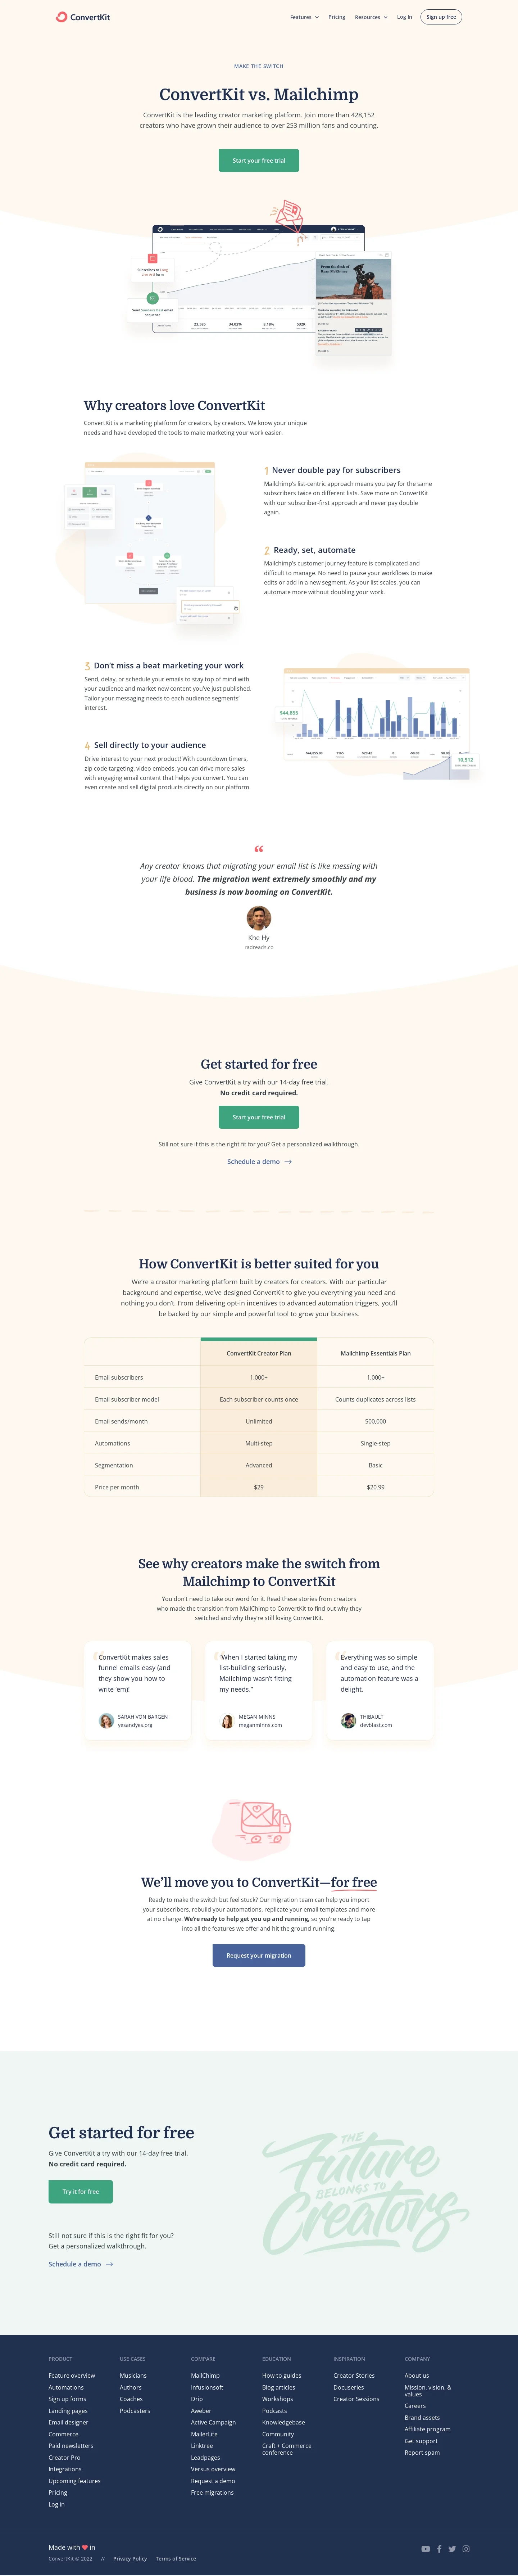
The header identifies the specific plans being compared, which is more precise than naming two brands alone. The highlighted column communicates promotional emphasis while the shared rows establish the comparison structure. The historical values and plan claims in the capture are not verified current product specifications or prices.
For your own table, label options and conditions precisely. If the comparison concerns particular plans, billing periods, or configurations, make those qualifications visible. A brand-level heading can overstate the scope when the cells actually describe one selected tier.
Distinguish a strict matrix from paired explanatory rows
The Front capture uses paired columns in two comparison blocks. Each row places a short account of one approach beside a corresponding account of the alternative. Check and cross symbols reinforce the visual distinction, with the product side receiving a colored treatment.

This format offers more explanatory room than a compact numeric matrix. It can communicate workflow differences that do not reduce naturally to yes or no. It also requires careful wording because a paired layout can make broad generalizations look like equivalent measured facts.
Treat the capture as an example of composition, not current verification of the comparative claims. When adapting the structure, describe the relevant conditions and avoid presenting a broad category of tools as though every product in that category behaves identically.
Keep row meanings stable across all columns
Each row should answer the same question for every option. If the criterion is monthly volume, every cell needs a compatible period. If the criterion is availability, distinguish included, available as an add-on, and unsupported rather than using the same checkmark for all three.
Use concise values with nearby explanations when qualifications matter. A footnote can clarify a limited case, but repeated distant footnotes can make the table difficult to use. Consider a short inline qualification or a clearly associated detail control when the condition changes the decision.
Define unfamiliar criteria. A visitor should not have to interpret an internal feature name before understanding why the row matters. Group related criteria under understandable headings when the table covers several aspects of evaluation.
Highlight an option without weakening readability
A recommended column can help visitors orient themselves. Its styling should preserve the legibility of both the highlighted and alternative options. Muting every competitor cell until it is hard to read makes the table less useful as an evaluation tool.
Explain a recommendation when it depends on assumptions. Best for growing teams is more meaningful if the relevant team size, workflow, or capacity is described. A visual badge alone can imply a universal recommendation that the data does not support.
Keep the recommendation consistent with the surrounding page. If a calculator or audience selector changes the recommended plan, make the relationship understandable. A table that permanently highlights a different option can create uncertainty about which guidance to follow.
Make numeric comparisons explicit about units and time
Prices, limits, percentages, and capacity values need a common basis. Monthly and annual amounts should not appear side by side without clear labels. A per-seat amount needs to be distinguishable from a total subscription cost.
Avoid false precision or missing conditions. A price may depend on volume, currency, taxes, or a minimum commitment. A usage limit may refer to a workspace rather than an individual account. Show the qualification near the value when it materially changes interpretation.
Assign ownership for updates, especially when the table includes another company's information. Historical screenshots are useful design references, but their values should not be copied into a current comparison. Verify consequential current specifications through appropriate authoritative sources before publishing them.
Preserve relationships on narrow screens
A wide table needs a deliberate mobile strategy. Horizontal scrolling can preserve the matrix, but it needs an understandable cue and access to row labels. Stacking each option can improve readability while making cross-option comparison more difficult.
Choose according to the task. If visitors compare one criterion across options, preserving rows may be important. If they mainly inspect a single plan, a stacked detail view may serve them better. Do not transform the table into cards without checking whether the original comparison remains possible.
Review long labels, text zoom, and varying content lengths. A fixed cell height can clip a qualification that changes meaning. Sticky headers or row labels can help in large tables, but they should not cover focused content or consume an unreasonable amount of screen space.
Use semantic relationships rather than visual alignment alone
The reading experience should communicate which row and column a value belongs to. A collection of styled boxes may look like a table while losing those relationships outside the visual layout. Choose the structure appropriate to the information and preserve understandable header associations.
Provide text equivalents for symbols. A green check and red cross should not be the only account of a capability's status. The meaningful distinction might be included versus unavailable, or supported versus requiring an add-on; express the actual distinction.
If cells contain interactive details, keep their focus order and labels clear. A visitor should be able to identify which criterion a detail action explains. Avoid dozens of identical unlabeled icons that require visual position to make sense.
Add interaction only when it supports inspection
A marketing comparison may need no sorting or editing. A larger informational table may benefit from filtering, search, or column selection. These controls should help visitors answer a question rather than turn a simple comparison into a miniature spreadsheet.
When filters change the table, make the scope clear. A hidden criterion should not make an option appear more complete than it is. Provide a way to restore the full relevant comparison and distinguish no matching results from unavailable data.
If the table becomes an operational data interface, additional questions arise around selection, editing, saving, and recovery. Treat those as a separate interaction design scope. The two captured marketing layouts do not demonstrate editable-grid behavior.
Verify the information before evaluating persuasion
Review every row for comparable scope, current values, units, qualifications, and source support. Check that a highlighted option does not receive a different standard of description. A tidy matrix can make an inaccurate claim look authoritative.
Then ask visitors to make a decision using realistic criteria. Can they identify the relevant differences and explain the conditions behind the values? Test narrow layouts, keyboard access, missing data, and long content rather than only the ideal desktop screenshot.
Explore the SaaSFrame table collection to compare compact matrices with paired explanatory rows. Borrow the structure that supports your decision, then supply verified information and a readable account of its limitations.
Keep empty cells meaningful. A blank can suggest that information is unknown, unavailable, or intentionally omitted, and those meanings are different. Use a clear status when the distinction affects evaluation. If a criterion does not apply to one option, say so rather than treating it as a failure. This makes the comparison more useful and prevents the layout from creating a conclusion that the underlying information does not support. Review these cases alongside the fully populated rows.
Questions to resolve before building a comparison table
Should every difference be reduced to a checkmark? No. Use a concise explanation when availability or capability depends on conditions. A binary symbol can hide the difference visitors need to understand.
How should a table behave on mobile? Preserve the relationships required for the task. Scrolling, stacking, or a focused comparison view can work, but each needs testing with realistic labels and content.
Can a table be visually persuasive and still useful? Yes. Highlighting can guide attention while preserving readable alternatives, clear criteria, and accurate qualifications. The comparison should remain inspectable rather than relying entirely on promotional styling.