Charts
141
Visualize performance with modern SaaS Chart patterns. This collection highlights line graphs, bar charts, and donut visualizations designed for clarity, interactivity, and responsiveness.

A chart turns data into a visual relationship that people can inspect. In a SaaS interface, it may help compare categories, follow change over time, identify an unusual value, or evaluate progress. The useful starting point is the question the chart answers, not the visual style the dashboard needs.
Different questions require different encodings. Comparing two values differs from describing a continuous trend. Showing a total differs from explaining a distribution. A chart can look polished while answering the wrong question or obscuring the basis of a comparison. Define the metric, scope, period, and intended decision before selecting the form.
A good chart also communicates its limits. Missing data, incomplete periods, changing filters, and provisional values can alter interpretation. The surrounding interface should make those conditions understandable. Visual clarity includes the title, labels, explanatory text, and state handling, rather than ending at the plotted marks.
Narrative BI's captured analytics view presents a headline about a change in New York page views. Supporting text names the two dates and absolute values, while a two-bar chart shows the comparison. The percentage claim is therefore accompanied by the quantities that produced it rather than standing alone as a dramatic headline.
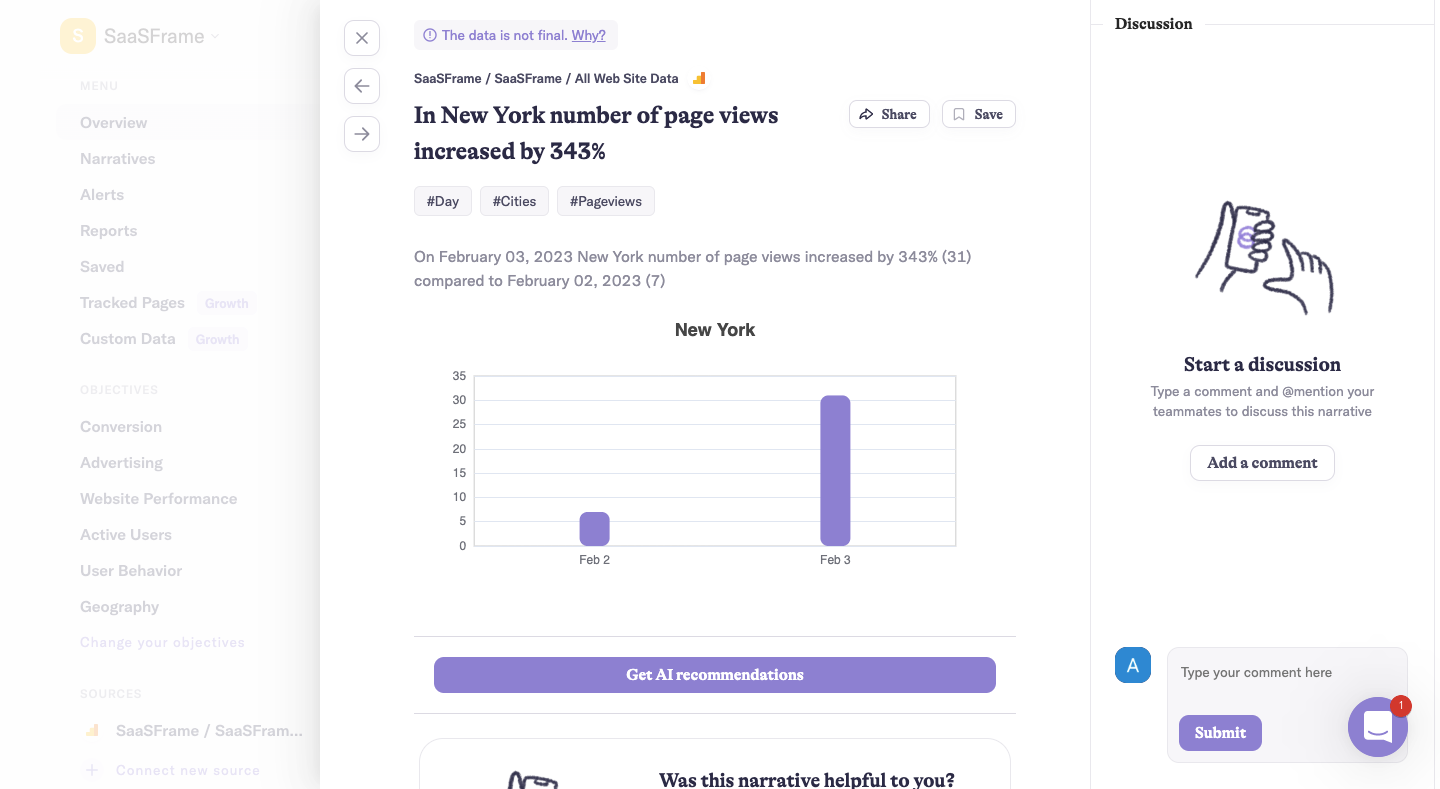
This is important when a percentage change has a small baseline. A large relative increase can describe a modest absolute change. Showing the underlying quantities helps readers evaluate scale. Do not expect the percentage to communicate practical significance by itself.
The values belong to a historical capture, not a current report about SaaSFrame traffic. Their value here is the relationship among headline, explanation, and chart. When designing a similar insight, make it possible to inspect the comparison basis and distinguish a measured change from an interpretation of why it occurred.
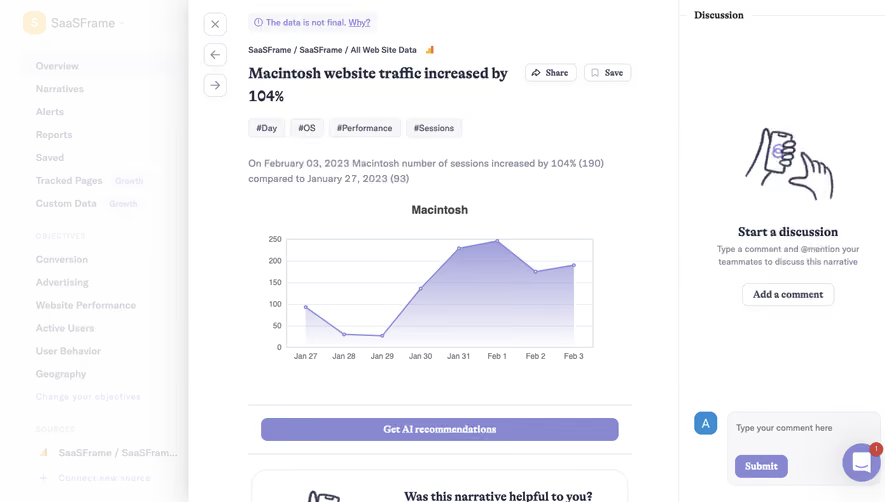
A second Narrative BI capture shows a filled trend chart for sessions associated with Macintosh across several dates. Its supporting text compares the final date with an earlier date, while the visual exposes the intervening pattern. That supplies more context than a two-point comparison alone.
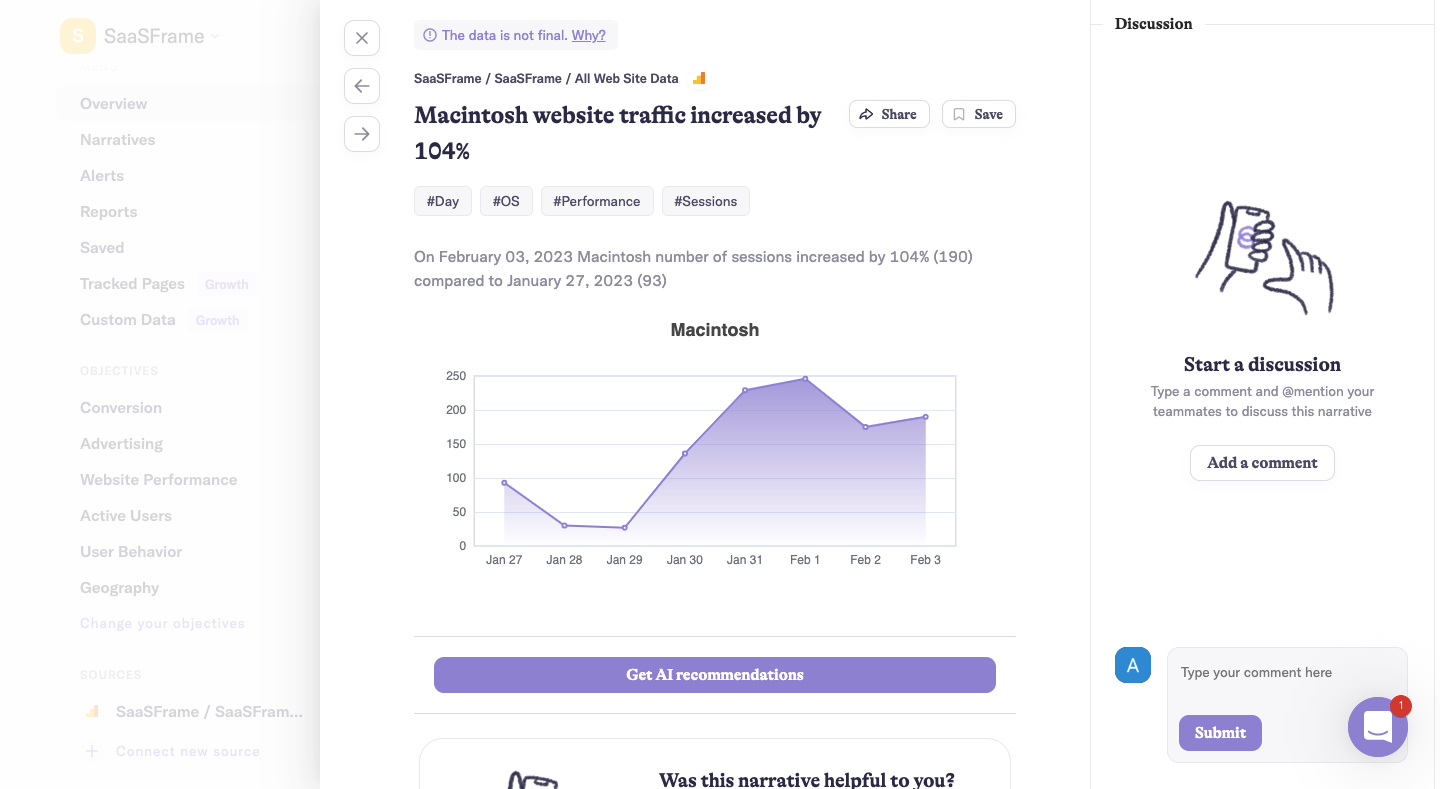
A trend can show whether change was steady, abrupt, or interrupted. The chosen endpoints may produce an accurate comparison while hiding a more complicated path. Keep the temporal view appropriate to the question: a daily trend can explain variation, while a summary card may suffice when users only need a period total.
Do not infer the cause of the pattern from the shape alone. An increase may coincide with a campaign or product change, but a chart does not establish causation without additional evidence. An insight interface should distinguish the observation, possible explanation, and any recommended next action.
A chart needs a recognizable metric and unit. Sessions, users, page views, revenue, and active accounts describe different quantities. A title such as Growth is insufficient when readers need to make a decision. Identify the measurement and its relevant scope through the title, subtitle, labels, or nearby controls.
Explain filters that materially change interpretation. Geography, account, device, plan, and date range can each produce a different result. Keep active scope visible, especially when a chart is copied, shared, or opened from a saved view. A recipient should not need access to the creator's memory to understand what the image represents.
The Narrative BI captures place source context and tags above the chart. Those cues can aid orientation, but tags should not substitute for a clear sentence when the measurement is unfamiliar. Review whether a user can describe the metric and comparison without decoding internal field names.
Scale choice affects how differences appear. For bar comparisons, the baseline is part of the encoding and needs deliberate treatment. For trends, a narrower range can reveal variation but may make a small movement look dramatic. Make scales readable and avoid visual choices that imply a larger practical change than the values support.
Use consistent units when comparing charts. If one panel uses thousands and another uses absolute counts, label that difference clearly. A dashboard can invite visual comparison even when panels have independent ranges. Help users recognize where the same height or slope does not represent the same quantity.
When an unusual value compresses the rest of the chart, consider an appropriate alternate view or explanation. Do not silently remove it to improve appearance. If a scale transformation or aggregation is used, make the method understandable at the level needed for interpretation. The visual should remain connected to the actual data.
The captured Narrative BI views include a notice that the data is not final. That is a meaningful qualification because a provisional value can change after the user reads the insight. Place such information where it affects interpretation, rather than in an unrelated settings page.
Distinguish zero from missing data. A zero may be a measured absence; a gap may mean the source did not report. Plotting both identically can create a false trend or misleading average. Explain the state and choose an encoding that does not imply a measurement the system lacks.
Incomplete periods require context too. Comparing a partial current day with a complete previous day can produce an apparent decline that is primarily a timing difference. Define the comparison rule and make it visible. If values are delayed, show the relevant freshness information where users rely on the chart.
Tooltips can provide exact values, categories, or dates, but users should not need a pointer to understand the chart's central message. Titles and axes should communicate the relationship, while an accessible detail route can expose the underlying quantities. Touch and keyboard users need a usable inspection path.
For interactive charts, define how selection, focus, and filtering behave. Clicking a bar may open records, select a category, or apply a filter. Make that consequence clear and show the resulting state. A visually highlighted mark should not ambiguously mean hover, selection, or a data warning.
The supplied screenshots do not establish tooltip, keyboard, or drill-down behavior. Verify those interactions separately. Review exact-value access, focus visibility, and whether users can return from a detail view without losing their chart filters or time range.
Narrative BI's captures place a discussion panel beside the insight and offer share and save actions. This acknowledges that interpretation may involve other people. A chart can be a starting point for discussion rather than a final answer that requires no review.
Keep commentary distinct from measured data. A teammate's hypothesis should not appear as if it is another recorded metric. Preserve the chart's scope when sharing, and explain whether the shared view remains live or captures a particular state. A saved insight and a continuously updating dashboard can support different expectations.
Recommendations also need a clear relationship to evidence. The captured interface offers an AI recommendation route, but the screenshot does not show the resulting advice. A comparable implementation should make the observation inspectable and distinguish generated interpretation from the underlying values.
A wide chart may not remain readable when reduced to a phone or embedded in a small card. Review label density, margins, and the information that must survive. A narrower view can use fewer displayed ticks while retaining access to precise dates and values, but it should not change the chart's meaning silently.
Text enlargement and translation can alter label length. Avoid fixed spacing that clips titles or overlaps axis labels. Legends should identify series clearly and remain associated with the relevant chart. If many series compete, consider filtering or small multiples rather than shrinking every label.
Loading and failure states should preserve context. A skeleton can reserve space, but it should not look like actual data. If a source fails, explain that condition rather than plotting an empty chart as zero activity. Keep the last known data clearly identified if the product allows continued inspection during refresh.
Ask users to explain the metric, identify the comparison period, inspect an exact value, and describe the chart's limitation. Include a small baseline, missing data, and an incomplete period. These cases reveal whether the design supports interpretation rather than only visual preference.
Then test the decision the chart is intended to support. Can users find the relevant records, compare periods appropriately, or discuss the insight with a teammate? A chart that attracts attention but produces incorrect conclusions is not successful. Measure interpretation errors and correction effort alongside interaction.
Use this checklist:
Keep exported charts connected to their context. An image shared in a meeting or message should retain the metric, period, scope, and important qualification. Otherwise a correct chart can become misleading when removed from the dashboard that explained it. Decide which contextual elements belong in the export rather than relying on the recipient to reconstruct them.
Review the chart again when the metric definition changes. A familiar label may conceal a new counting rule or source. Where comparisons cross that change, explain the discontinuity or use an appropriate comparable period. Visual consistency should not imply measurement consistency when the underlying definition differs.
No. A single value may be sufficient when no relationship needs inspection. Use a chart when comparison, distribution, or change over time helps the task. Select the form around the question rather than filling dashboard space.
Usually not when scale matters. Include the relevant period, baseline, and absolute quantities so users can judge practical significance. A large percentage can arise from a small starting value.
Distinguish unavailable data from a measured zero. Explain the source or loading state and provide an appropriate recovery route. If showing older values, identify them as the last known data rather than implying they are current.
Explore the SaaSFrame chart examples to compare metric context, visual comparisons, and interfaces that support reliable interpretation.