Design with AI
Generate a new design based on this screen using your own content.
# Design from Reference: DataPulse Analytics
Create an original, high-fidelity visual design inspired by the reference. Prioritize composition, typography, colors, spacing, and component styling over technical implementation.
## Reference
- **Product:** DataPulse
- **Category:** Analytics
- **Screenshot:** https://cdn.prod.website-files.com/5e9dc792e1210c5325f7ebbc/6acb61b7c08cd859ff851b64_6acadc7d5f2661b1665877ba_cms-ff5cc6b7648cf72a2605c14f.webp
Analyze the screenshot first. If inaccessible, request it rather than guessing.
## Content
{{content.instructions}}
{{content.data}}
Preserve essential messaging and factual accuracy. Adapt structure and copy length for visual balance; never invent product claims.
## Visual Design
### Overall aesthetic
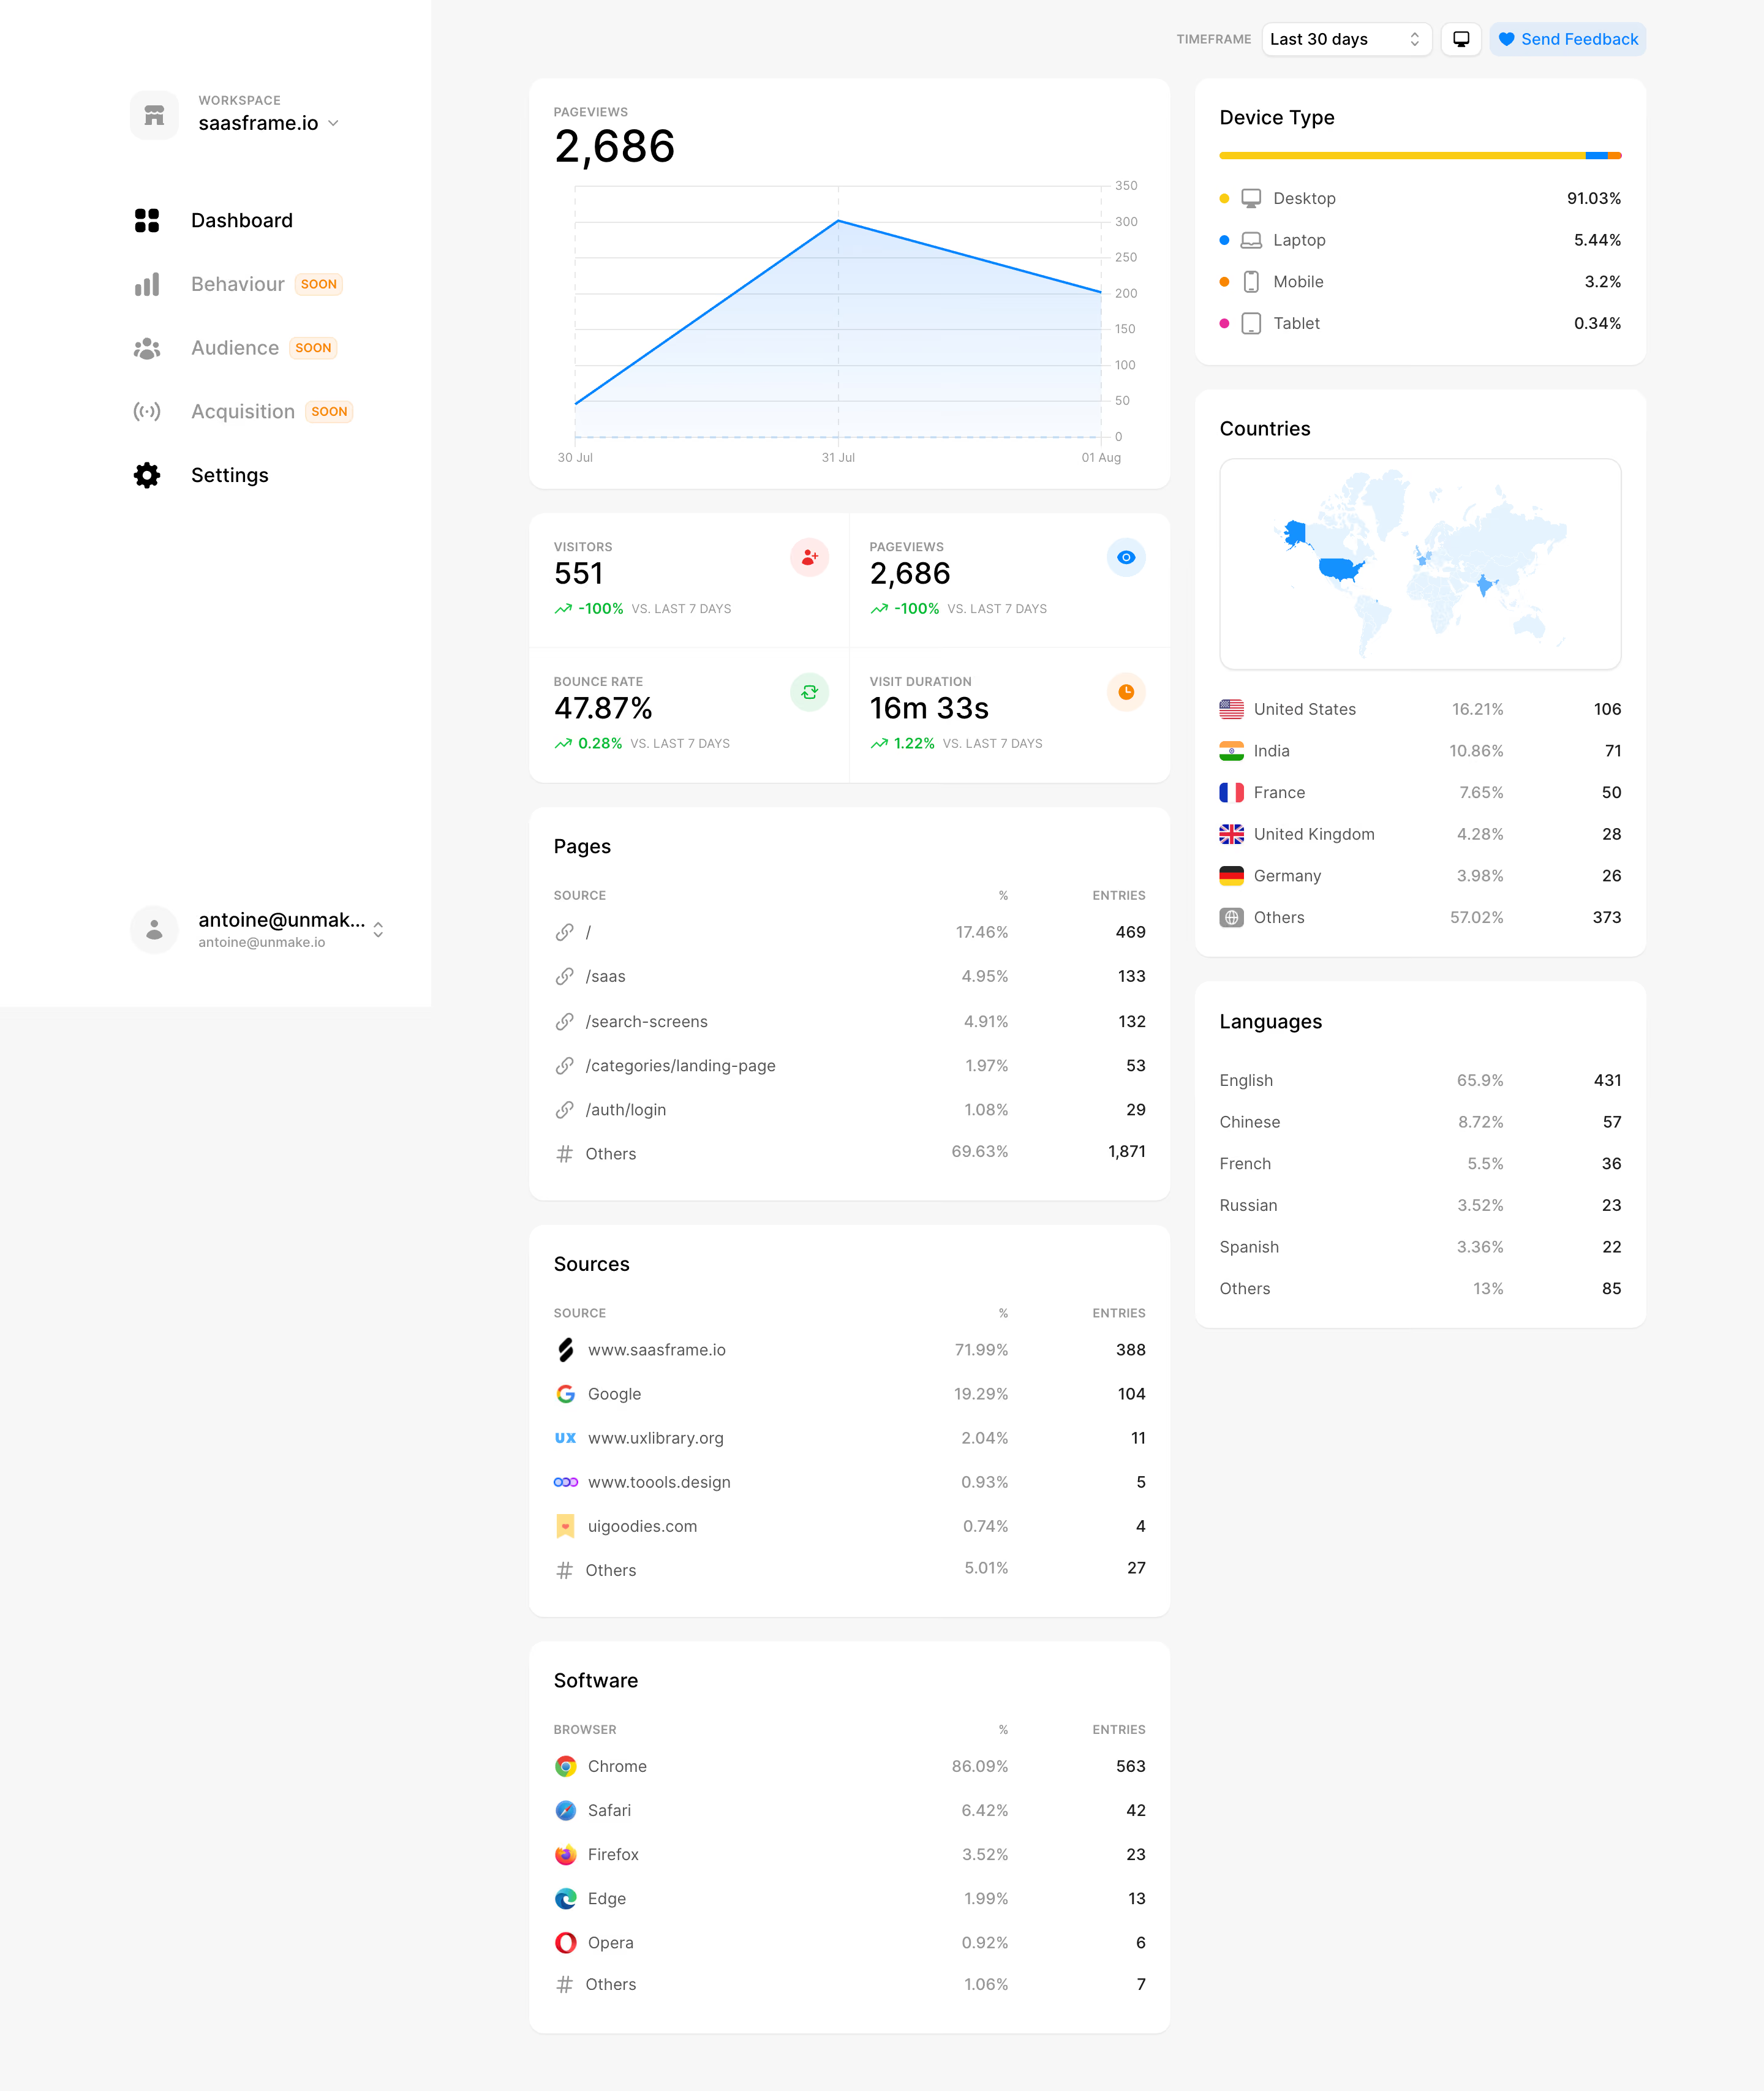
- **Style:** Light analytics dashboard with white rounded cards, gray canvas, blue chart accents, and small semantic colors.
### Page composition
- **Canvas:** 2880 × 3414 image px; CSS estimates assume an unverified 2× capture.
- **Sidebar:** Wide white navigation with workspace/account selectors.
- **Main grid:** Broad left column and narrower right column.
- **Left:** Pageviews area chart, four-metric grid, Pages, Sources, Software.
- **Right:** Device distribution, Countries map/list, Languages.
- **Top:** Timeframe selector, display icon, and feedback action.
### Information hierarchy
- **Primary:** Pageviews value and chart.
- **Secondary:** Four KPI values with green trend annotations.
- **Breakdowns:** Ranked tables and geographic/device cards.
- **Navigation:** Dashboard active; future sections carry small Soon badges.
### Typography
- **Family:** Neutral sans serif; exact family unverified.
- **KPI values:** Approximately 28–36 CSS px.
- **Card titles:** Approximately 16–18px.
- **Body/list:** Approximately 14px.
- **Micro-labels:** Approximately 10–12px uppercase.
- **Precision:** Values and scale are estimates.
### Colors & surfaces
- **Cards/sidebar:** #FFFFFF.
- **Canvas:** #F7F7F7.
- **Map/chart tints:** #E2F4FF and #F2F8FF.
- **Muted text:** #969696.
- **Primary text:** #000000.
- **Accents:** Blue area line, green trends, yellow device bar, small pink/orange icons.
- **Precision:** Sampled flat surfaces; exact accent tokens unverified.
### Components
- **Cards:** Approximately 14px radius, subtle outline, generous 20px padding.
- **Area chart:** Blue line/fill with pale horizontal grid.
- **KPI grid:** Two-by-two cells with fine dividers and circular semantic icons.
- **Countries:** Pale map image above flag/rank list.
- **Tables:** Source/name left, percentage/count right; no heavy row borders.
- **Device card:** Thin multicolor horizontal bar and icon legend.
### Visual rhythm
- **Rhythm:** Consistent card gaps around 20px under assumed 2×.
- **Alignment:** Metrics and counts form clear right-aligned columns.
- **Density:** Large chart balances compact ranked lists.
- **Color:** Neutral structure lets data accents carry meaning.
### Responsive
- **Observed:** Desktop only.
- **Recommendation:** Collapse sidebar and stack columns; keep breakdown labels tied to values.
- **Chart:** Reduce tick count while preserving readable data.
### Adaptation guidance
- **Preserve:** Overview-to-breakdown hierarchy and clean card system.
- **Data:** Use actual supplied metrics, geography, and sources; omit personal account details.
- **Behavior:** Filtering, chart hover, and future features are not demonstrated.
Use this context to reproduce the reference's visual language: layout, typography, colors, spacing, borders, radii, and distinctive elements. The screenshot takes priority if descriptions conflict.
## Direction
{{preferences.fidelityInstructions}}
## Output
{{output.instructions}}
Deliver a polished, cohesive design with precise alignment, hierarchy, and spacing. Produce the requested visual artifact, not just a description. If unsupported, explain the limitation.