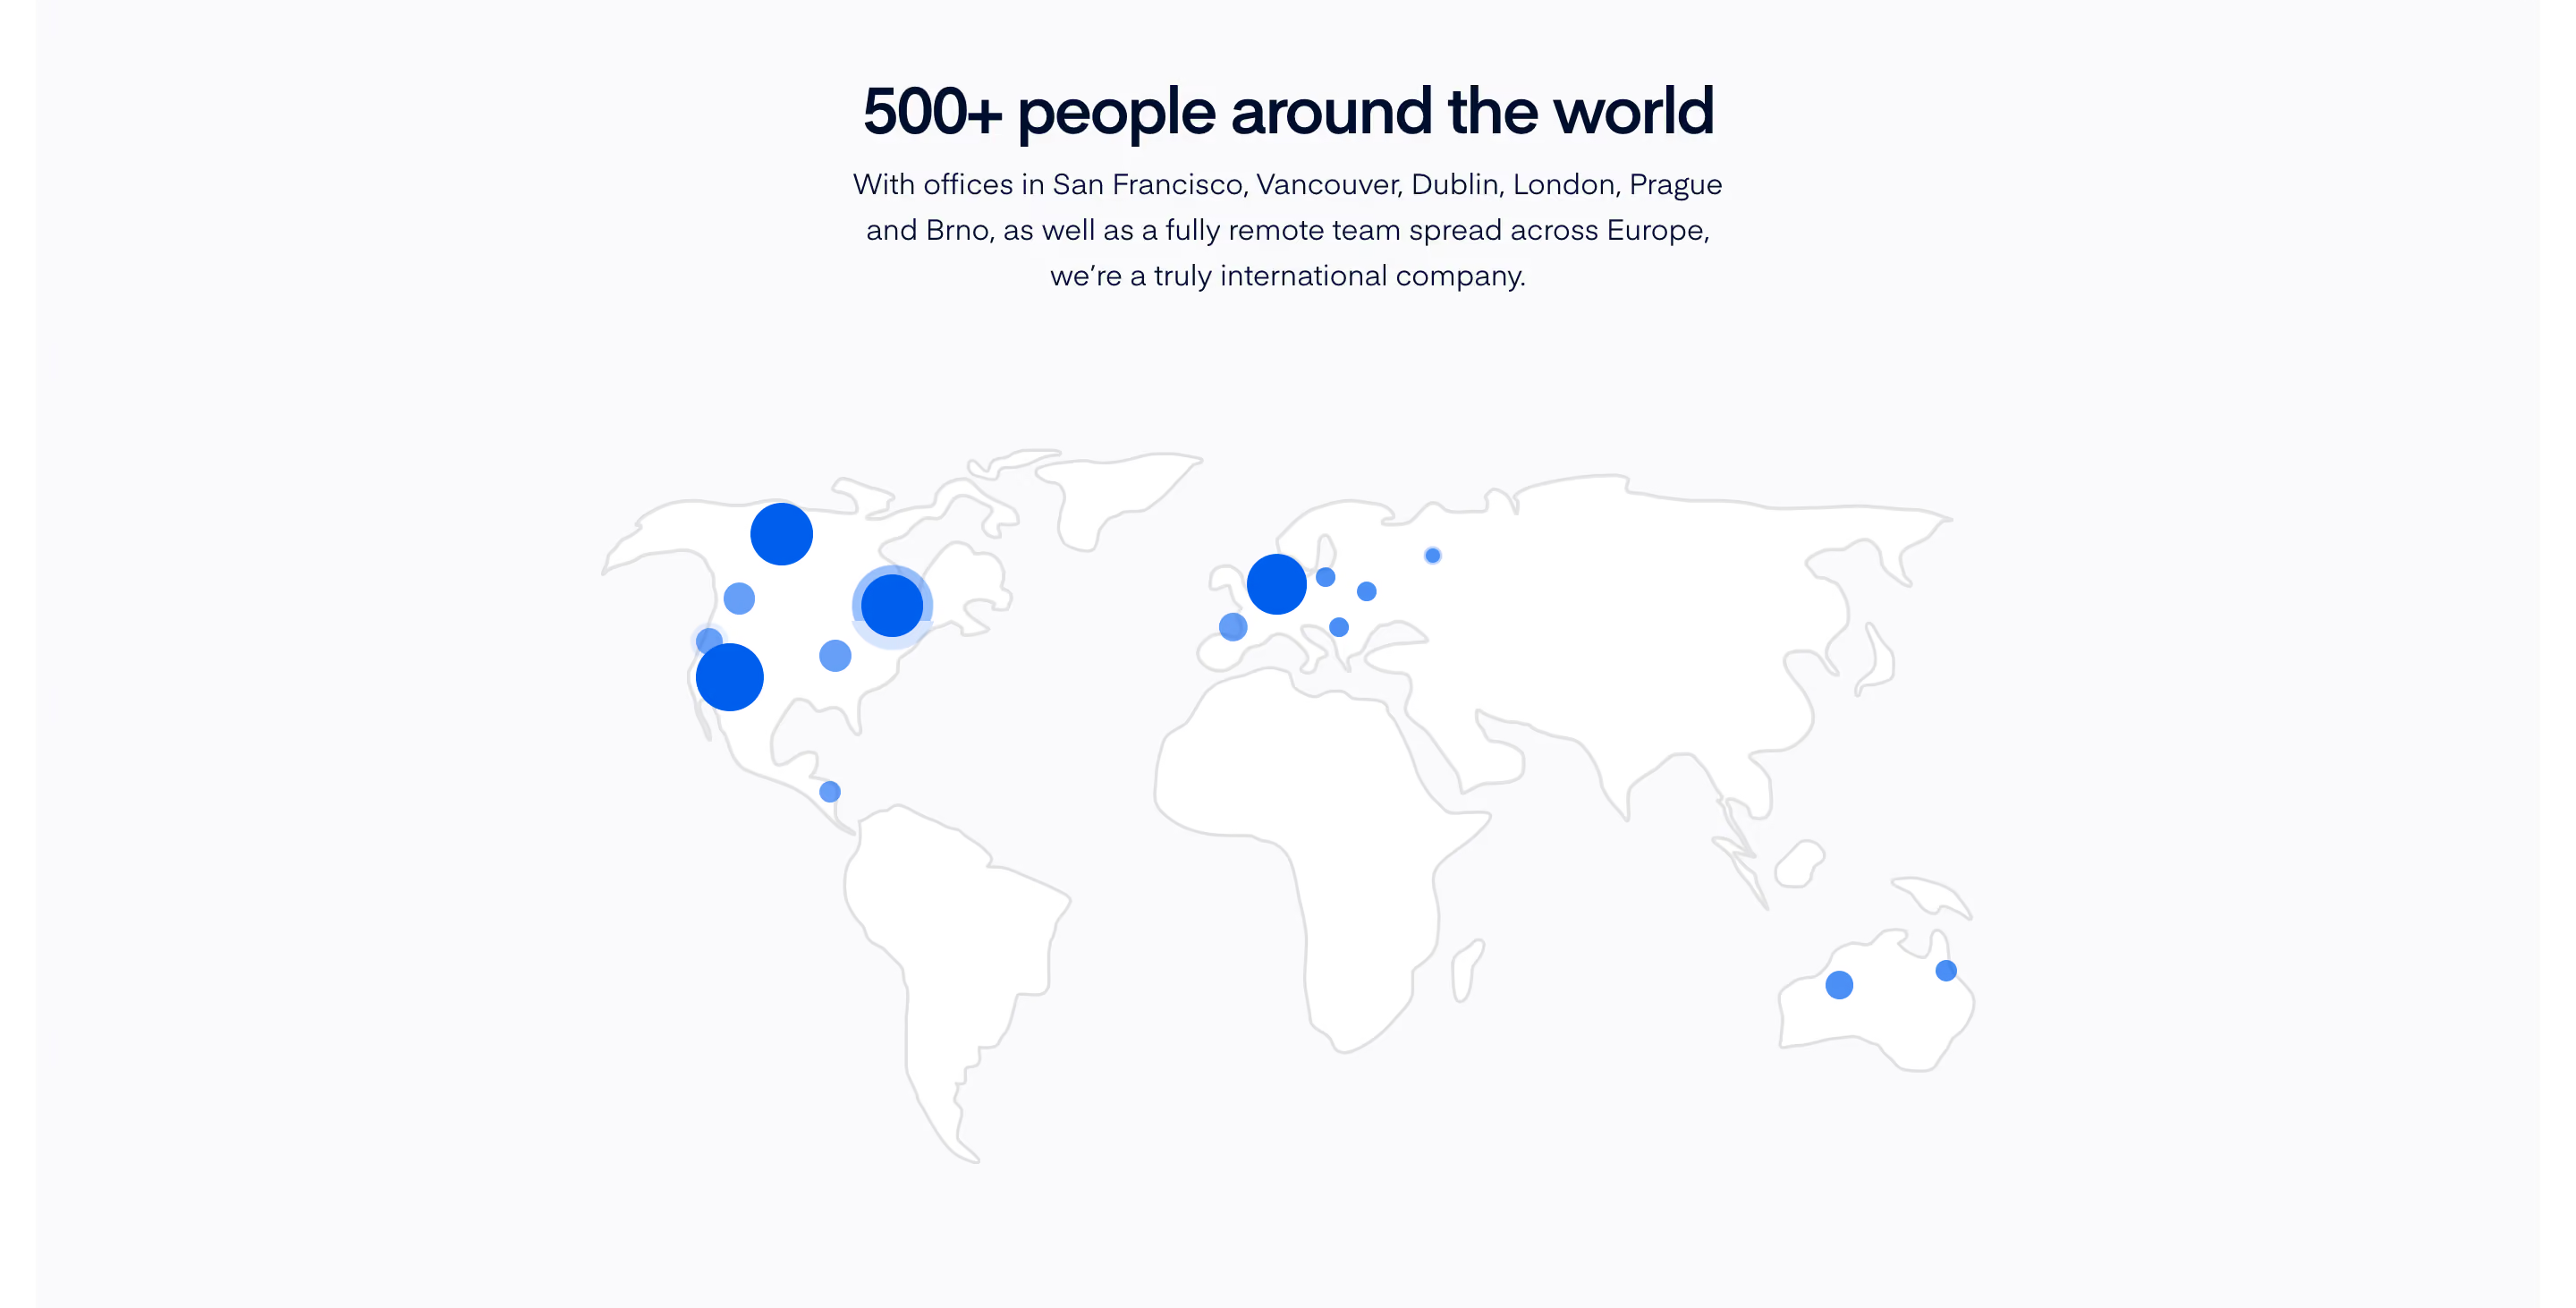
Map
11
An interactive or static map used to show locations, geographic data, distribution, routes, or spatial context in marketing and product interfaces.

A map section uses geography to explain a product, organization, or dataset. On SaaS websites it may communicate distributed teams, international coverage, activity locations, or an office destination. The pattern works when position answers a real question and the surrounding text explains what the marks represent.
This guide focuses on geography presented in a website section. A map used inside an operational product may need a much richer interaction model. Even for a marketing section, distinguish an illustrative world view from a precise location tool: the two should not make the same promise.
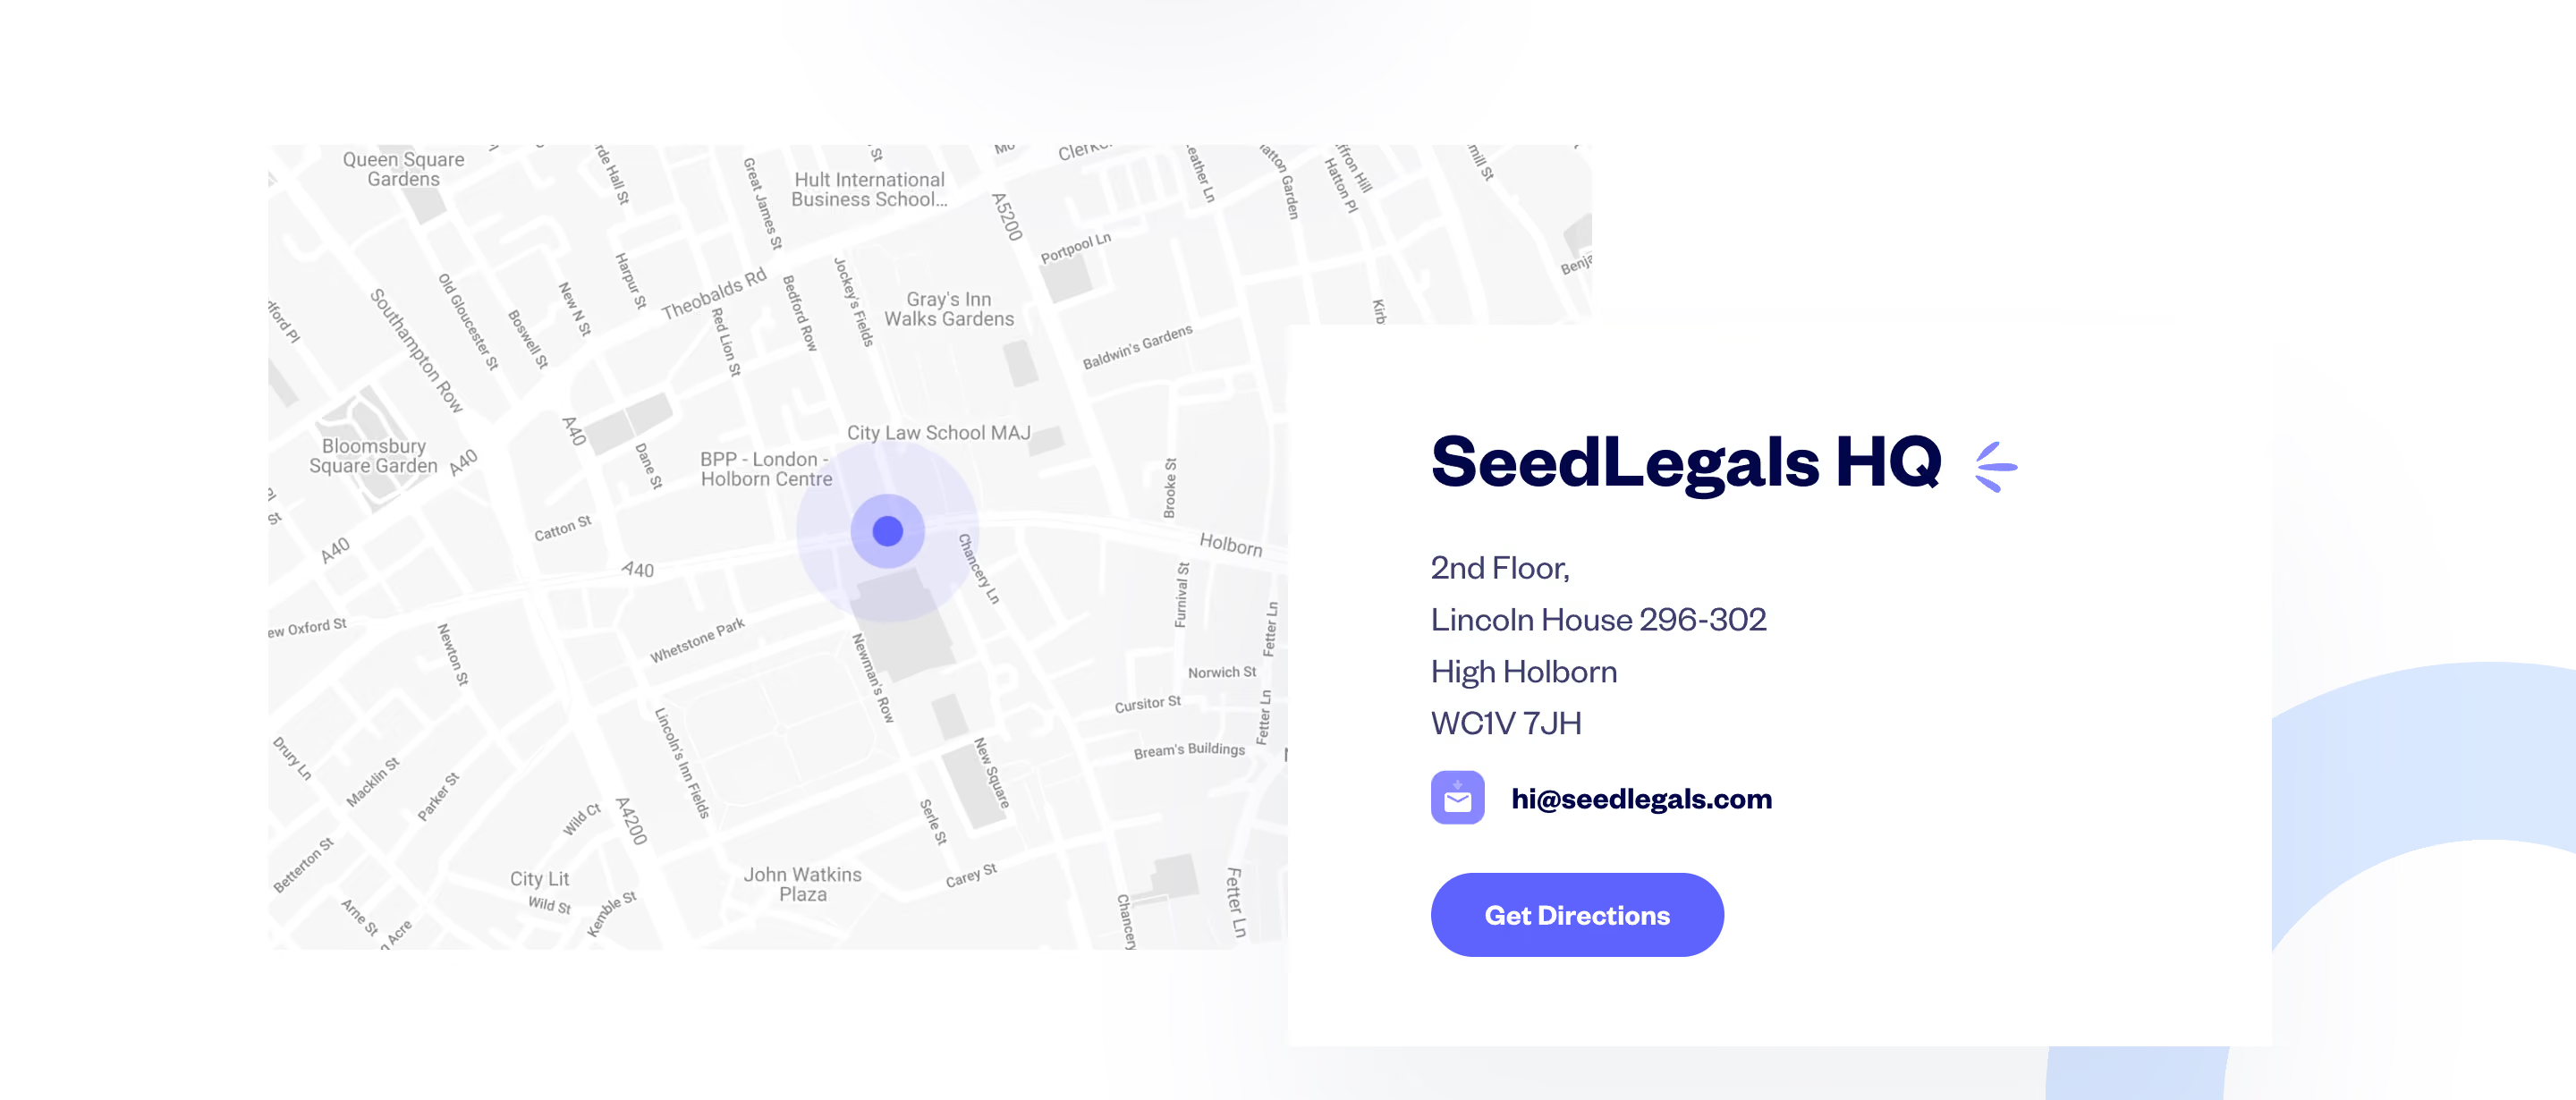
Ask why a map is more useful than a list or sentence. A distributed-team story can benefit from a view of locations across continents. An activity overview can benefit from spatial patterns. A single office address may need directions rather than a dramatic global illustration.
Choose the scale according to that purpose. A world map cannot explain the entrance to a building. A street map cannot show a broad international footprint efficiently. Avoid selecting a globe simply because it looks more expressive than the information requires.
Keep the claim specific. Marks can represent people, offices, customers, service availability, or measured activity. These meanings are not interchangeable. Explain the relationship before visitors infer that every highlighted country is a place where the product is available.
The Visitors capture centers a globe with colored markers and numbered clusters. A dark overlay summarizes pages, referrers, and countries. Persistent text above frames the image as visitor activity, while supporting labels below describe different aspects of the presented visualization.

The composition ties the geography to a dataset and provides non-geographic context nearby. The still image does not verify live updates, rotation, zoom, visitor identification, or measurement accuracy. It demonstrates how the captured page presents the concept, not a tested account of the product's technical behavior.
When adapting an activity map, explain what a marker and cluster count mean. A count might represent visitors, sessions, events, or records. Without that definition, an attractive visualization can leave people comparing numbers that do not mean what they assume.
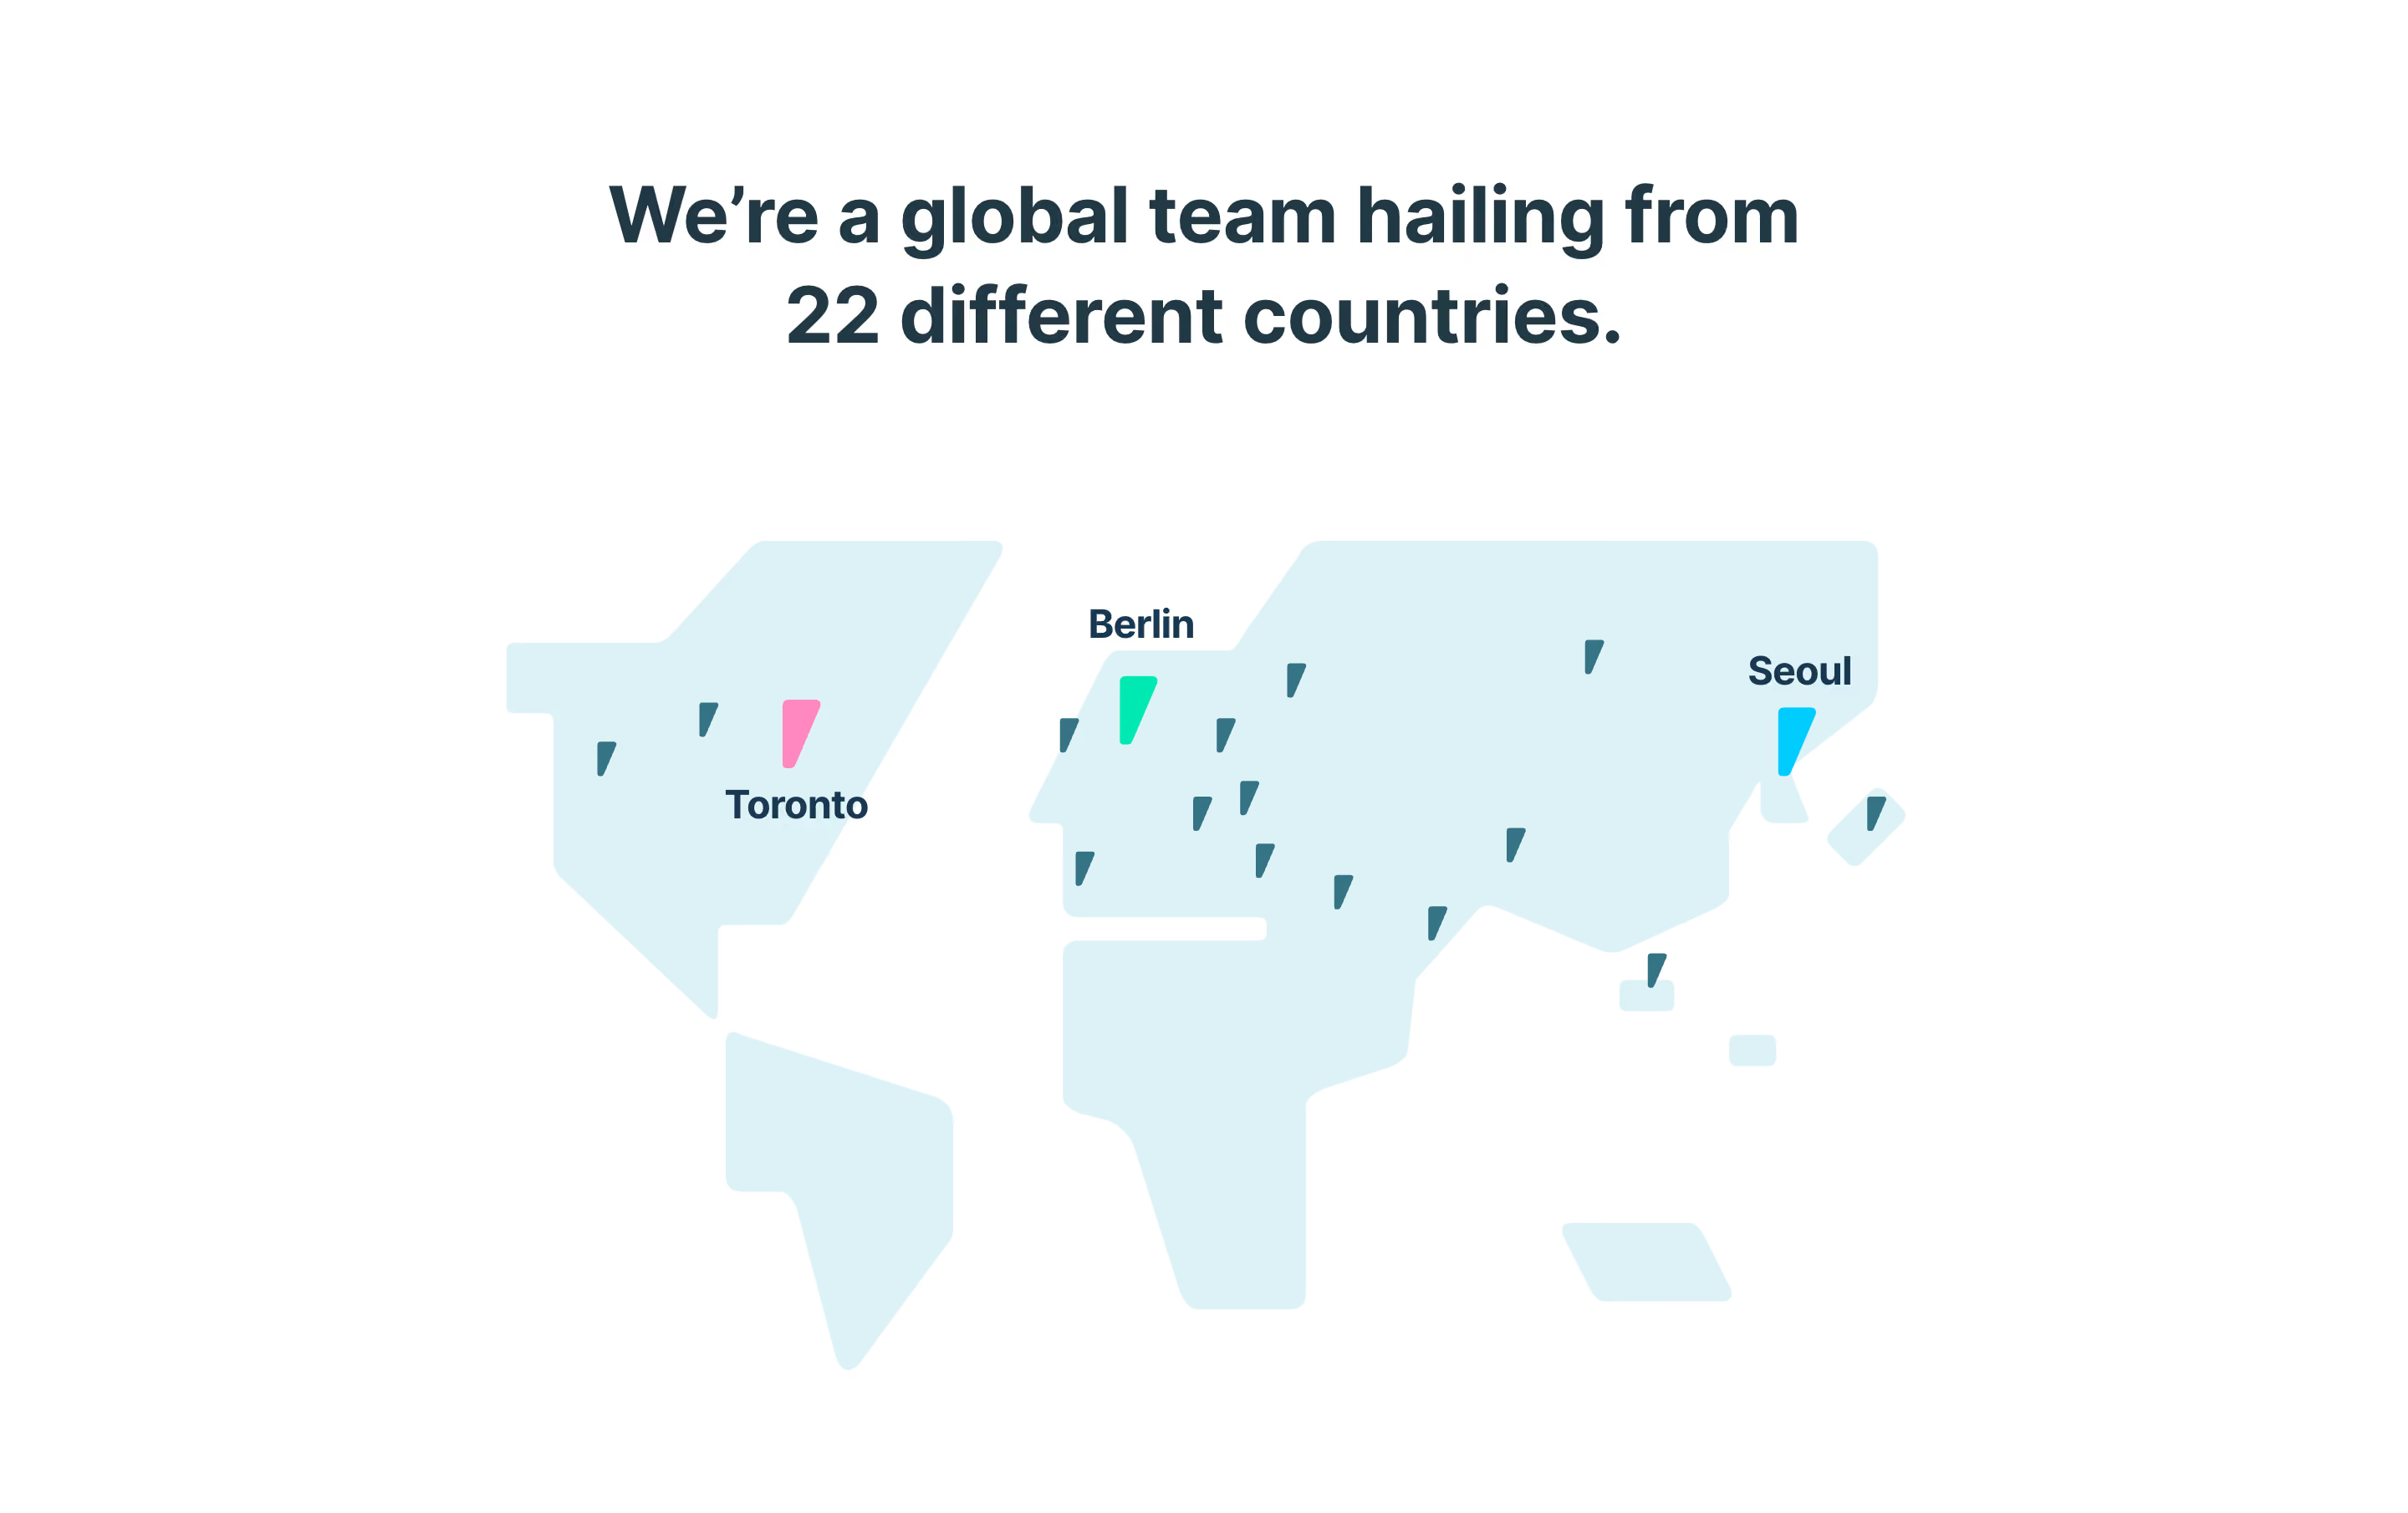
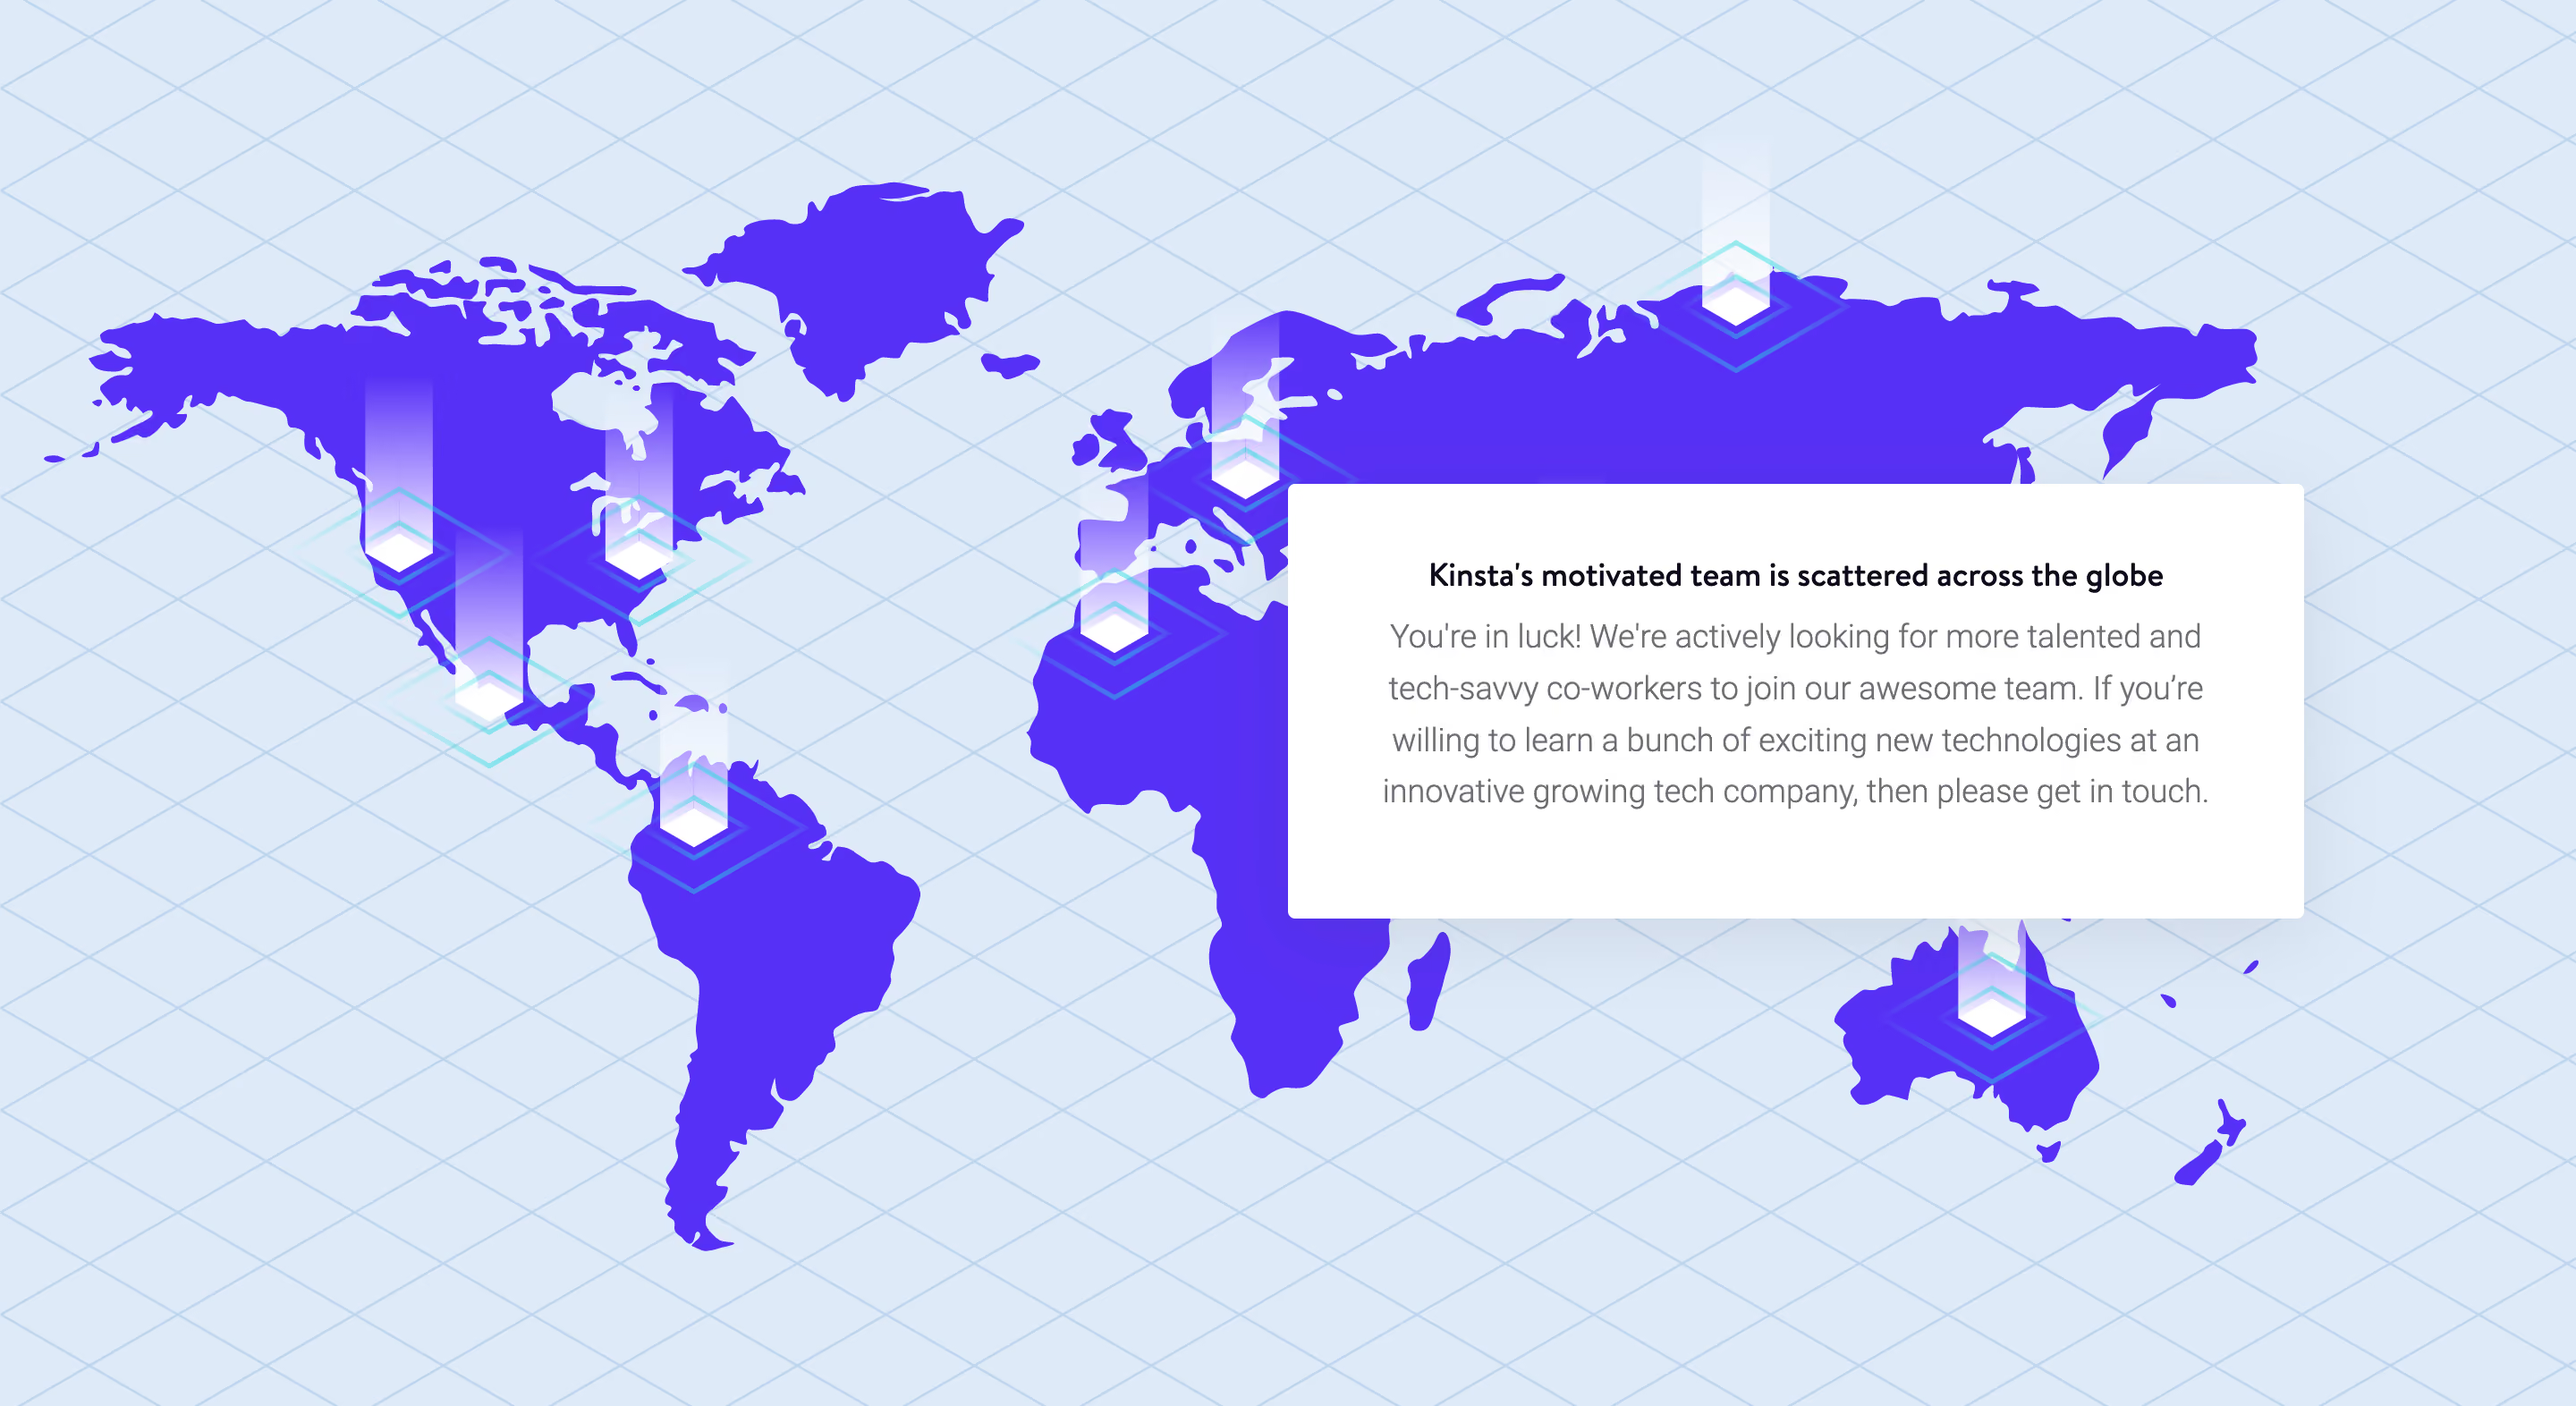
The Kinsta capture shows a stylized world map with raised-looking location markers and a text panel about a distributed team. The map supports a company narrative rather than displaying a detailed geographic dataset. The panel gives the visual a clear interpretive frame.
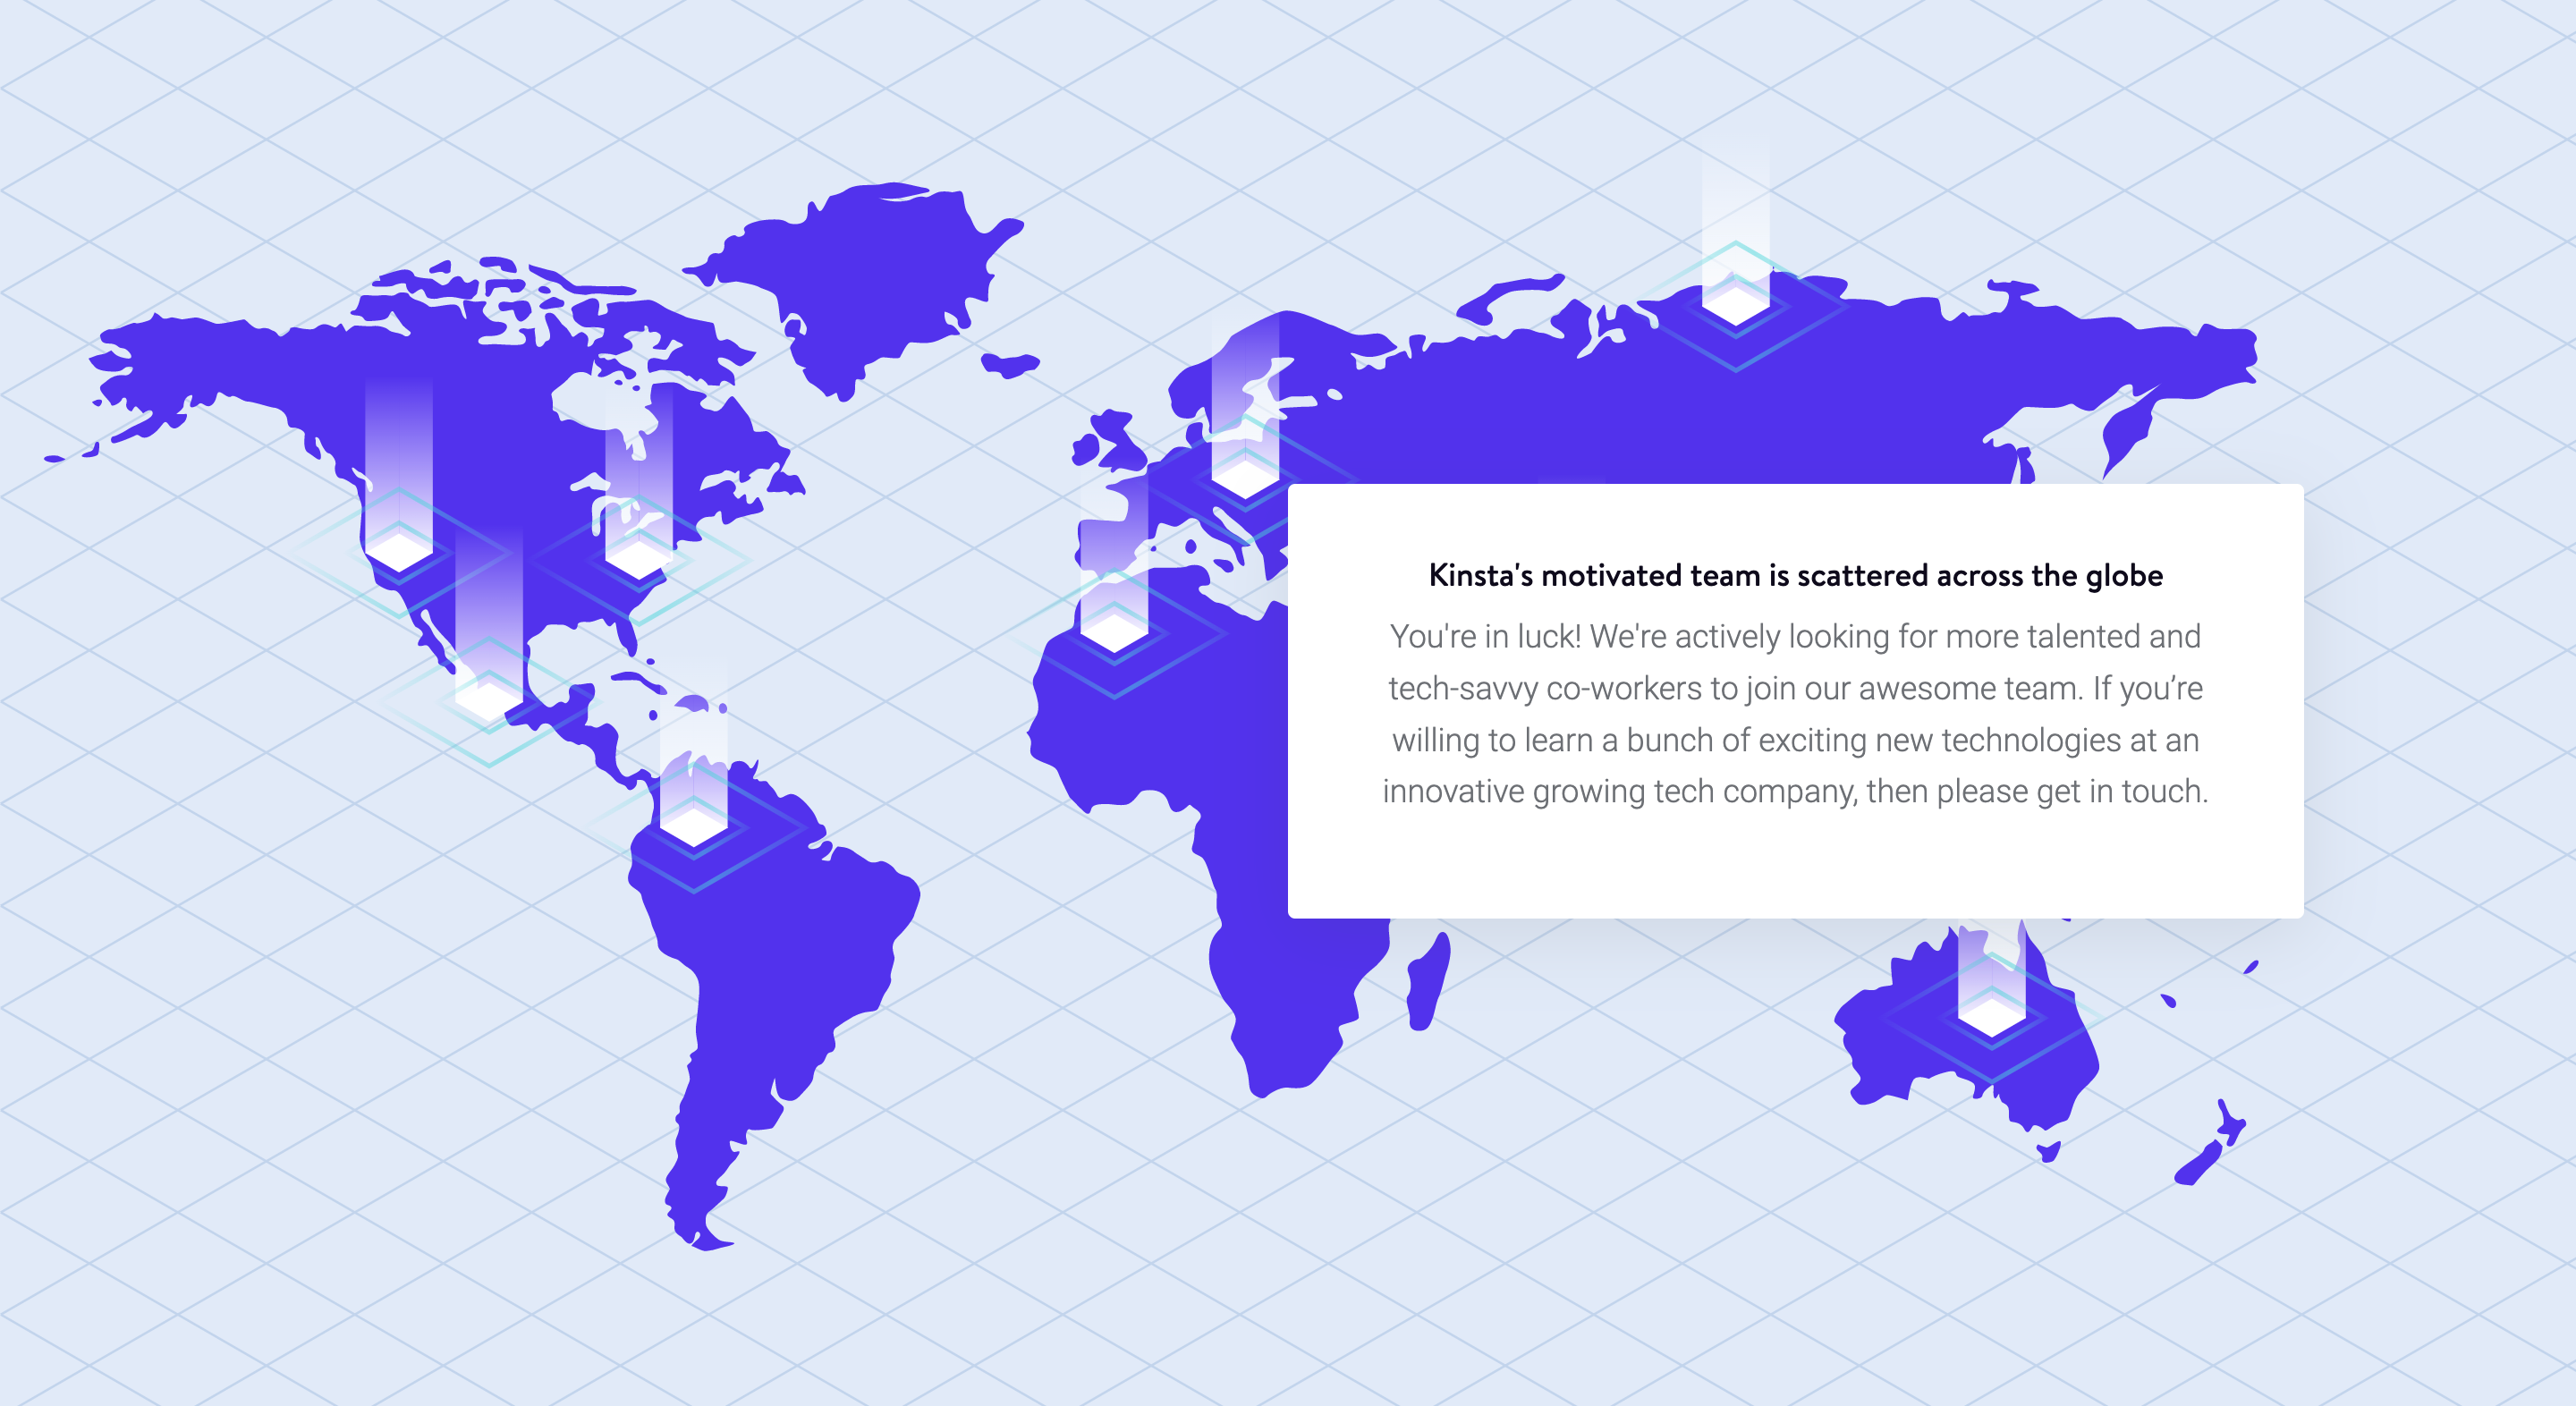
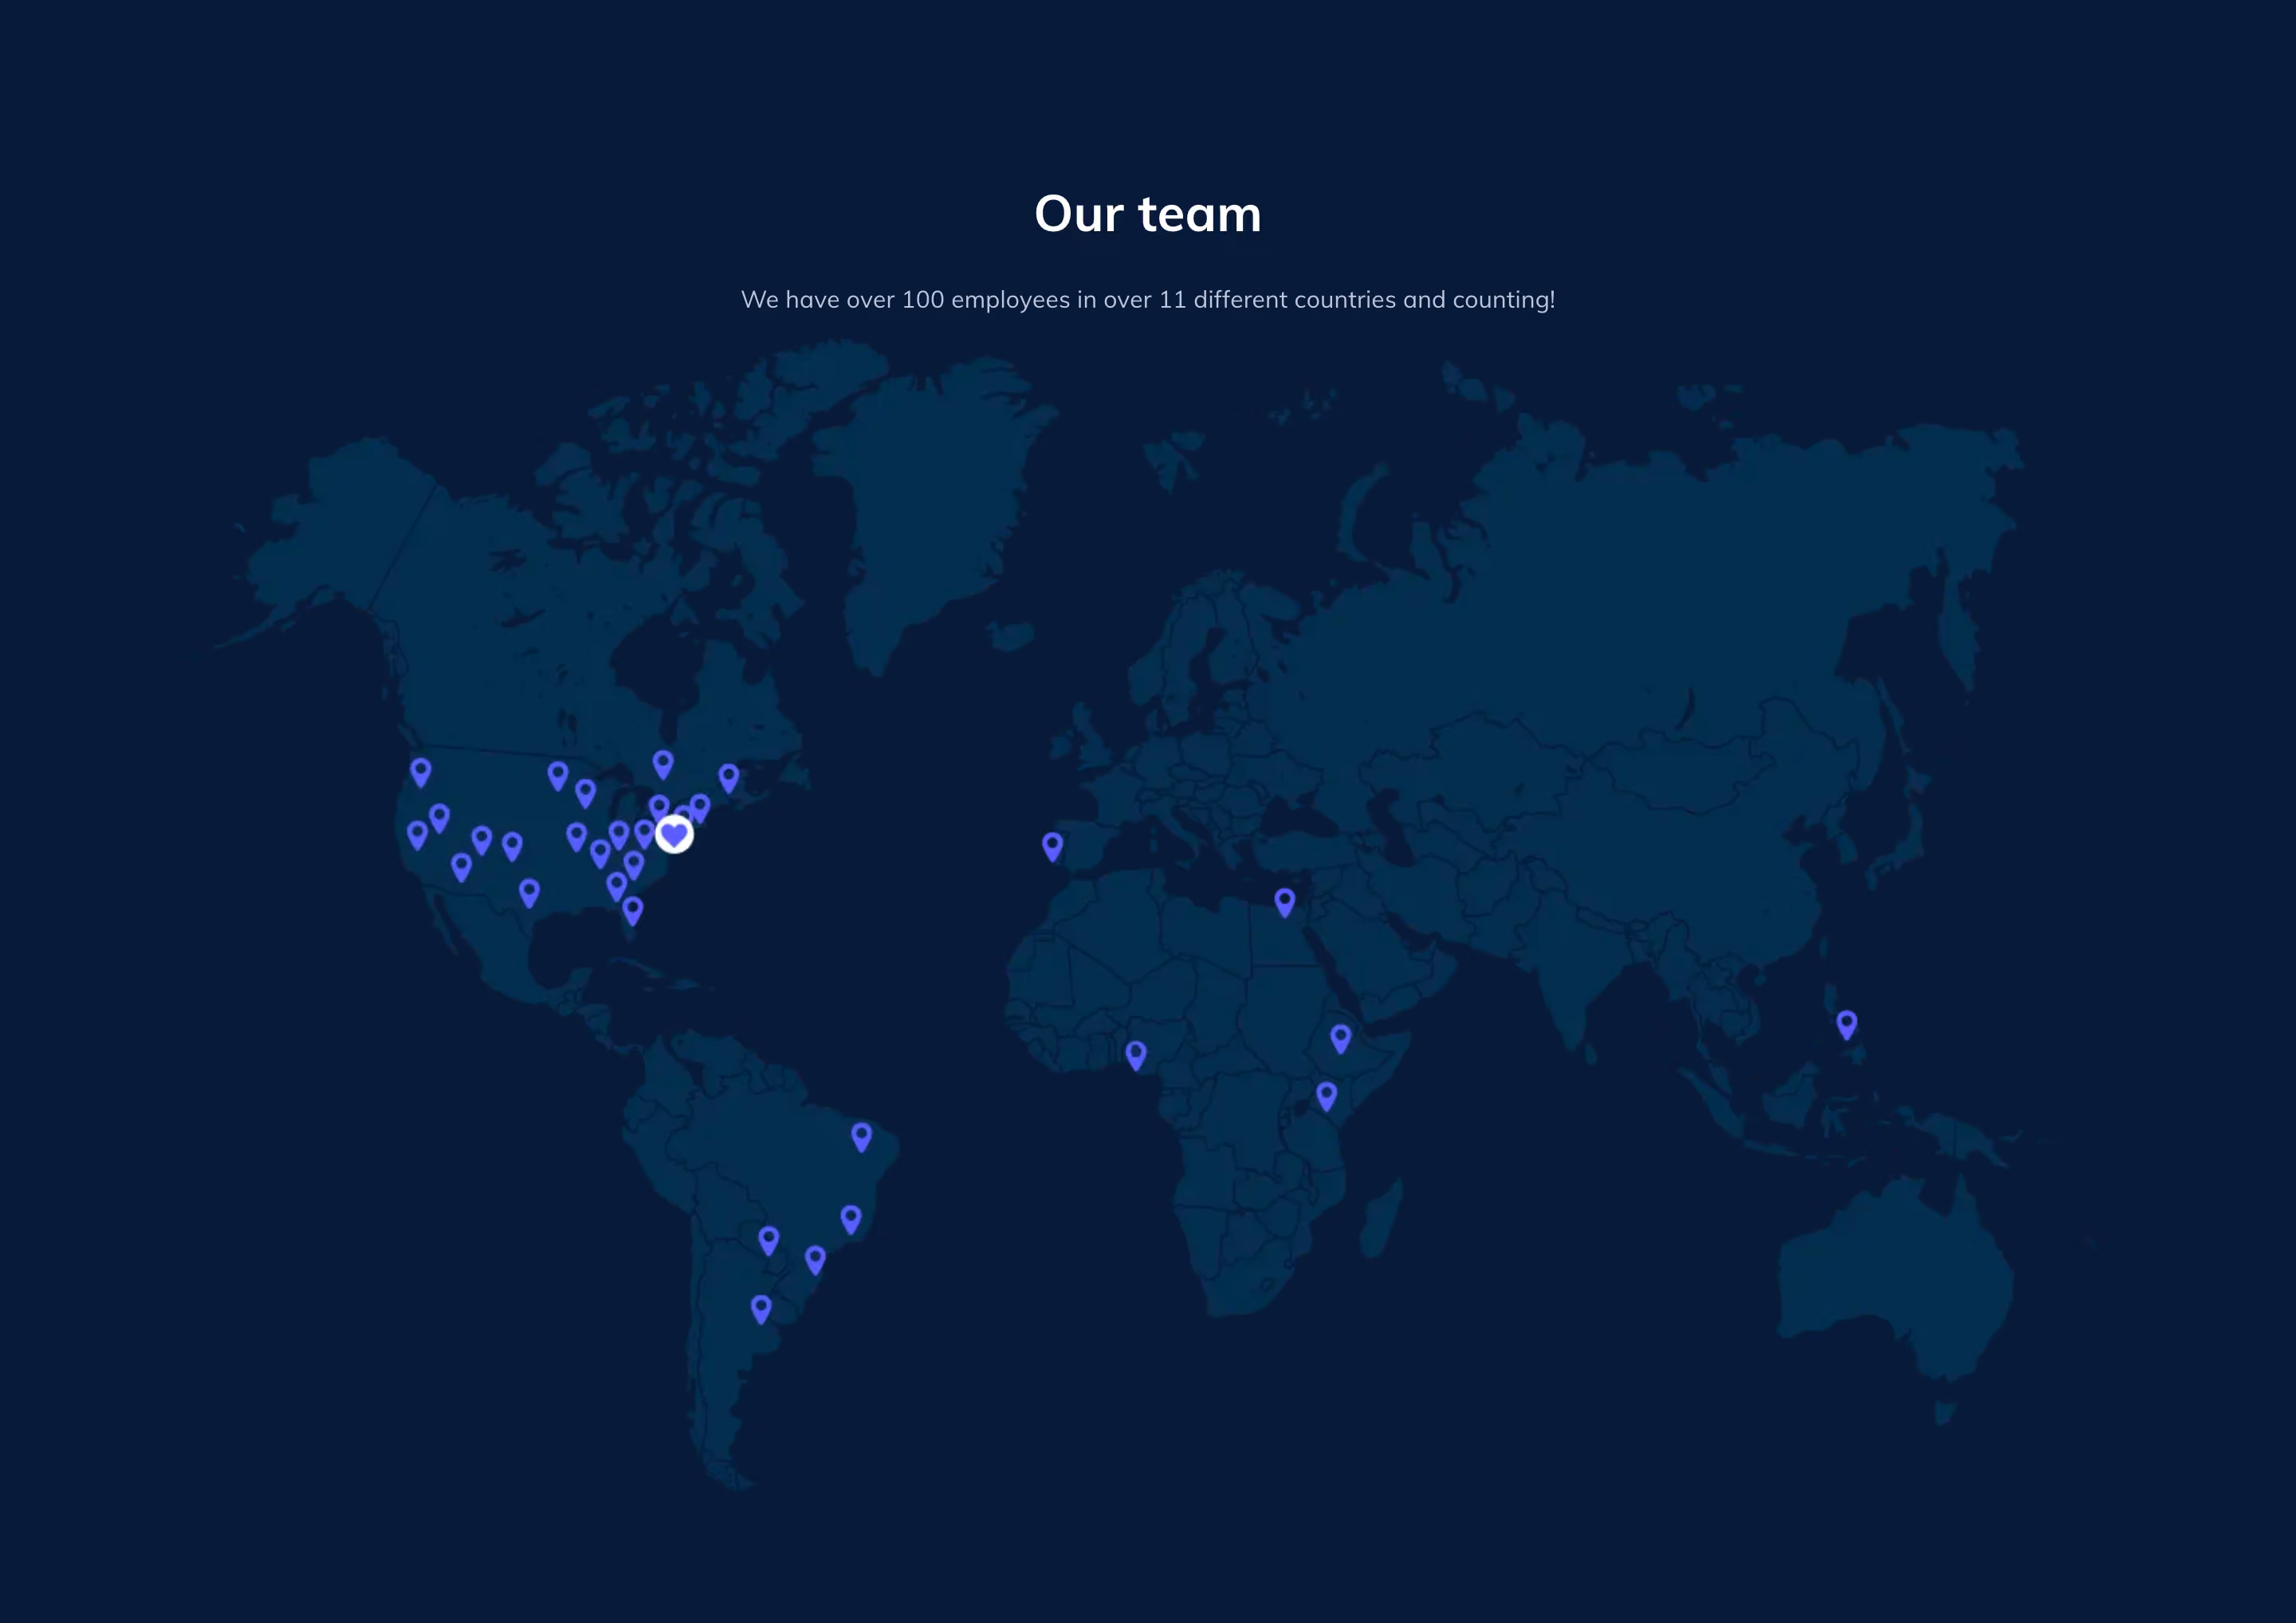
The map is useful as a broad illustration of geographic distribution. Its styling should not be read as exact staffing counts or current office locations. The historical copy and marker positions in the screenshot are not verified present-day facts about the organization.
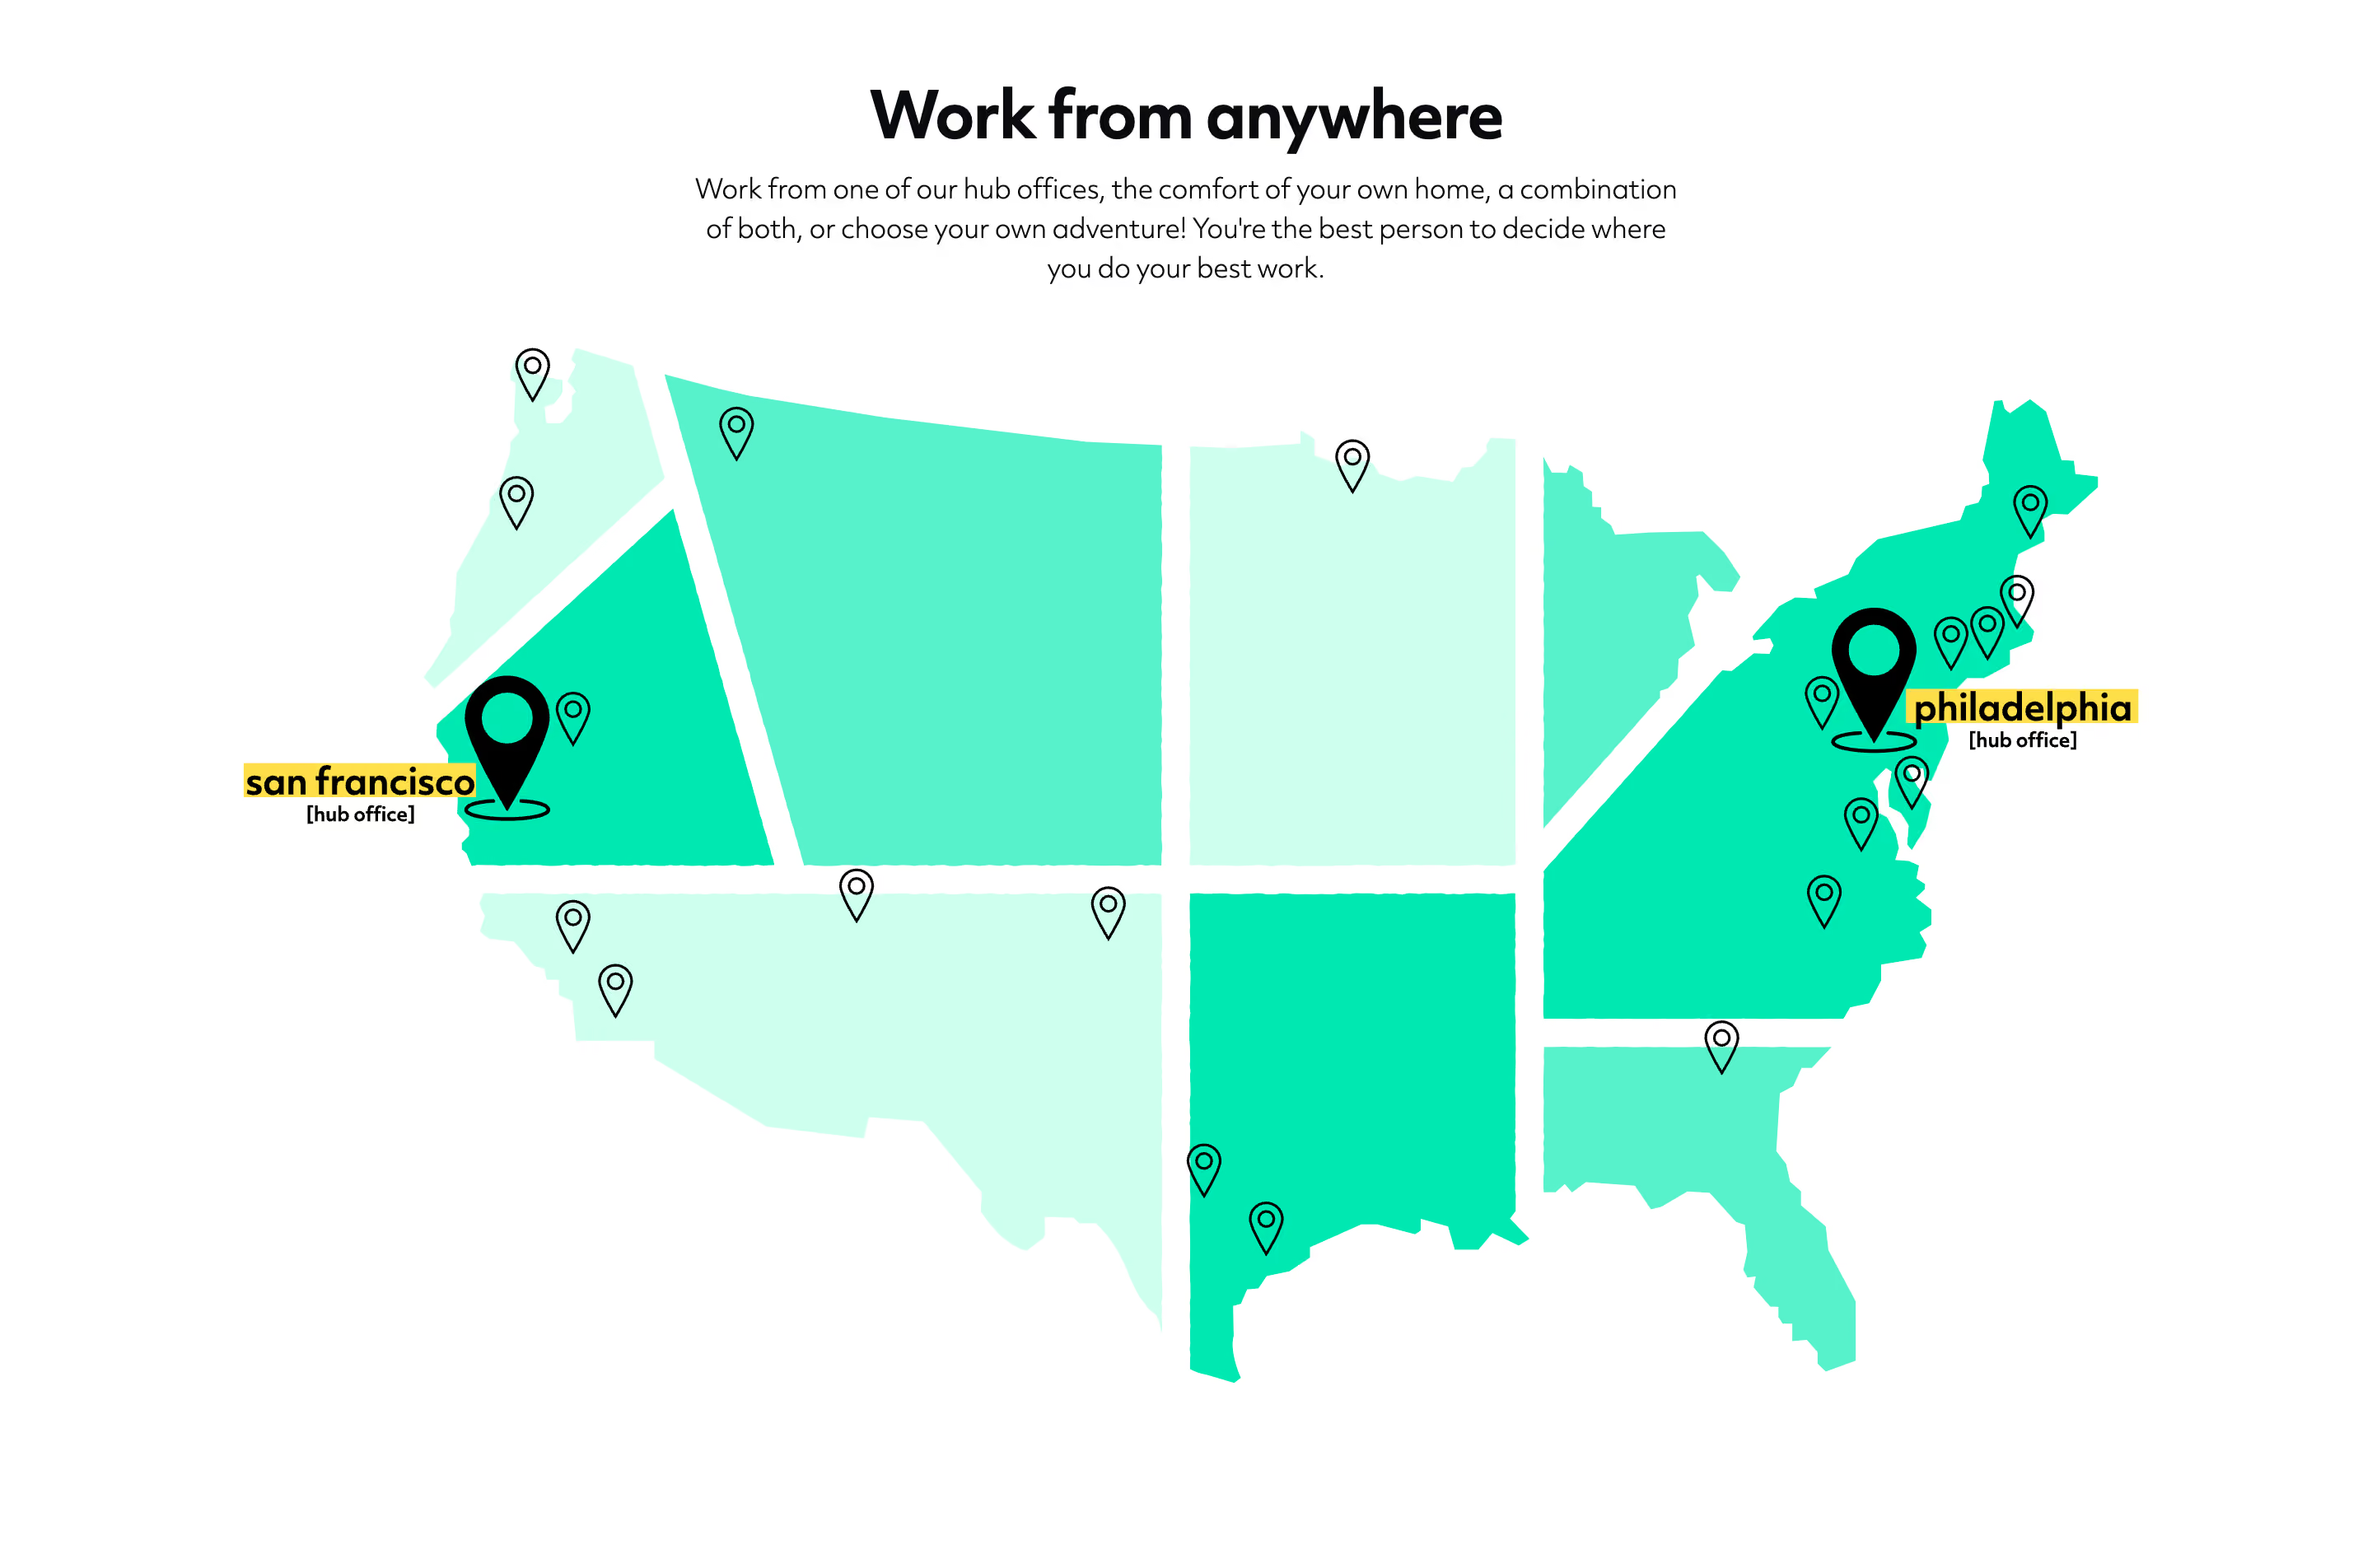
For a new page, decide how precise the illustration needs to be. If markers are schematic, avoid labels that imply survey-level accuracy. If the section describes actual locations, maintain an authoritative list and ensure the map agrees with it. A stylized treatment can communicate breadth without pretending to be a navigation tool.
A map needs a readable account of its visual encoding. Explain whether size indicates volume, color indicates category, or a number indicates a cluster. A visible legend can be helpful when the distinction affects interpretation; simple text may suffice for a small illustrative set.
Make missing data distinguishable from zero activity or unsupported coverage. An unmarked region may mean there are no records, records are unavailable, or the section intentionally shows only selected locations. Do not let the visual quietly choose among those meanings.
Avoid relying on color alone to identify categories. Pair meaningful colors with labels, shapes, or another understandable distinction. Keep labels legible against the map background, and do not make the most important information depend on a tiny marker someone must inspect precisely.
Maps can be difficult to scan for a specific country or location. A companion list, summary, or directory helps visitors who know what they are looking for. It also preserves usefulness when the visual cannot be loaded or operated.
For coverage information, a country list can answer eligibility more directly than a world illustration. For office information, an address and directions link can support planning. For activity data, a summary by region can make the main pattern understandable without rotating a globe.
The alternative should reflect the same dataset and scope. A map with selected examples beside a list presented as complete can create confusion. Label the difference if the visual is curated while the list is exhaustive.
Zooming, panning, filtering, or selecting markers should help visitors inspect information they need. They should not be added only because the map library supports them. A static illustrative section may be sufficient when the purpose is to communicate a broad company story.
If markers open details, make selection practical and keep the selected state recognizable. Explain the content of a cluster before expecting someone to activate it. Preserve a clear way to return to the overall view after exploring a location.
Avoid trapping the page scroll in the map unexpectedly. A visitor trying to move down the page should not lose orientation because the map captures the gesture without a clear interaction context. Test touch, pointer, and keyboard use separately from the visual composition.
An activity map may represent a moment, a time range, or accumulated records. A team map may describe a historical snapshot. A coverage map may change as the service expands. Make the relevant time context visible when it affects the claim.
If the map updates, distinguish new activity from a changing aggregate. Motion can attract attention but should not obscure the meaning of the counts. If updates pause or data becomes unavailable, make that state understandable rather than leaving a frozen display that still appears live.
Assign ownership for static geography as well. A beautiful illustration can become inaccurate after an office move or a change in service availability. The maintenance process should cover text, lists, markers, and destination links together.
Do not expose more precise location information than the explanation requires. A broad activity illustration may only need country or regional context. A public office destination may legitimately need a precise address. The interface should make the level of precision understandable.
If location is inferred or approximate, avoid presenting it as exact. A marker placed near a city can look definitive even when the underlying data supports only a wider region. Wording and visual scale should reflect that limitation.
When the dataset involves people, review the context and permissions that govern its display. This guide concerns presentation decisions, not a legal determination about collecting or publishing location data. Domain-specific requirements need their own appropriate review.
On a small screen, a world map may lose most of its labels. Consider a focused view, a concise summary, or a list rather than shrinking the desktop illustration until no marker is readable. Keep the persistent explanation visible near the visual.
Overlays should not cover the very areas visitors need to inspect. A summary panel that works on desktop may dominate the map on mobile. Test its placement, dismissal if available, and relationship to focused controls.
Provide readable text equivalents for the map's central message. If the visualization is informational, its important categories and values should be available in a usable form. If it is illustrative, alternative text should explain that illustration without pretending to enumerate precise data the image does not provide.
Ask visitors what the markers represent, which time period is shown, and whether unmarked locations mean unavailable coverage or simply absent records. Their answers reveal whether the map's visual promise matches its intended scope.
Check the underlying locations, legend, summaries, and links. For interactive maps, test selection, return to overview, unavailable data, keyboard access, and narrow layouts. Verify the information independently of the animation or styling.
Explore the SaaSFrame map-section collection to compare illustrative team maps and product-oriented geographic visualizations. Choose a reference whose purpose resembles your own, then make the meaning and precision of the geography explicit.
Review the map in context with the claim immediately before and after it. A global visual placed beside an availability promise can imply coverage even if its intended meaning is team distribution. A heading, legend, or explicit caption can prevent that ambiguity. Also check whether the map remains useful when someone enters the page through a search result and has not read the earlier explanation. The section should carry enough local context to be interpreted accurately on its own.
Does a map need to be interactive? No. Interaction is useful when it helps visitors answer a geographic question. A clearly framed illustration can serve a company story without offering unnecessary controls.
Can a map prove international availability? Only if its data and labeling actually describe availability. Team locations, visitor activity, and customer distribution are different kinds of geography.
What should appear when the map is unavailable? Preserve the meaningful explanation and an appropriate list, summary, or destination route. The visitor should still be able to understand the claim or complete the relevant task.