Generate a new design based on this screen using your own content.
Thank you! Your submission has been received!
Oops! Something went wrong while submitting the form.
# Design from Reference: Steep Report
Create an original, high-fidelity visual design inspired by the reference. Prioritize composition, typography, colors, spacing, and component styling over technical implementation.
## Reference
- **Product:** Steep
- **Category:** Text Editor
- **Screenshot:** https://cdn.prod.website-files.com/5e9dc792e1210c5325f7ebbc/6acad56f86f1bee9c3650743_6acad4983ce5f4104ebe1f03_cms-e5f008f6c401eb18e436a5f8.webp
Analyze the screenshot first. If inaccessible, request it rather than guessing.
## Content
{{content.instructions}}
{{content.data}}
Preserve essential messaging and factual accuracy. Adapt structure and copy length for visual balance; never invent product claims.
## Visual Design
Use this context to reproduce the reference's visual language: layout, typography, colors, spacing, borders, radii, and distinctive elements. The screenshot takes priority if descriptions conflict.
## Direction
{{preferences.fidelityInstructions}}
## Output
{{output.instructions}}
Deliver a polished, cohesive design with precise alignment, hierarchy, and spacing. Produce the requested visual artifact, not just a description. If unsupported, explain the limitation.
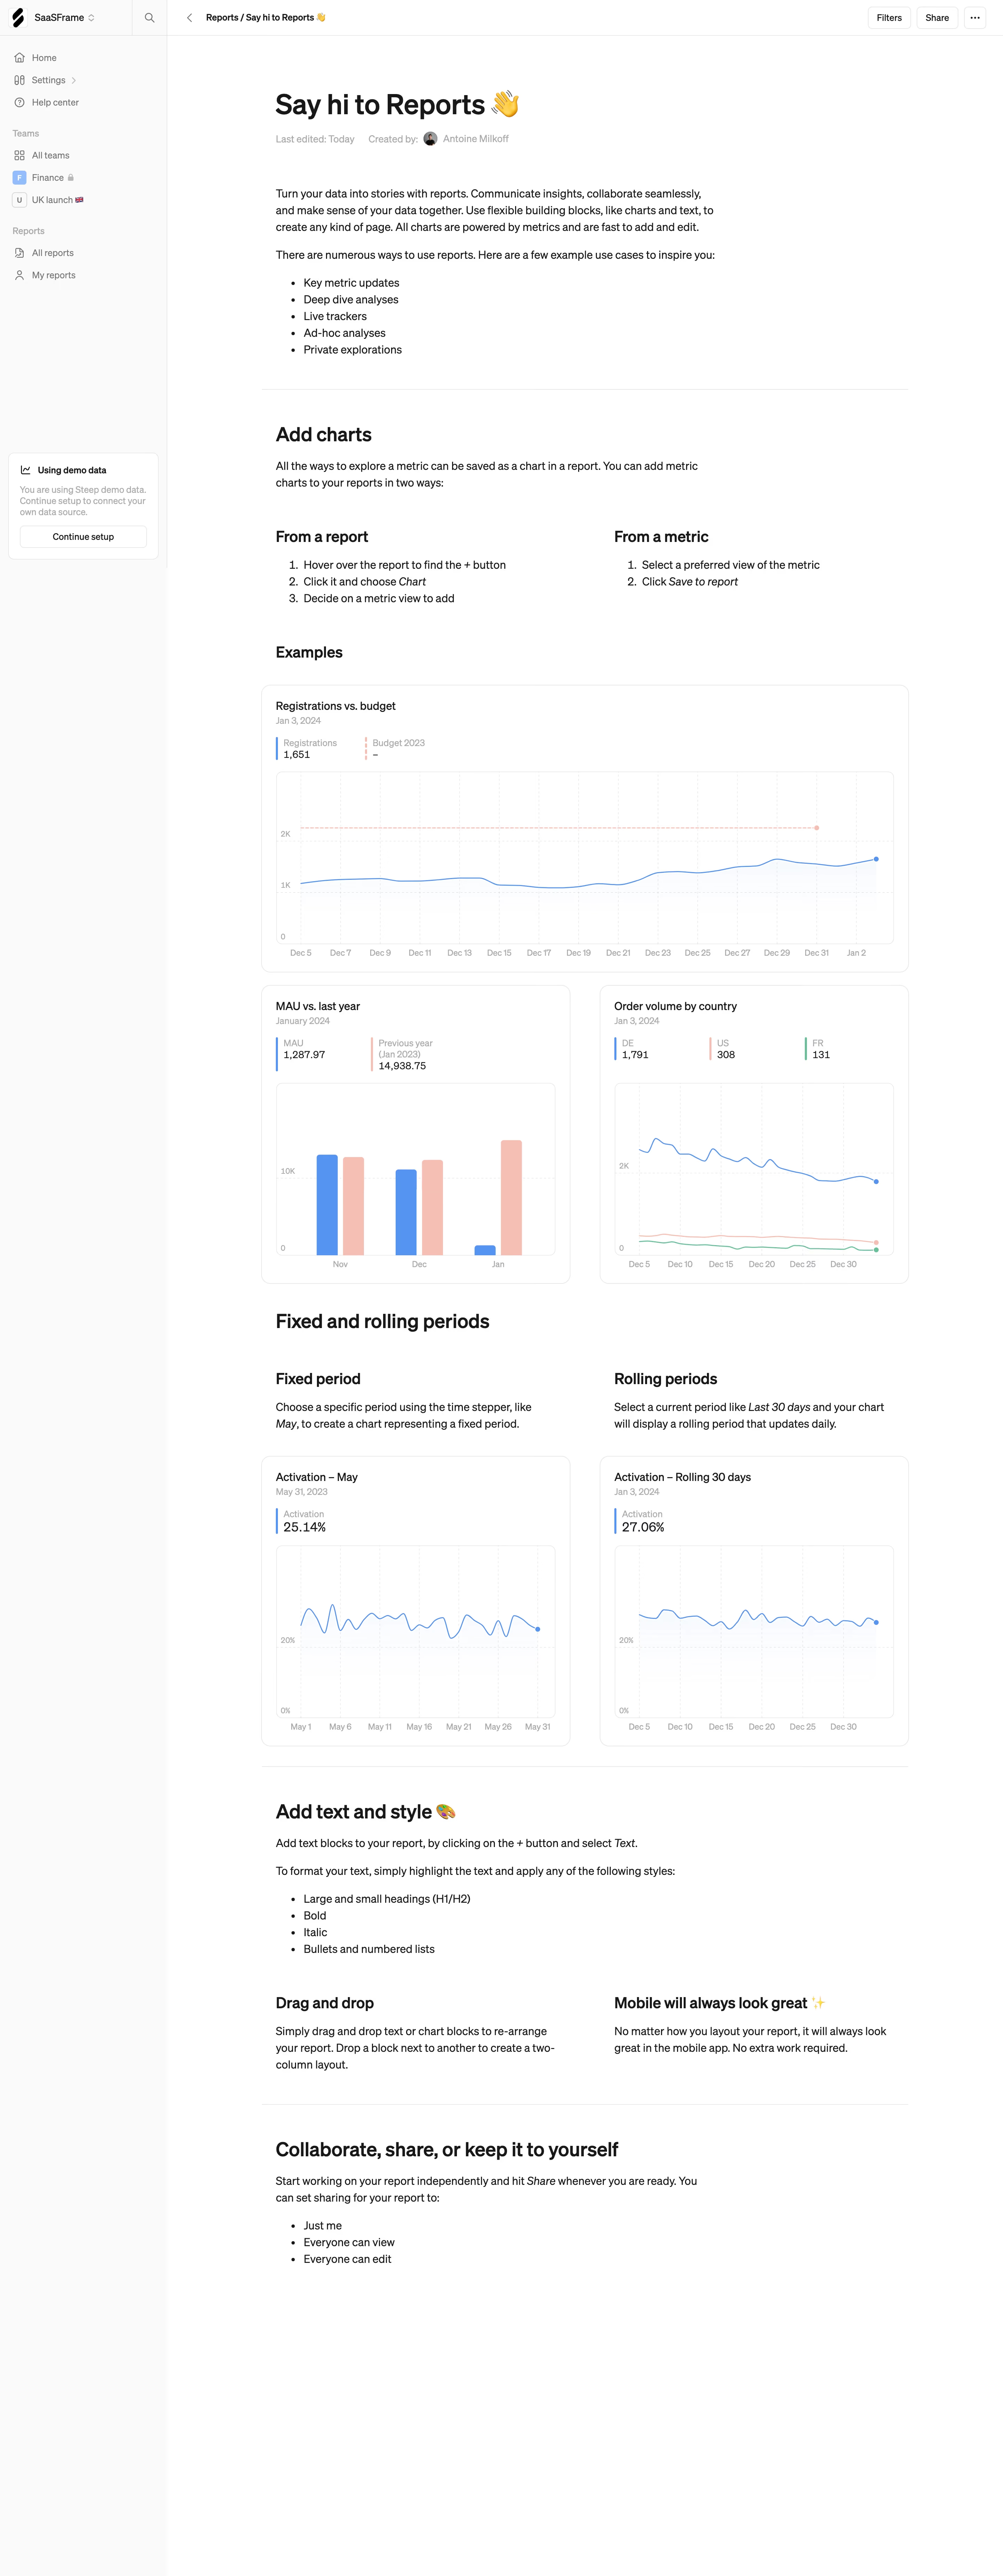
First thing you notice is the friendly tone. "Say hi to Reports 👋" immediately kills that sterile dashboard energy most SaaS tools default to. The page reads like a well-structured onboarding doc, walking you through features with real chart examples instead of abstract promises.
Layout does the heavy lifting
The two-column sections work well here. "From a report" vs "From a metric" sitting side by side makes comparison effortless. Same pattern repeats with fixed vs rolling periods below. The charts feel lived-in with actual data points like "1,651 registrations" and "25.14% activation." Nothing placeholder about it. The left sidebar stays minimal with clear grouping: teams, reports, and a subtle blue "Using demo data" nudge at the bottom.
Typography and restraint
Clean serif headings paired with a simple sans-serif body. The color palette is almost entirely monochrome with strategic pops of blue, orange, and red only inside the charts. That restraint keeps the dense content from feeling overwhelming. The emoji usage is surprisingly effective without being cringe.