
Thank you! Your submission has been received!
Oops! Something went wrong while submitting the form.
Get SaaSFrame Pro
Monthly
$18
Quarterly
$48
Yearly
$180
Upgrade to access this feature
Browse all screens & flows
Filter and search screens & flows
Access Figma files
Access mobile versions
Bookmark screens & flows
Join now
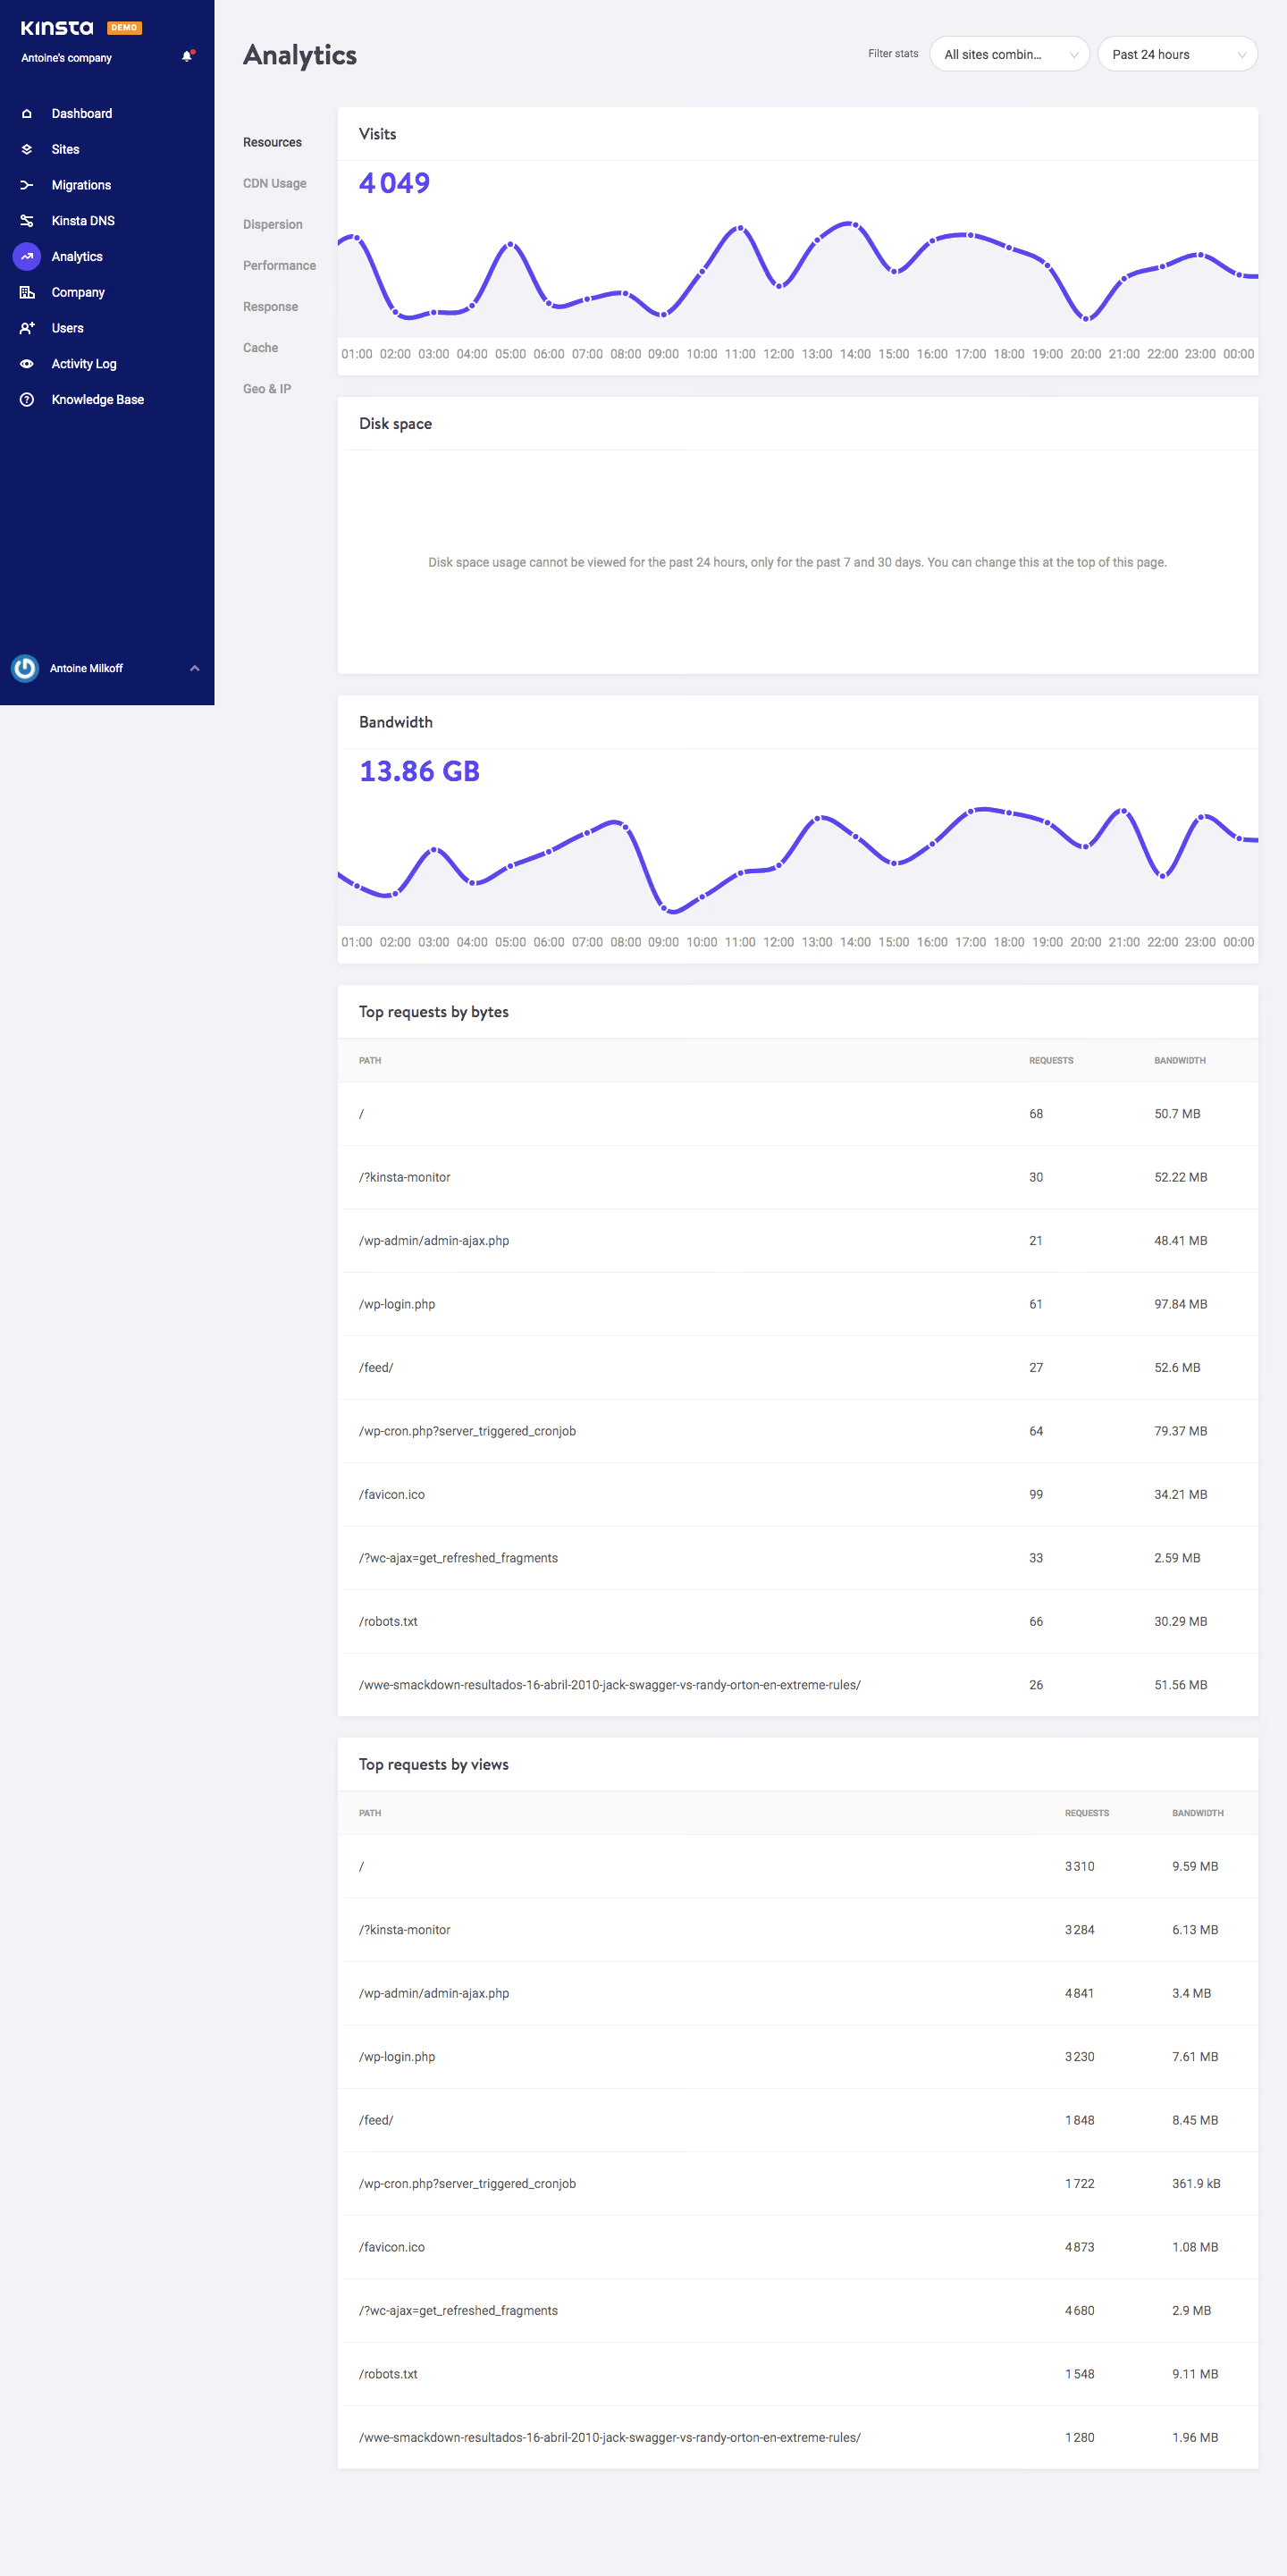
Kinsta Analytics

Kinsta
WordPress Hosting Tool
Designed by
No items found.

Bookmark
Bookmark

Design with AI
Thank you! Your submission has been received!
Oops! Something went wrong while submitting the form.
# Design from Reference: Kinsta Analytics
Create an original, high-fidelity visual design inspired by the reference. Prioritize composition, typography, colors, spacing, and component styling over technical implementation.
## Reference
- **Product:** Kinsta
- **Category:** Analytics
- **Screenshot:** https://cdn.prod.website-files.com/5e9dc792e1210c5325f7ebbc/6acbca81f1e28b554221cfe6_6acbc8eef0dfeeb28221ac37_cms-b1b72ca4ff3ee4c21300c426.webp
Analyze the screenshot first. If inaccessible, request it rather than guessing.
## Content
{{content.instructions}}
{{content.data}}
Preserve essential messaging and factual accuracy. Adapt structure and copy length for visual balance; never invent product claims.
## Visual Design
### Overall aesthetic
- **Style:** A functional hosting analytics dashboard with a deep navy application rail, pale gray workspace and stacked white chart/table cards.
- **Scale:** Source screenshot 1440 × 2882px. Dimensions below are screenshot-pixel estimates; CSS/device scale is unverified.
### Page composition
- **Navigation:** A roughly 240px navy sidebar occupies the upper viewport, with Kinsta branding, orange Demo badge, company name, navigation items and a bottom account row.
- **Workspace header:** Analytics is positioned at the top left of the remaining workspace. Two rounded selects for site scope and time range align right.
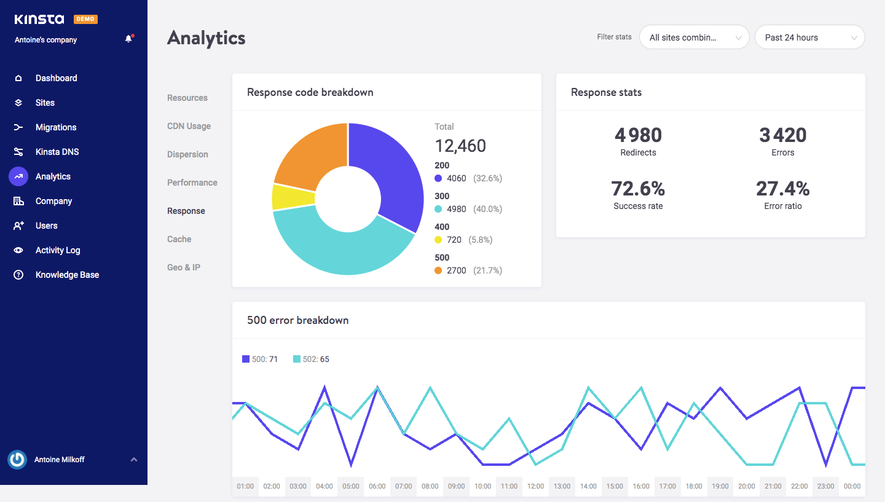
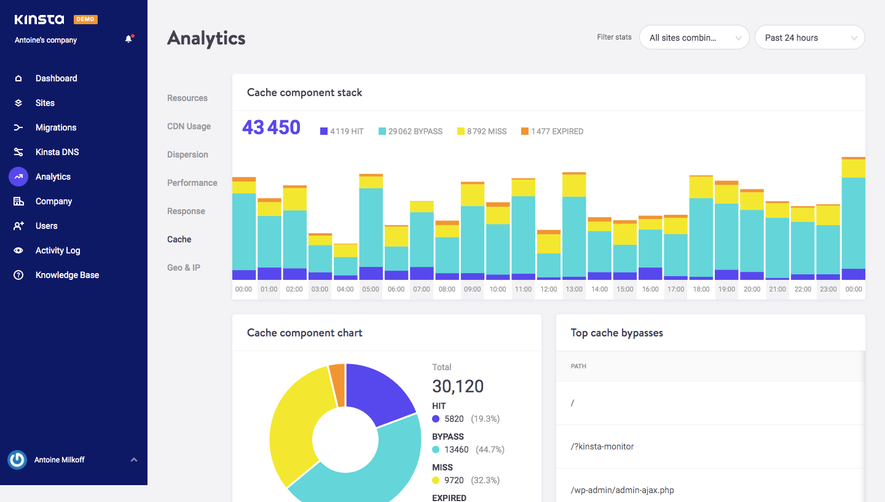
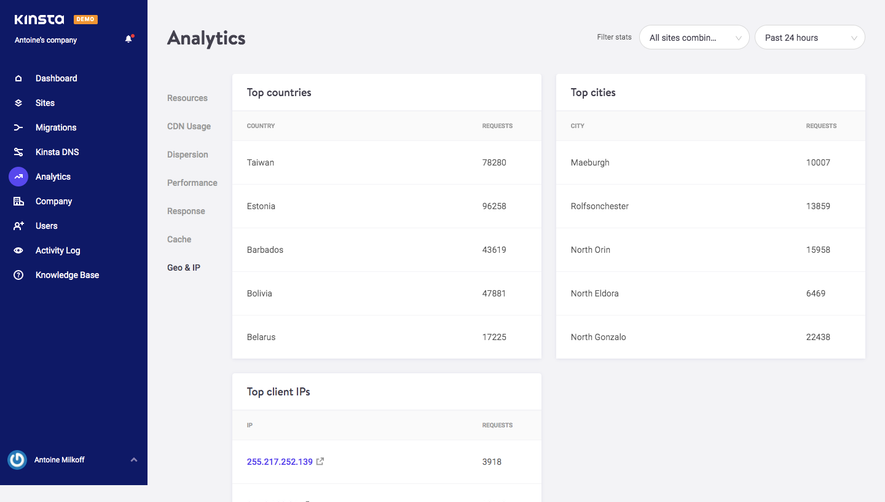
- **Secondary navigation:** A narrow text navigation column begins below the heading, with Resources selected and CDN Usage, Dispersion, Performance, Response, Cache and Geo & IP beneath it.
- **Data column:** An approximately 1030px-wide stack begins near x378: Visits chart, Disk space notice, Bandwidth chart, Top requests by bytes table and Top requests by views table.
### Information hierarchy
- **Summary charts:** Visits displays a large 4049 total; Bandwidth displays 13.86 GB. Each is followed by a purple hourly line chart.
- **Unavailable metric:** Disk space uses a large blank white panel with a centered explanation that the selected 24-hour range does not support that metric.
- **Detailed data:** Two tables provide path, requests and bandwidth columns, with ten visible data rows each. Long URL paths receive most of the available width.
### Typography
- **Family:** Compact sans-serif with slightly condensed-looking body text; exact font identity is unverified.
- **Roles:** Estimated page title around 32px bold; metric totals 32px bold; card titles 17–18px medium; navigation/body around 14px; table headings approximately 10–11px uppercase.
- **Chart labels:** Small gray hourly labels run across the bottom axes. No prominent numeric y-axis scale is visible.
### Colors & surfaces
- **Sampled palette:** ICC-aware sRGB samples include white #FFFFFF, workspace #F3F3F6, navy #0E1966 and subtle light surfaces #FAFAFA, #F2F2F5 and #F1F1F5.
- **Accents:** Purple visually identifies chart lines, metric totals and the selected Analytics navigation icon. The Demo badge is orange; a small red notification dot appears near the company header.
- **Boundaries:** Cards use very light borders/shadows. Pale-gray chart fills and table-header bands create separation without strong outlines.
### Components
- **Charts:** Wide white cards around 300px high, with a title band separated by a thin rule. Smooth purple curves have small white-bordered point markers and a faint filled area below.
- **Filter selects:** Two pill-like outlined white controls, roughly 180px wide and 40px high, with labels and downward chevrons.
- **Disk-space panel:** A roughly 310px-high card keeps its title at the top and centers the availability message in the body; no fabricated chart fills the space.
- **Tables:** Three-column cards use a broad path column and two narrow numeric columns. Rows are approximately 70px tall with fine horizontal dividers and generous left padding.
- **Sidebar:** White icons and labels repeat vertically; the active Analytics icon has a filled purple circular background. No dropdown or tooltip is open.
### Visual rhythm
- **Stacking:** Cards are separated by roughly 24px gaps and keep a consistent left/right edge. The two chart cards repeat the same title-total-chart structure.
- **Density:** Large chart and notice surfaces precede long, evenly spaced table rows. The narrow secondary navigation remains visually distinct from the data column.
### Responsive
- **Recommended adaptation:** Only desktop is shown. Collapse the main sidebar, convert category navigation to tabs or a menu, and stack the filter controls above the cards.
- **Data readability:** Allow tables to scroll horizontally; preserve long path values and numeric units. Reduce chart tick density rather than compressing every hourly label.
### Adaptation guidance
- **Preserve:** Keep a consistent metric-card structure, purple chart language, clear time/site filters and explicit explanations for unavailable measurements.
- **Adapt:** Use real hosting metrics and paths. Choose chart scales from the actual data and maintain the distinction between aggregate totals, hourly trends and ranked request tables.
Use this context to reproduce the reference's visual language: layout, typography, colors, spacing, borders, radii, and distinctive elements. The screenshot takes priority if descriptions conflict.
## Direction
{{preferences.fidelityInstructions}}
## Output
{{output.instructions}}
Deliver a polished, cohesive design with precise alignment, hierarchy, and spacing. Produce the requested visual artifact, not just a description. If unsupported, explain the limitation.


Category
Patterns
No items found.
Tech Stack

Added on
October 21, 2020
Found in 1 flow
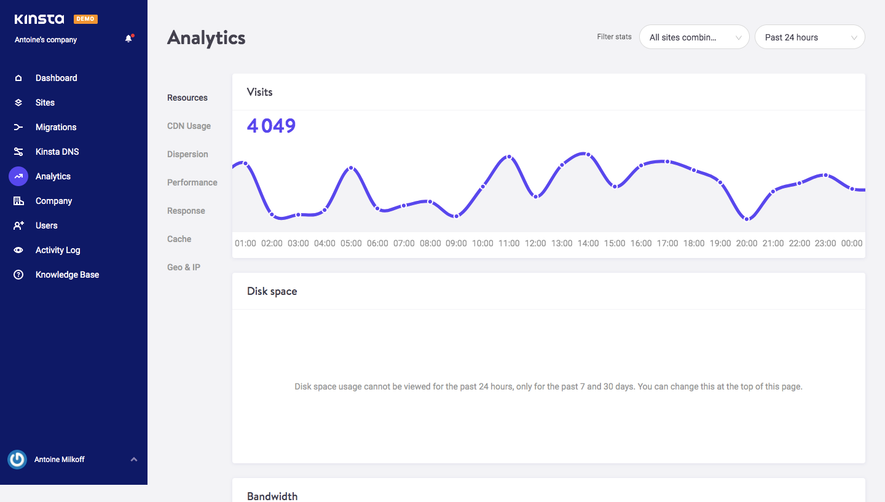
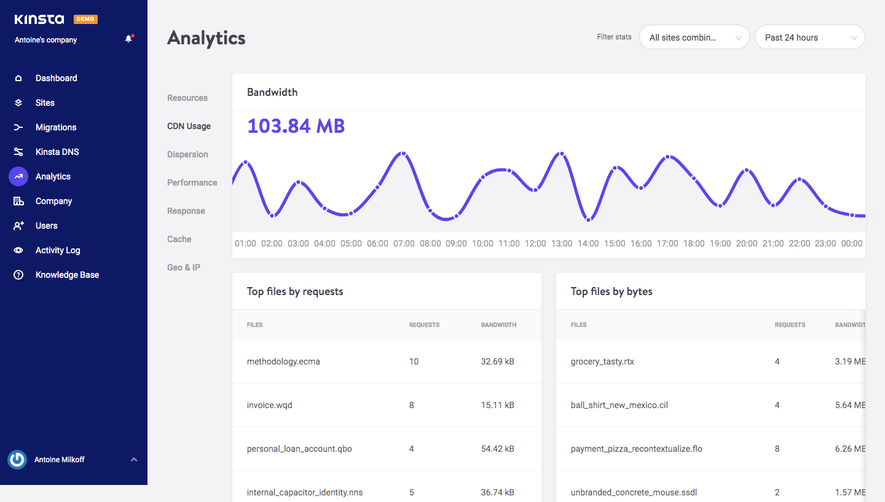

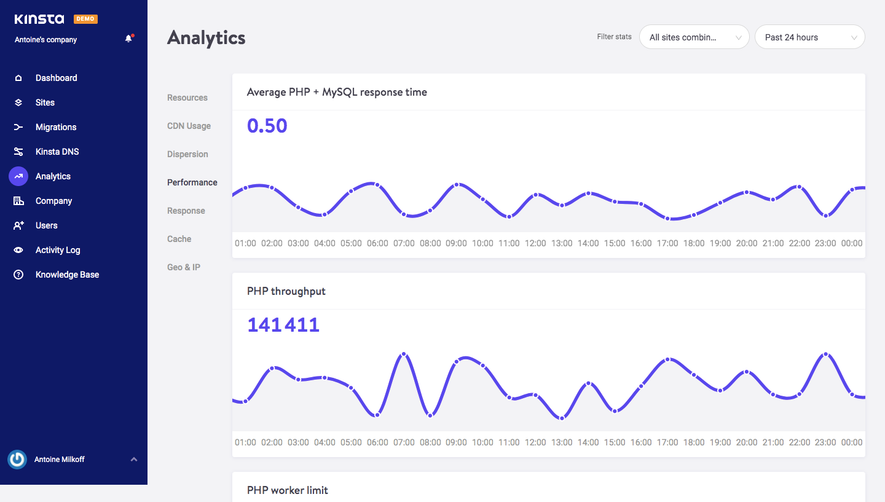
Similar screens


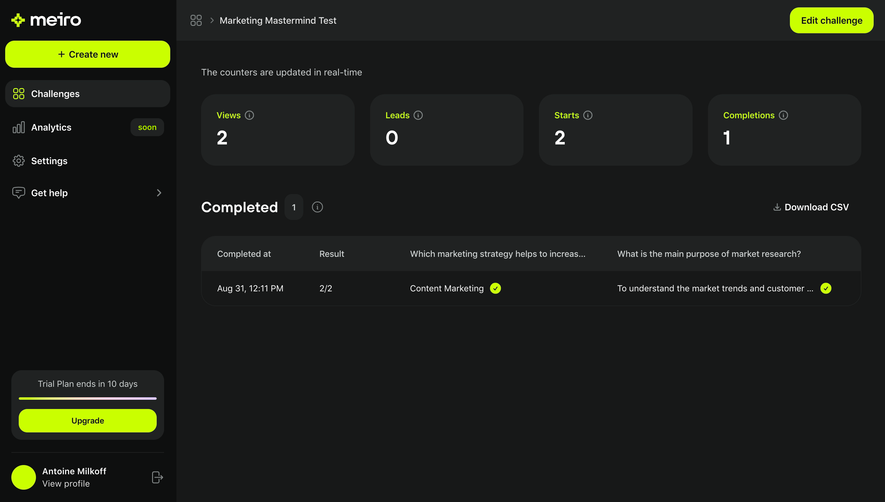

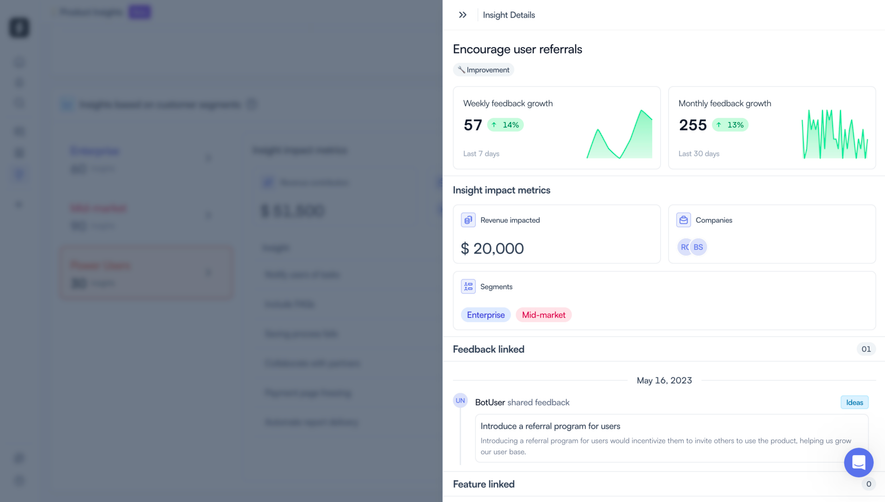

Upgrade to SaaSFrame Pro now to see similar examples.
Monthly
$18 /month
Billed $18 monthly
Browse all screens & flows
Filter and search screens & flows
Search text in screenshots
Access Figma files
Access mobile versions
Join now
Quarterly
$16 /month
Billed $48 quarterly
Browse all screens & flows
Filter and search screens & flows
Search text in screenshots
Access Figma files
Access mobile versions
Join now
Yearly
$15 /month
Billed $180 yearly
Browse all screens & flows
Filter and search screens & flows
Search text in screenshots
Access Figma files
Access mobile versions
Join now