Design with AI
Generate a new design based on this screen using your own content.
# Design from Reference: Folio Analytics
Create an original, high-fidelity visual design inspired by the reference. Prioritize composition, typography, colors, spacing, and component styling over technical implementation.
## Reference
- **Product:** Folio
- **Category:** Analytics
- **Screenshot:** https://cdn.prod.website-files.com/5e9dc792e1210c5325f7ebbc/6acb6801c08cd859ff869454_6acb671418ad202d01d78ab6_cms-3228bf19420995abeb73d347.webp
Analyze the screenshot first. If inaccessible, request it rather than guessing.
## Content
{{content.instructions}}
{{content.data}}
Preserve essential messaging and factual accuracy. Adapt structure and copy length for visual balance; never invent product claims.
## Visual Design
### Overall aesthetic
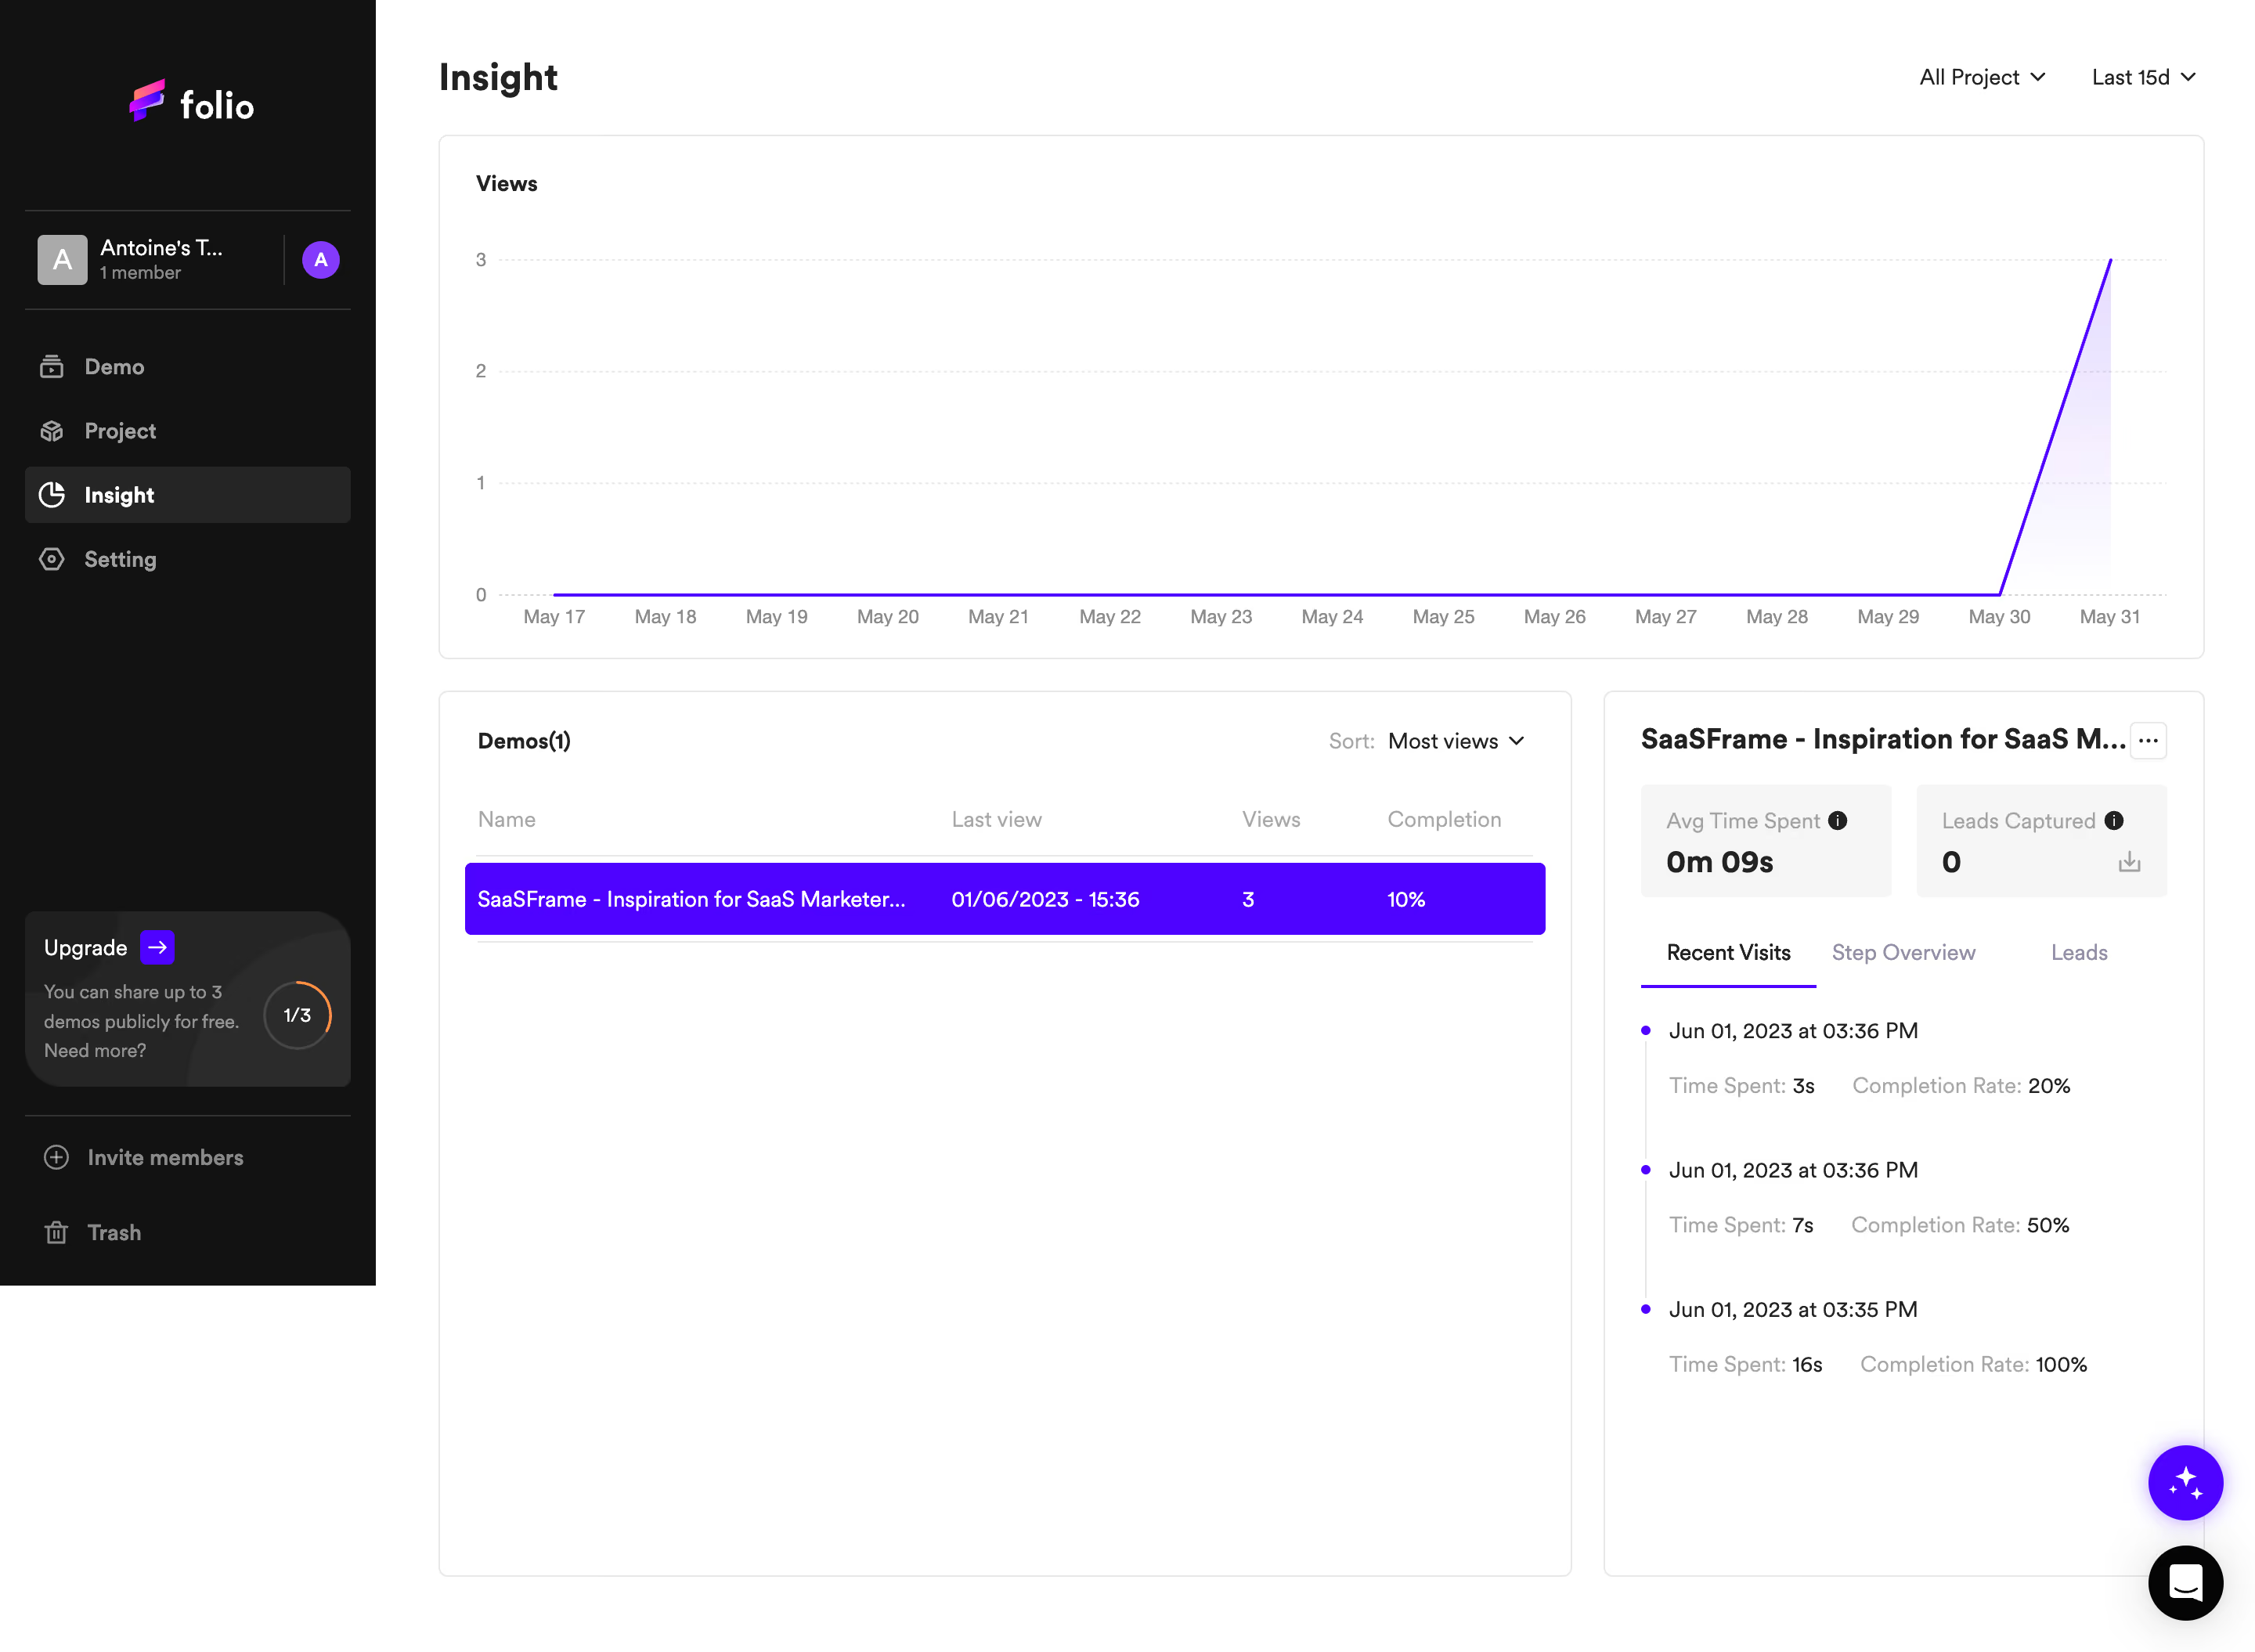
- **Character:** Sparse analytics dashboard contrasting a black sidebar with white panels and vivid violet selection.
### Page composition
- **Canvas:** 2880 × 2110 screenshot pixels; CSS estimates assume approximately 2× scale.
- **Structure:** Narrow dark navigation, Insight heading/filters, full-width views chart and lower demo table beside detail panel.
### Information hierarchy
- **Priority:** Views trend leads to selected demo row, then summary metrics and recent-visit timeline.
### Typography
- **Family:** Neutral sans-serif; exact font is unverified.
- **Scale:** Estimated CSS page title 24px, panel titles 16px, body/table 13–14px and metadata 12px.
### Colors & surfaces
- **Sampled palette:** White #FFFFFF; sidebar #121212; violet #4D03FF; metric fill #F6F6F6; selected-nav #252525; borders #E8E8E8.
- **Chart:** Violet line/soft area fill over faint dotted horizontal grid.
### Components
- **Panels:** Thin outlined rectangles with 4px radii; selected table row filled violet.
- **Details:** Two KPI tiles, three tabs, dotted visit timeline, project/date filters and sidebar upgrade meter.
### Visual rhythm
- **Spacing:** Approximately 20px panel gutters and 24px padding; large empty table/detail areas keep data sparse.
### Responsive
- **Guidance:** Mobile is not shown. Stack detail below table and retain readable chart axes.
### Adaptation guidance
- **Transfer:** Preserve chart-to-item-detail hierarchy and clear selection. Use real target analytics values.
Use this context to reproduce the reference's visual language: layout, typography, colors, spacing, borders, radii, and distinctive elements. The screenshot takes priority if descriptions conflict.
## Direction
{{preferences.fidelityInstructions}}
## Output
{{output.instructions}}
Deliver a polished, cohesive design with precise alignment, hierarchy, and spacing. Produce the requested visual artifact, not just a description. If unsupported, explain the limitation.