```html
Overall Style and Aesthetic
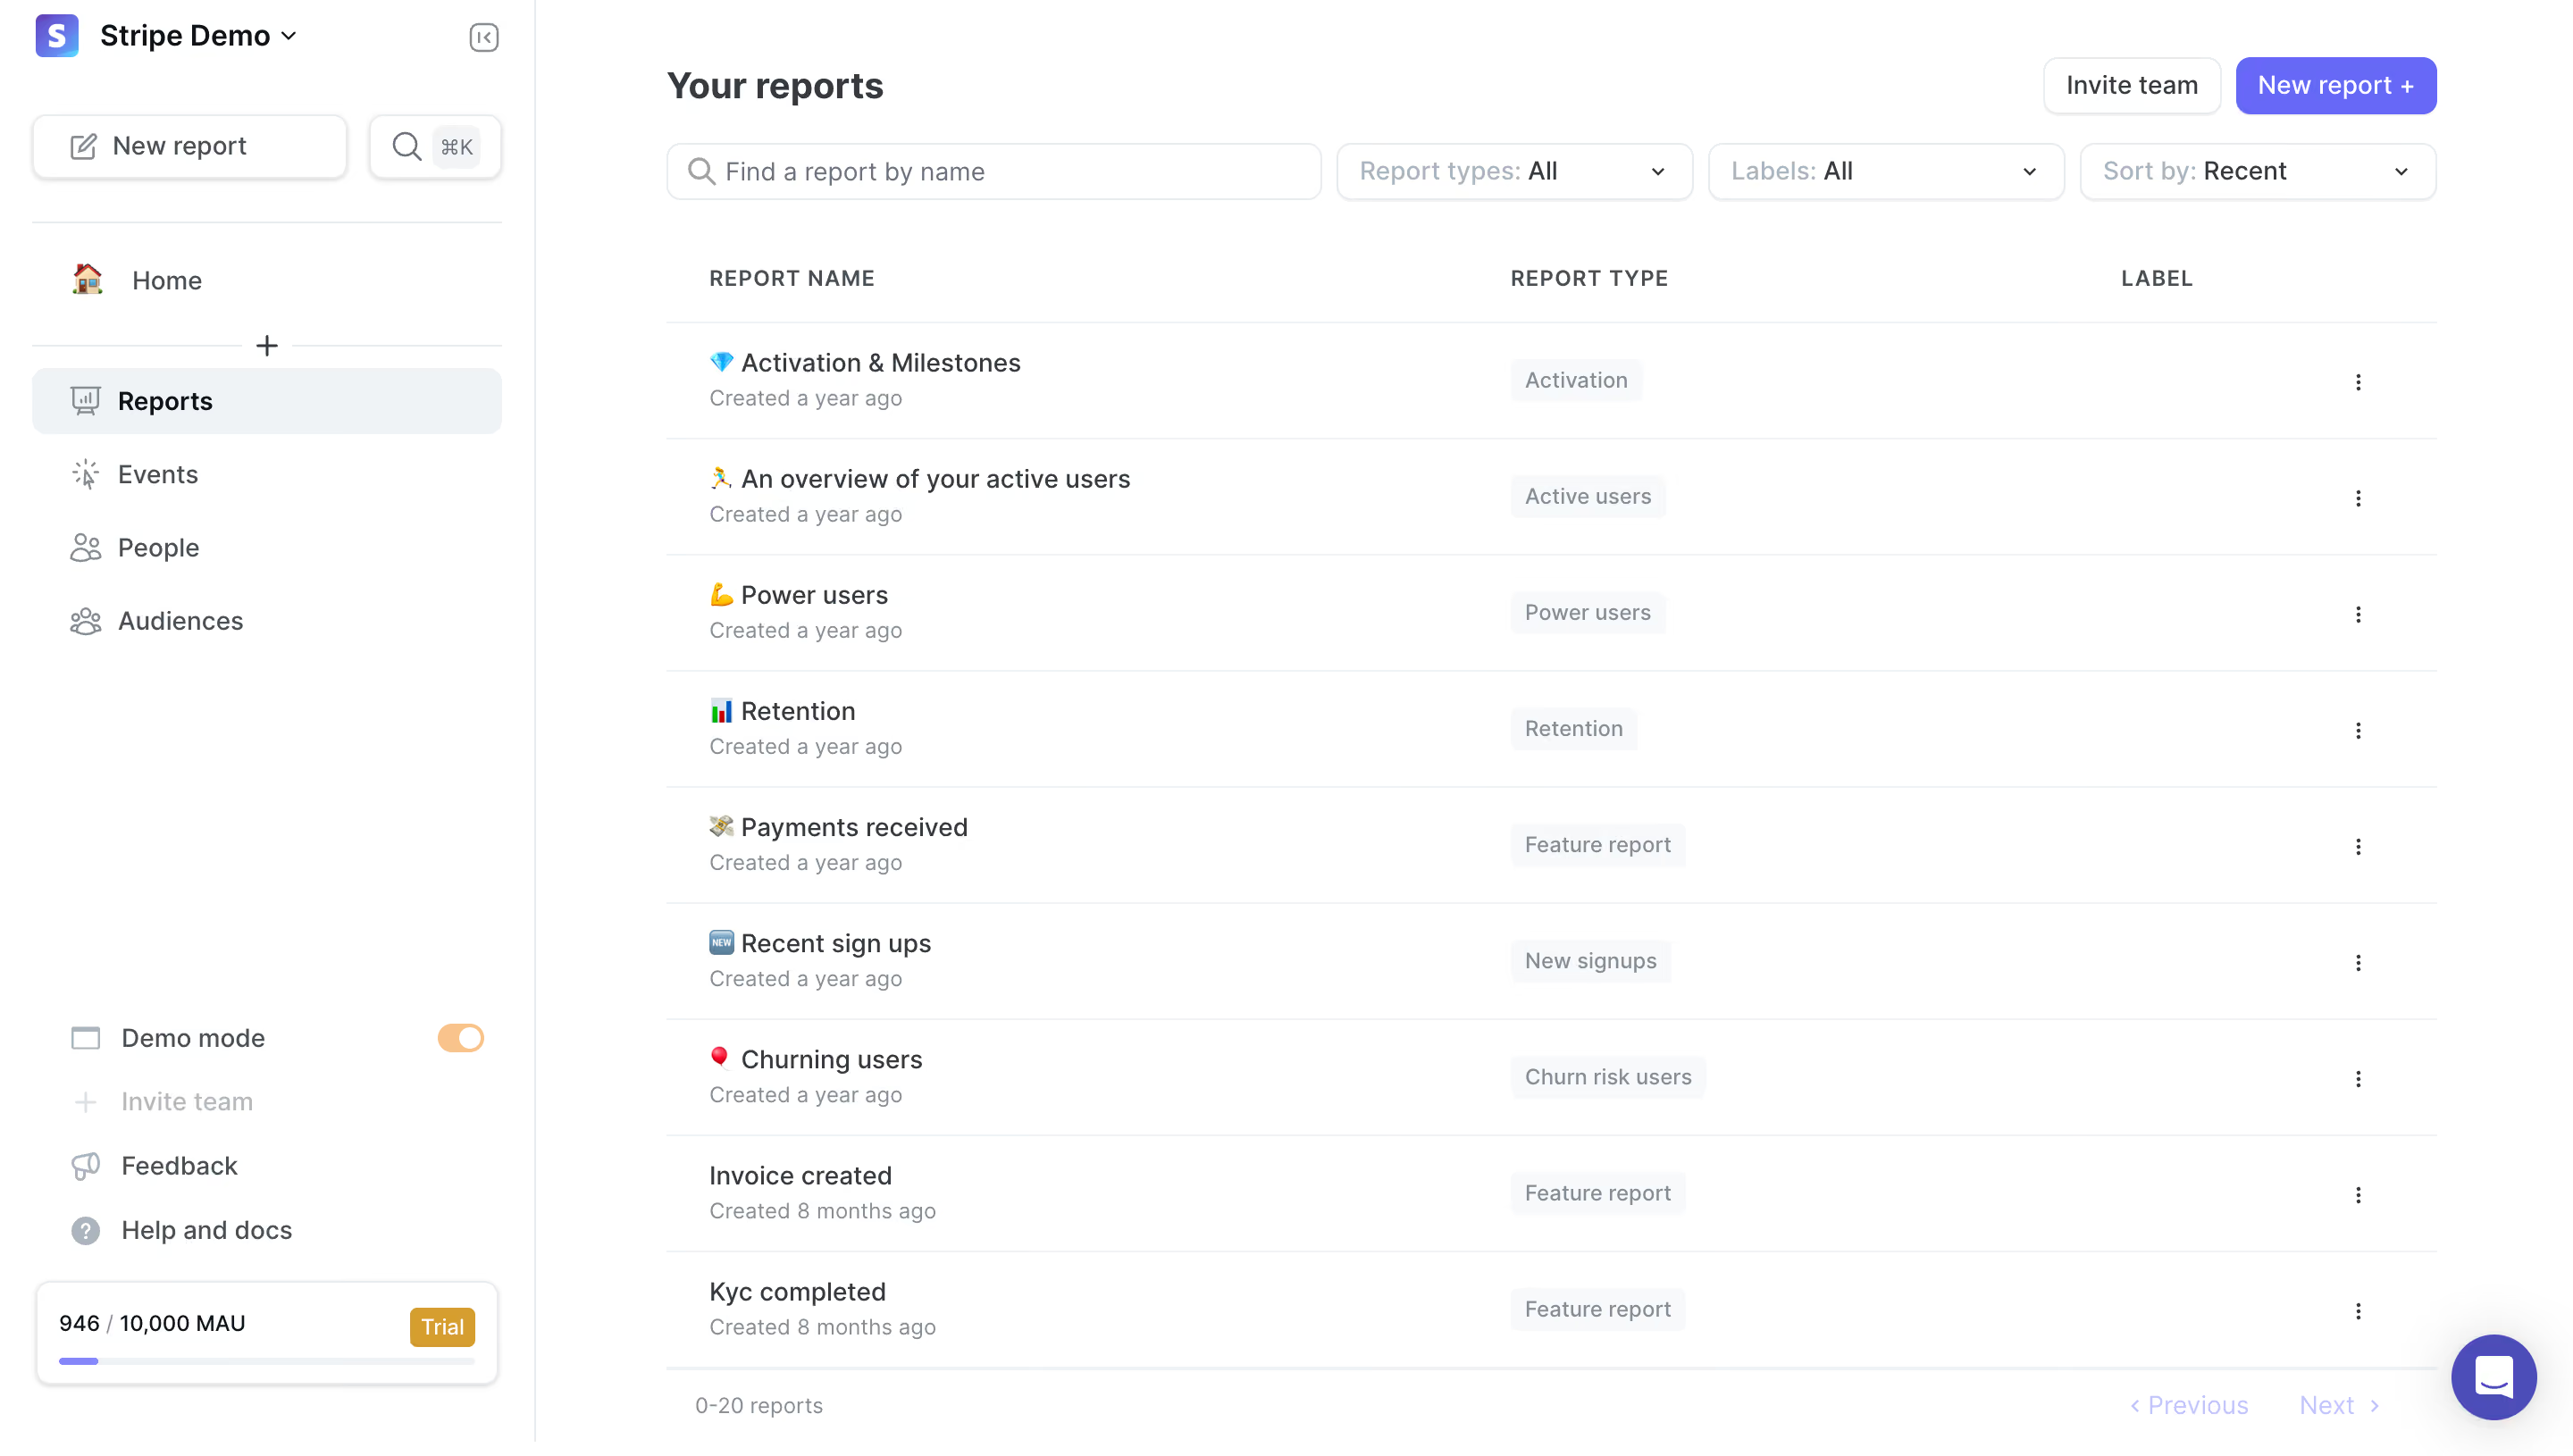
``` June Analytics embraces a sleek, modern minimalism that radiates clarity and professionalism. The interface leverages ample white space, giving data visualizations room to breathe. Clean lines and crisp edges keep the look uncluttered, while subtle shadowing and delicate gradients inject a sense of depth without overwhelming the content. ```html Layout and Structure
``` The page adopts a dashboard layout, headlined by a persistent sidebar for effortless navigation between reports. Content is segmented into modular cards, each housing a report preview—streamlining browsing and promoting scanability. There’s a persistent top bar with search and settings, while the footer is simple and unobtrusive, keeping focus on analytics. ```html Visual Elements
``` Vibrant, yet tasteful, color-coded charts and interactive graphs dominate the landscape, immediately drawing attention to key metrics. Custom icons beside each report add personality and distinguishability. Subtle transitions and on-hover effects heighten interactivity, while maintaining speedy, distraction-free browsing. ```html Color Palette and Typography
``` The palette features a pristine white background accented by soft grays, energetic blues, and purposeful pops of purple and green—injecting both calm and liveliness. Typography favors a geometric sans-serif, with bold weights for headings and lighter body text, fostering an intuitive visual hierarchy and readability. ```html User Experience Patterns
``` Navigation is intuitive—persistent, high-contrast CTAs simplify taking action, while thoughtfully placed tooltips and contextual menus guide users without cognitive overload. Pagination is clear, and interactive filters are accessible yet unobtrusive, streamlining the journey to insights. ```html Unique or Notable Design Choices
``` Notably, the use of playful, product-centric icons and compact report cards distinguishes June’s dashboard from generic SaaS layouts. The design exudes confident innovation—trustworthy for data-driven decision makers but inviting enough for broader teams exploring analytics.