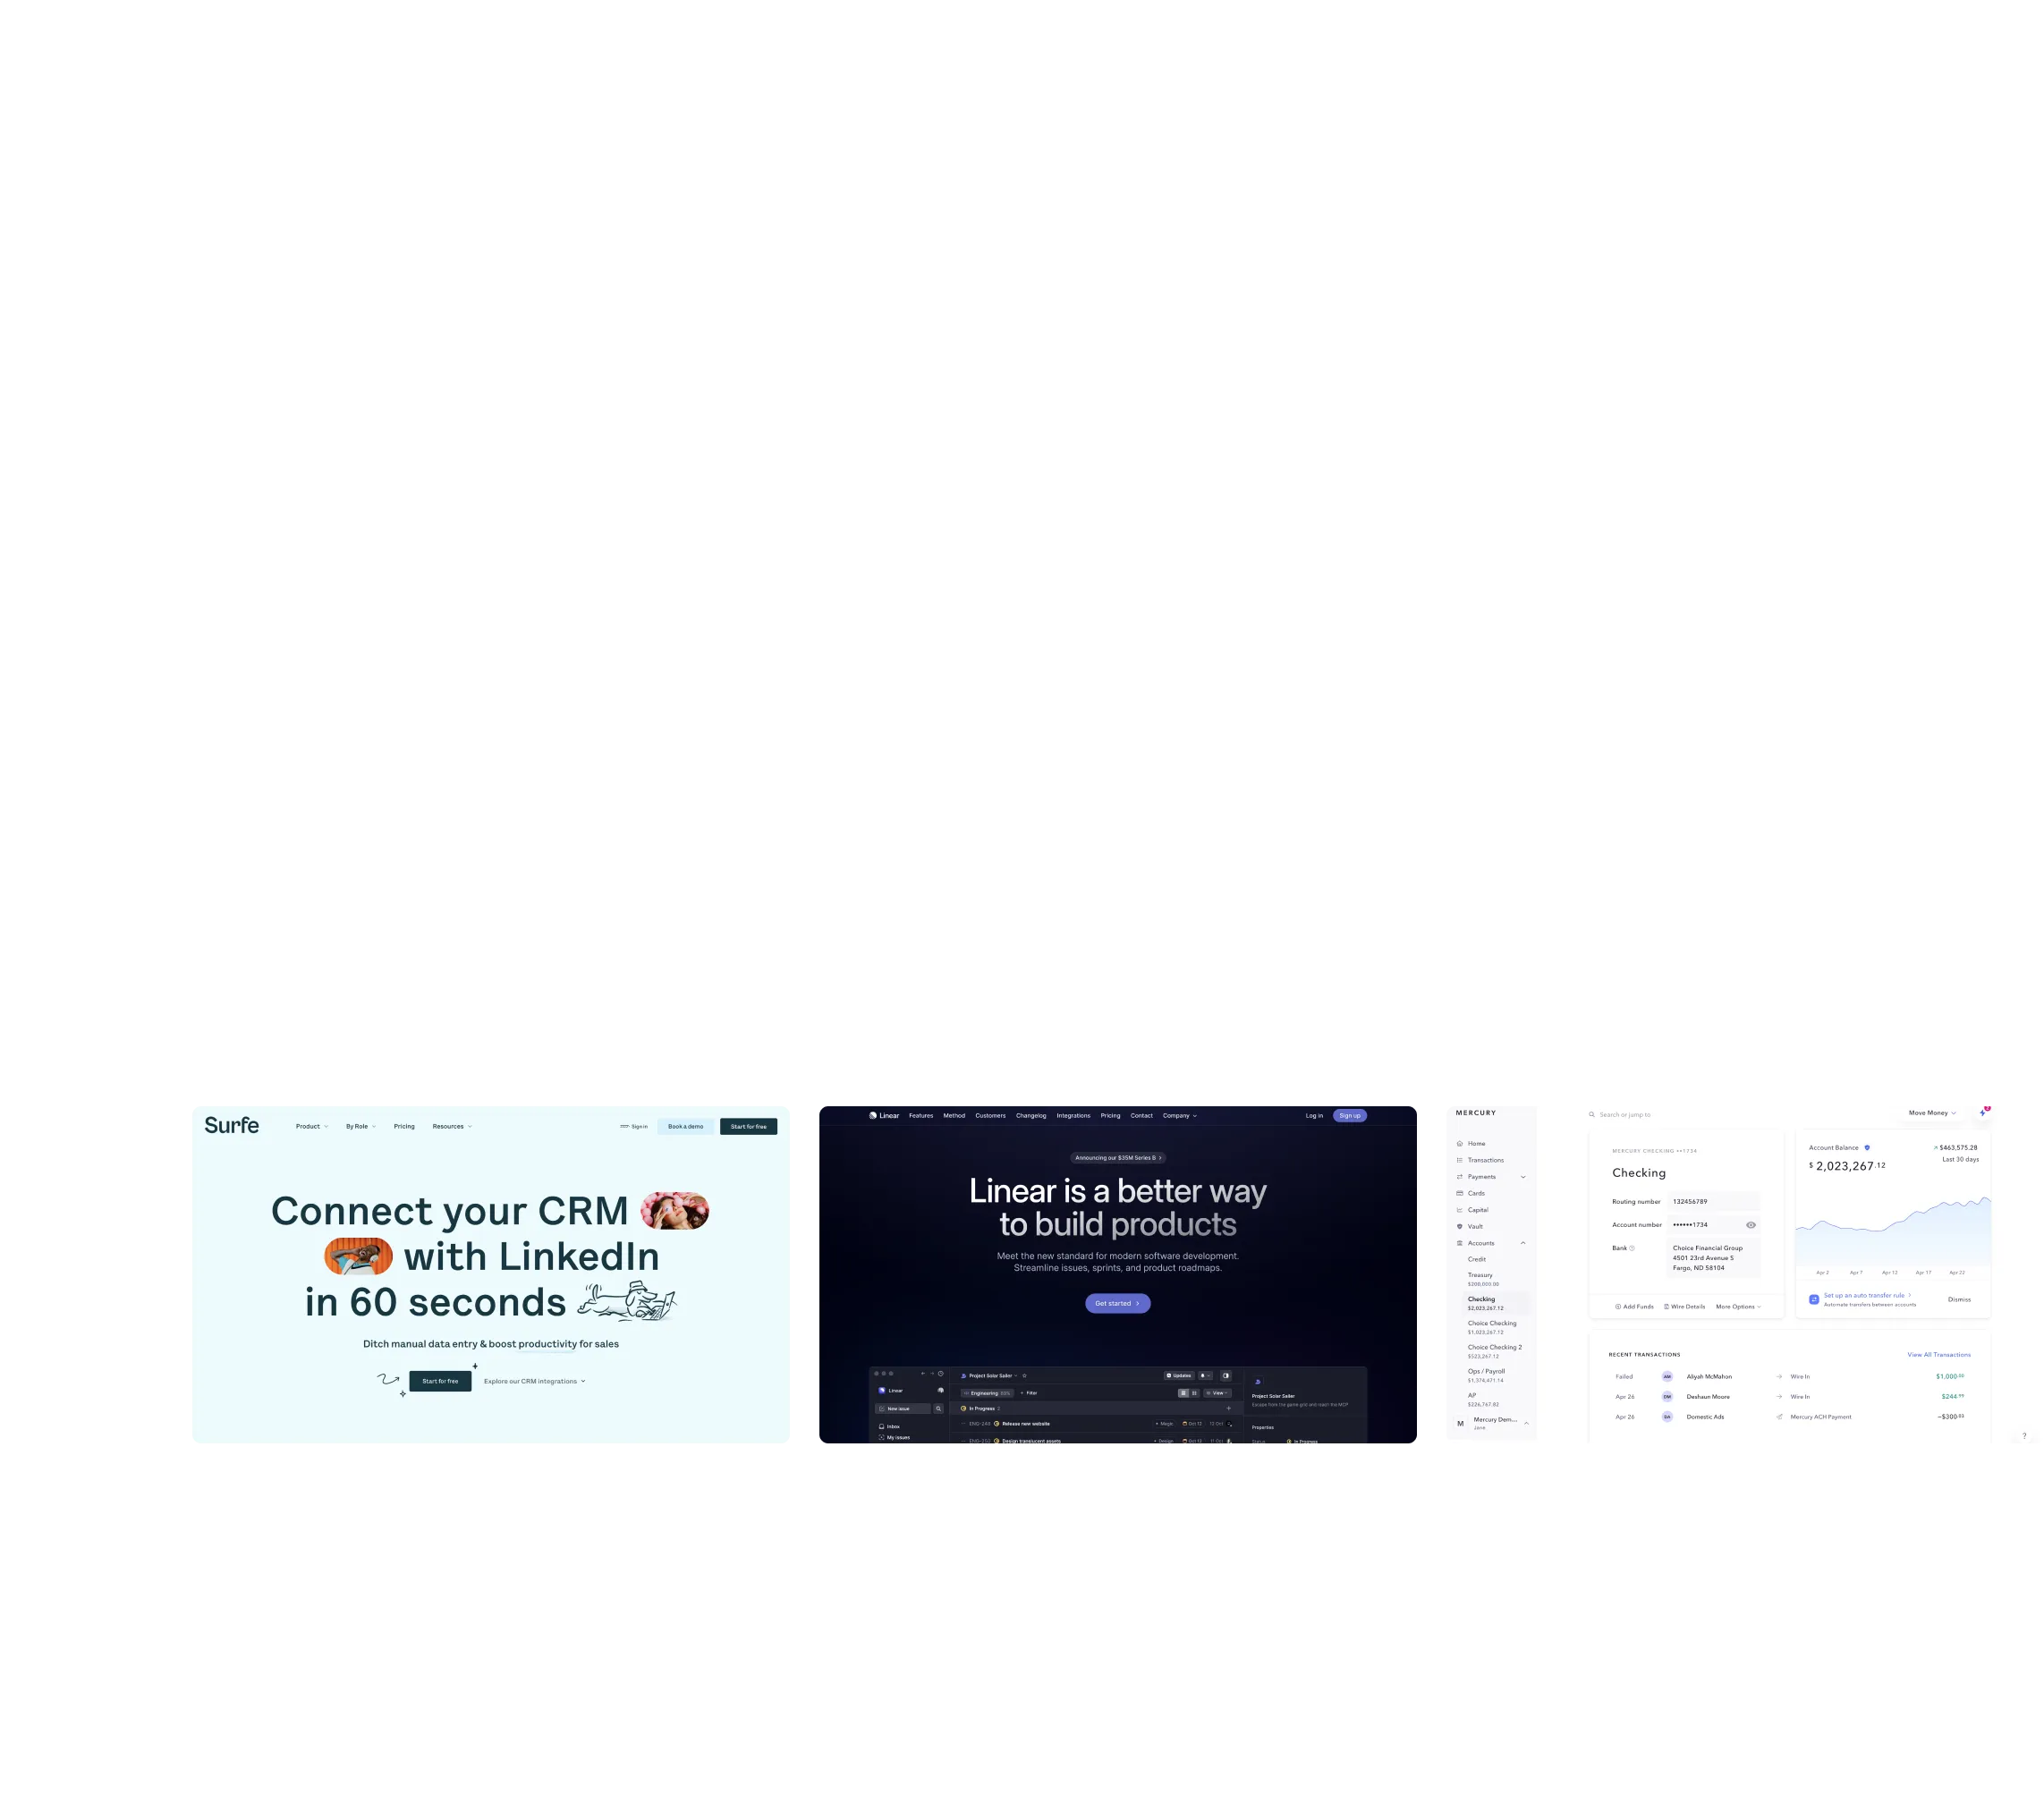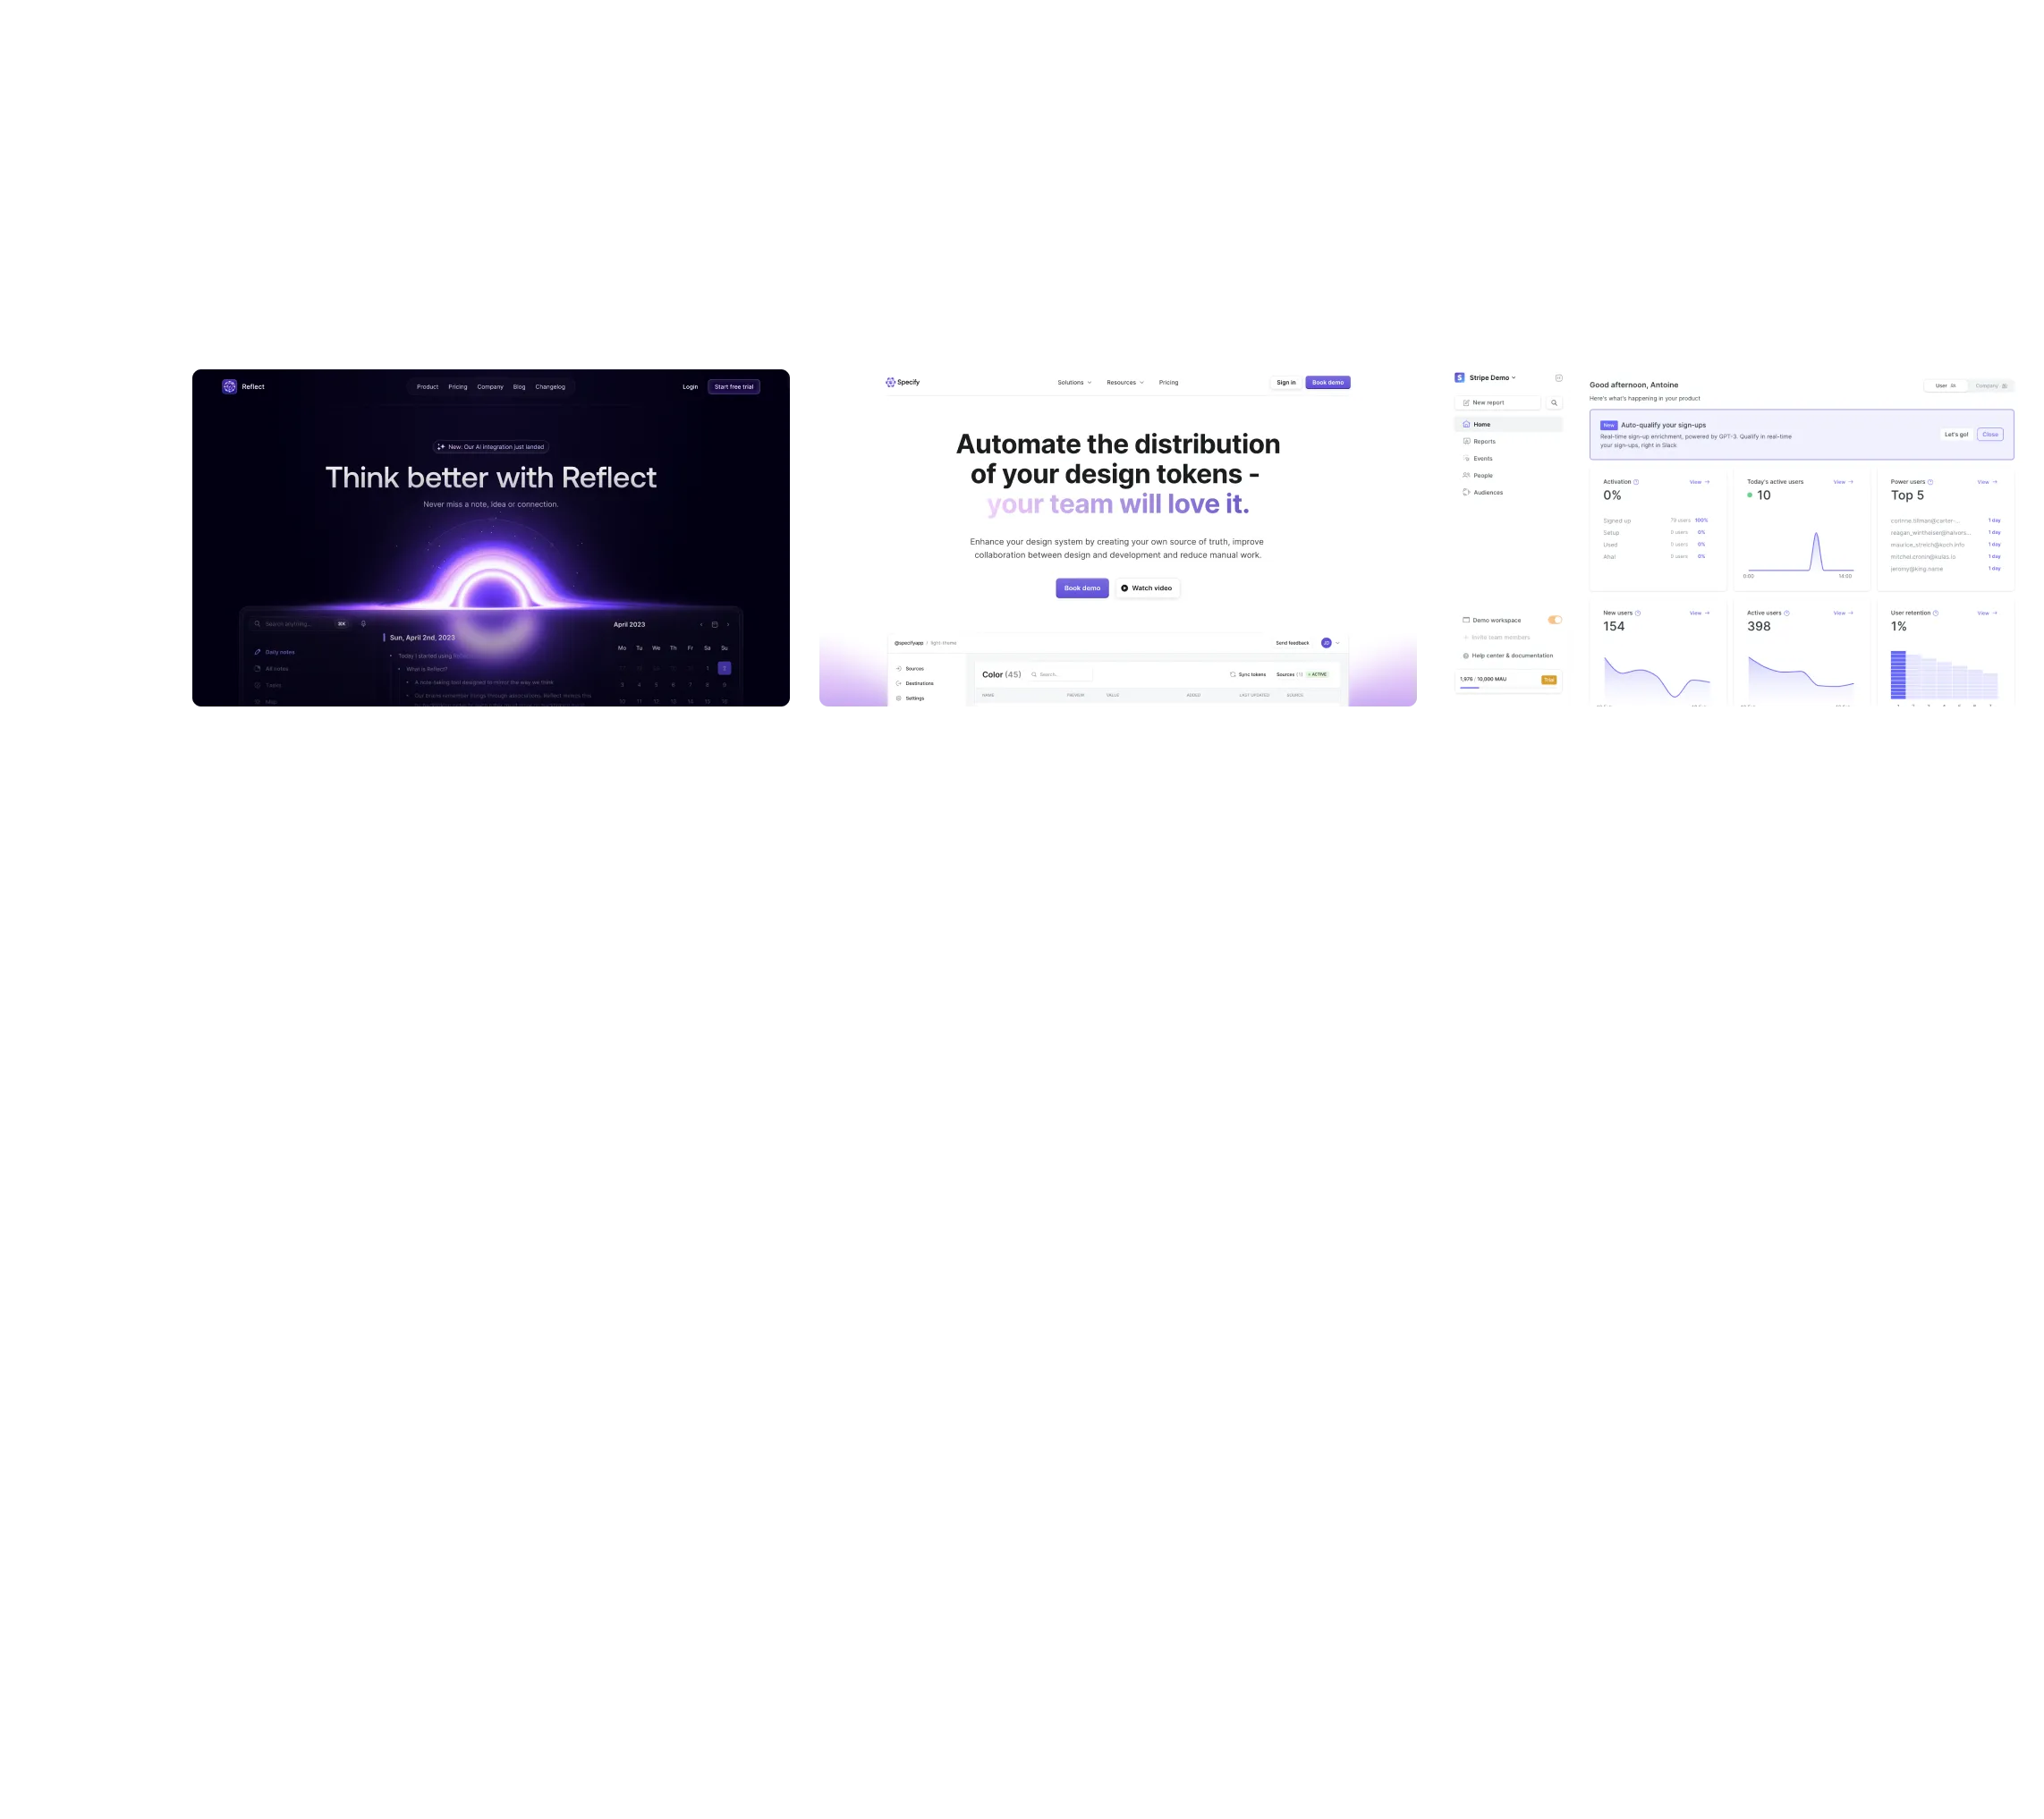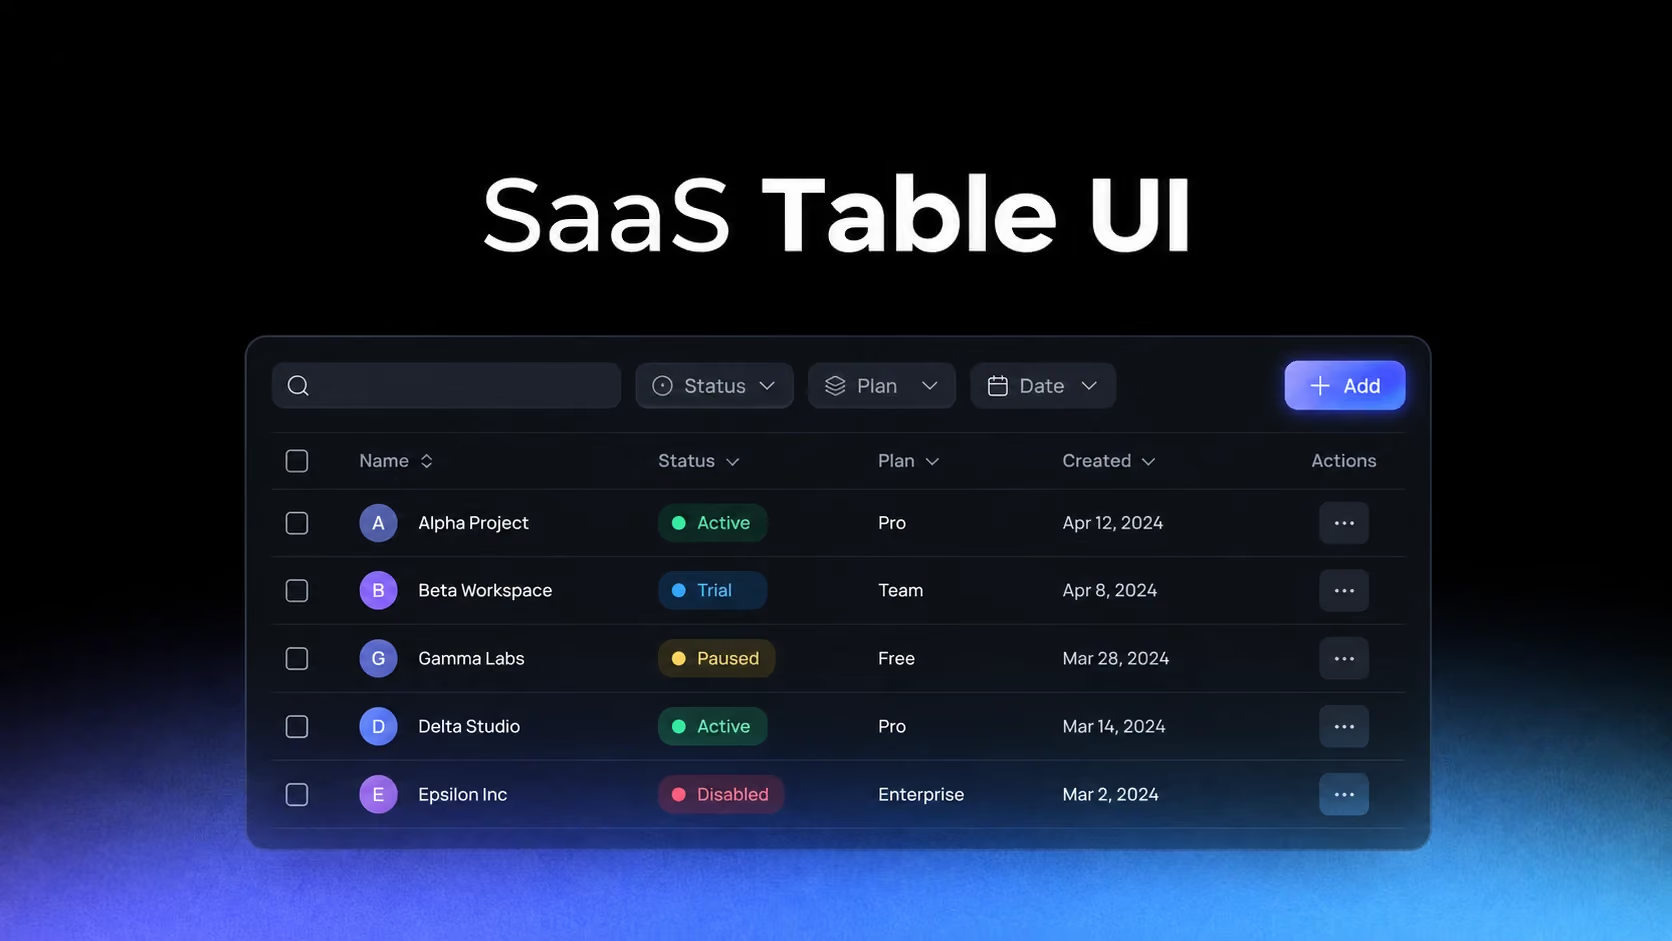
The goal of a SaaS table is not to fit the maximum number of columns on screen. It is to help users recognize records, compare meaningful differences and take action without losing their place. Density is useful only when the hierarchy survives it.
The first column establishes the identity of every row
OpenAI and Audienceful manage very different objects, yet both depend on a recognizable anchor. Once users lose track of what a row represents, every status, date and action becomes harder to interpret.
Study OpenAI: OpenAI Assistants Table on SaaSFrame
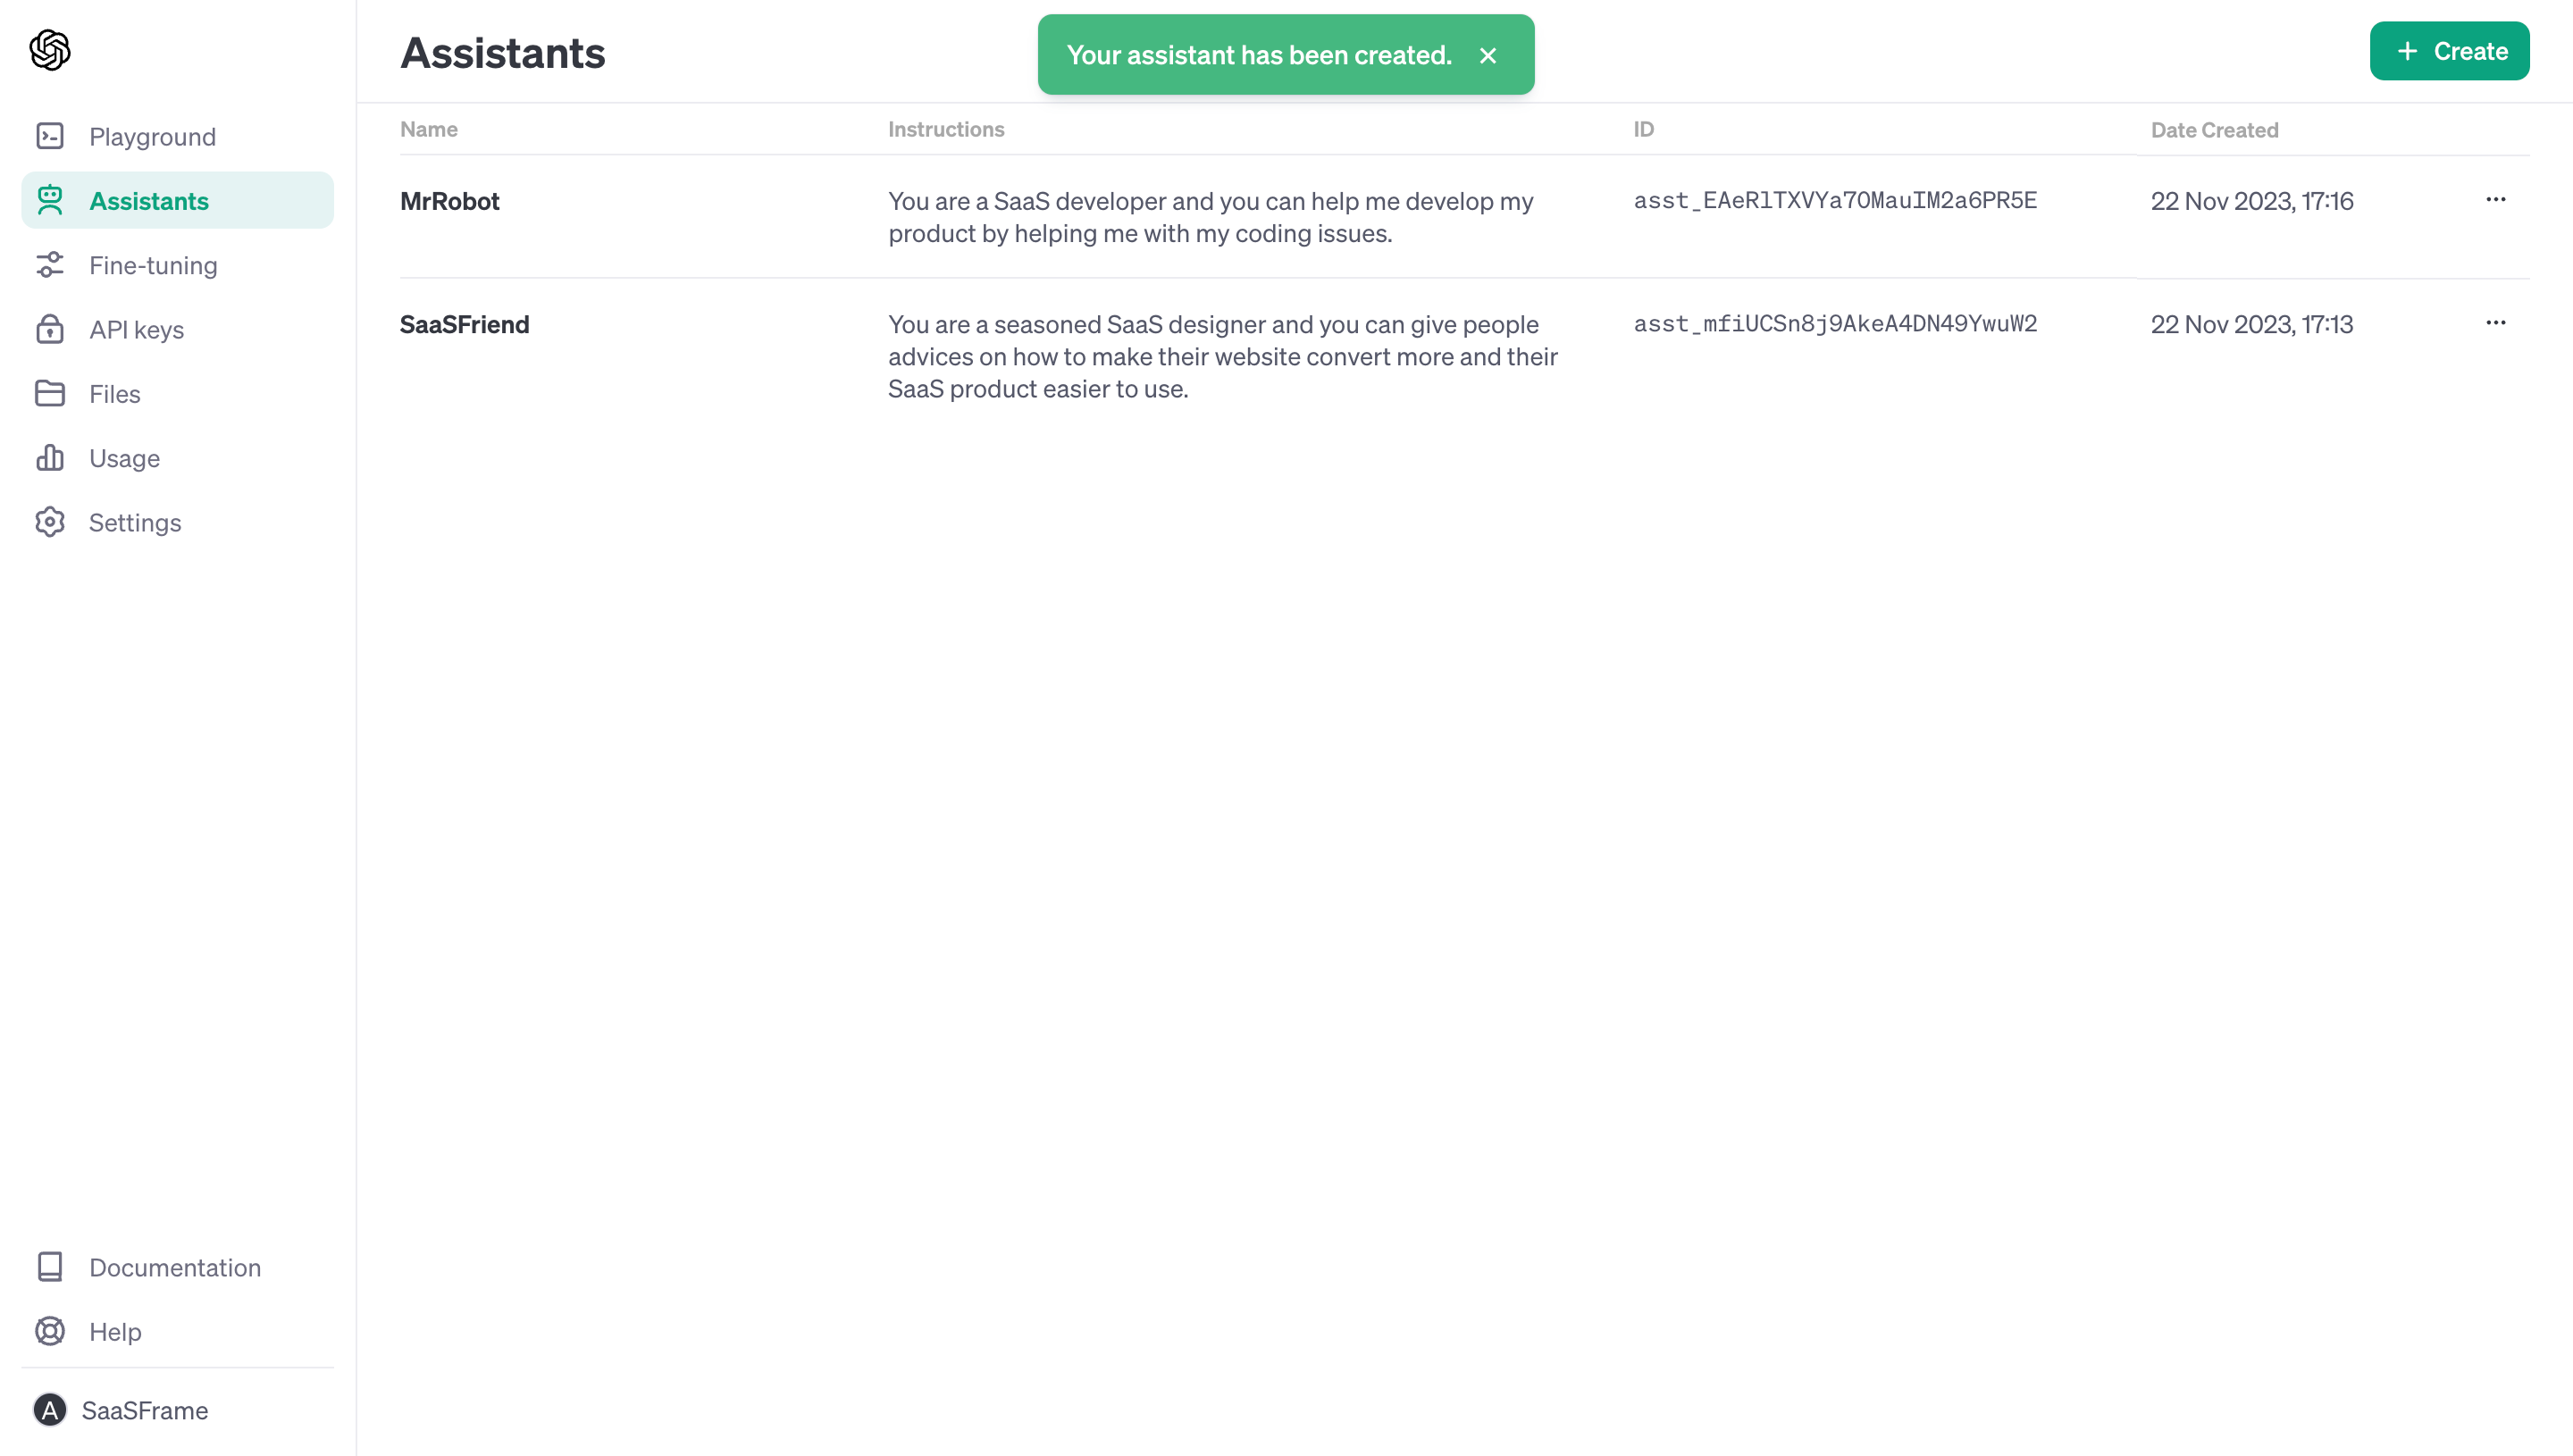
Study Audienceful: Audienceful People Table on SaaSFrame
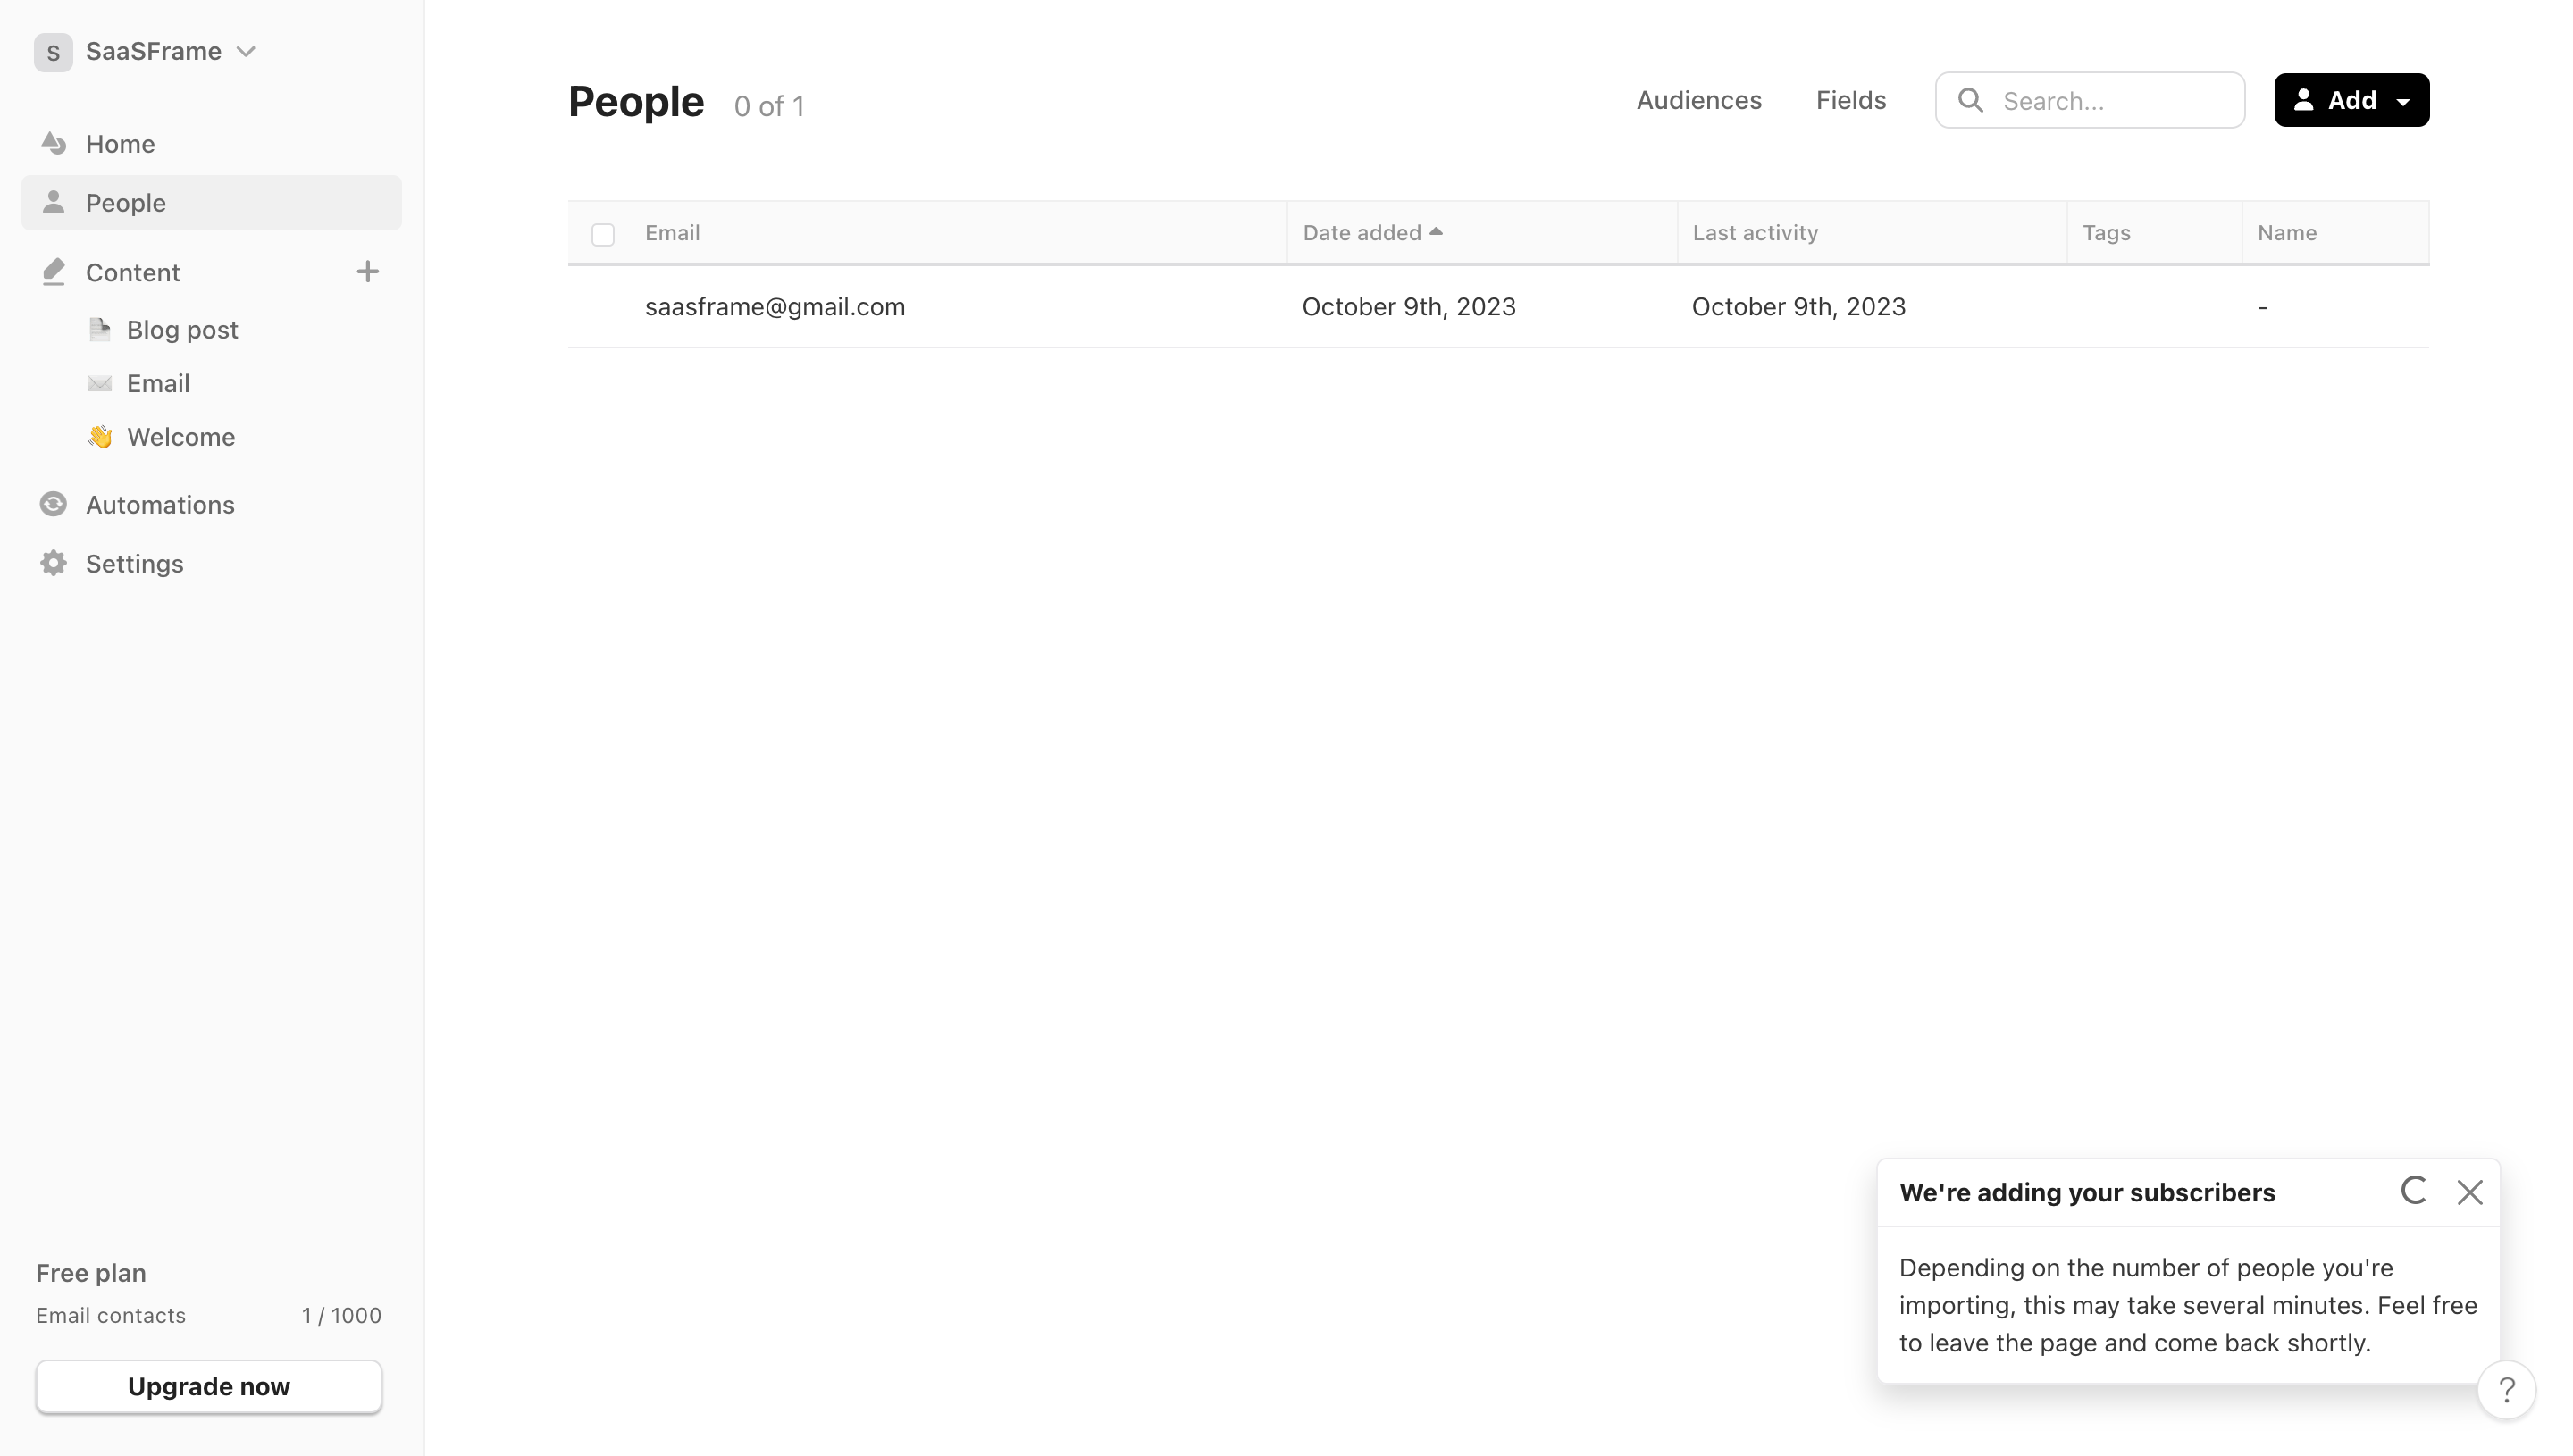
Give the identifying field enough width, visual contrast and persistence. On horizontal scroll, freezing an arbitrary numeric column is less useful than preserving the name or object identity.
Columns should follow comparison tasks, not database order
Dust and Stripe expose operational data where users scan for state changes and exceptions. The useful column order is therefore the order of a question: what is it, what state is it in, when did it change, and what can I do?
Study Dust: Dust Connected Data Table on SaaSFrame
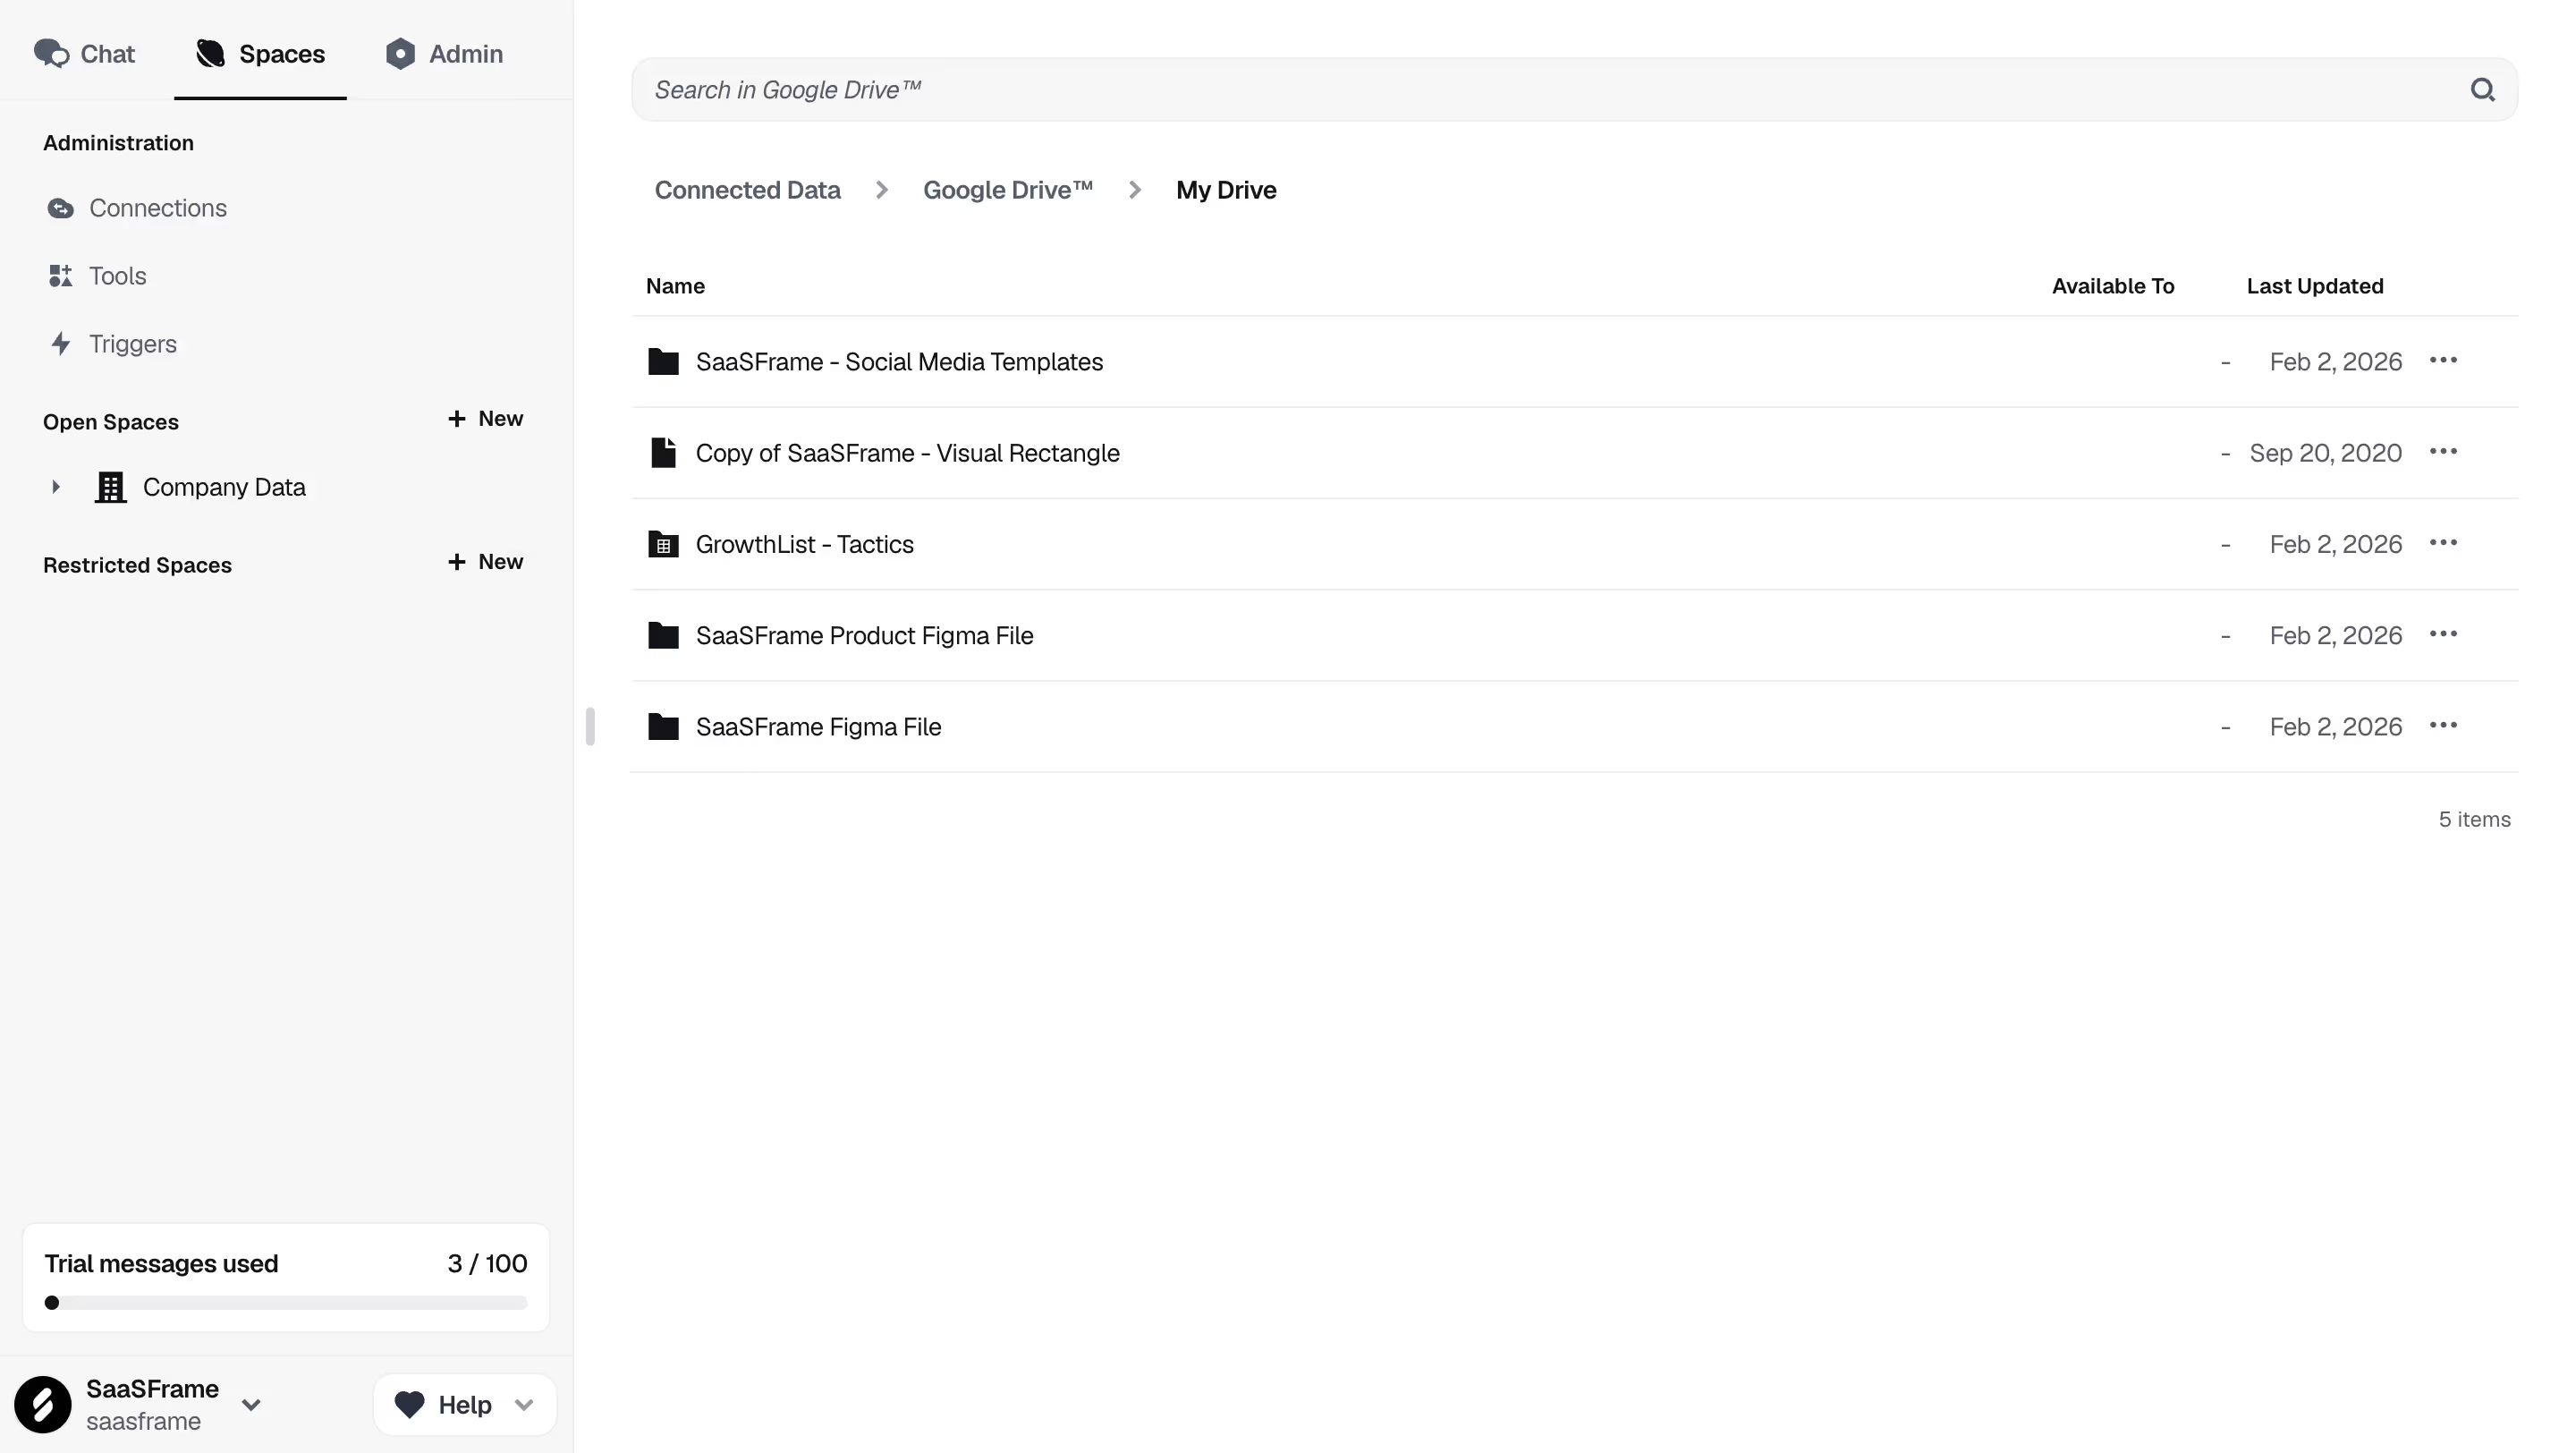
Study Stripe: Stripe Payments Table on SaaSFrame
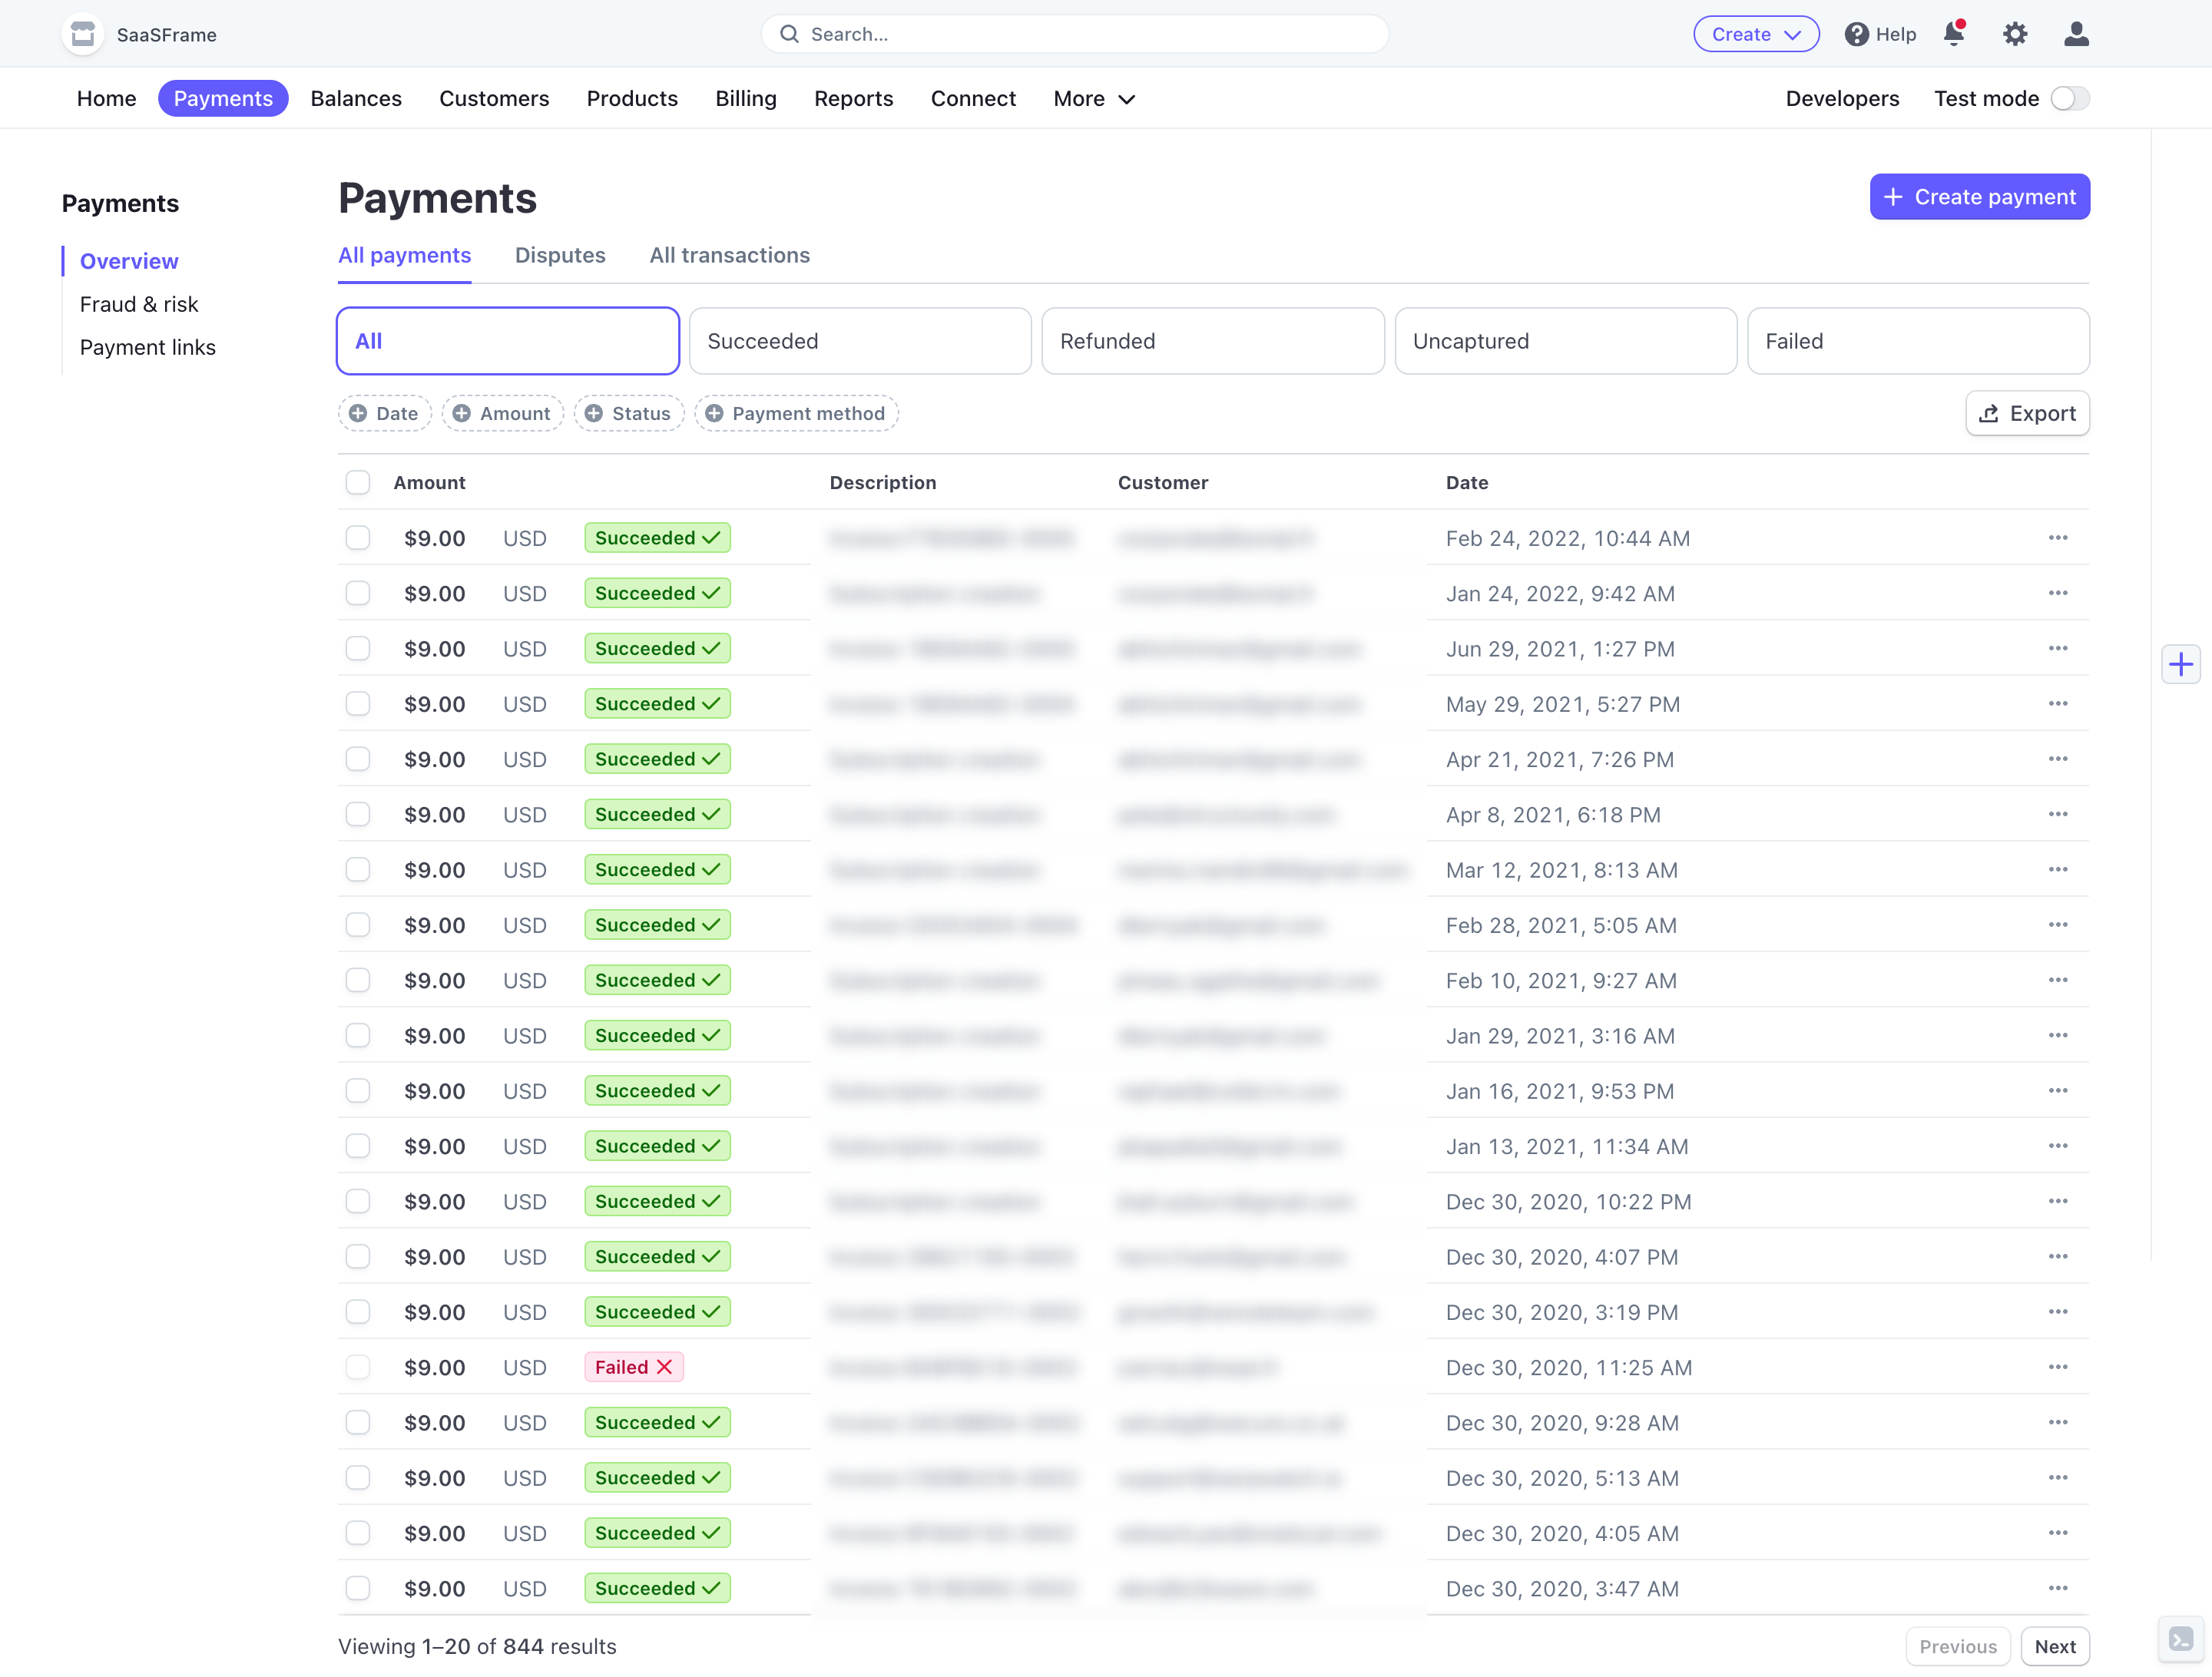
Audit a table by observing which columns users compare together. Adjacent placement can eliminate repeated eye travel, while backend field order rarely reflects real decisions.
Filters are a temporary model of user intent
Intercom’s user table pairs segmentation controls with the records they affect. Good filters show what is active, how results changed and how to return to the default state.
Study Intercom: Intercom Users Table on SaaSFrame
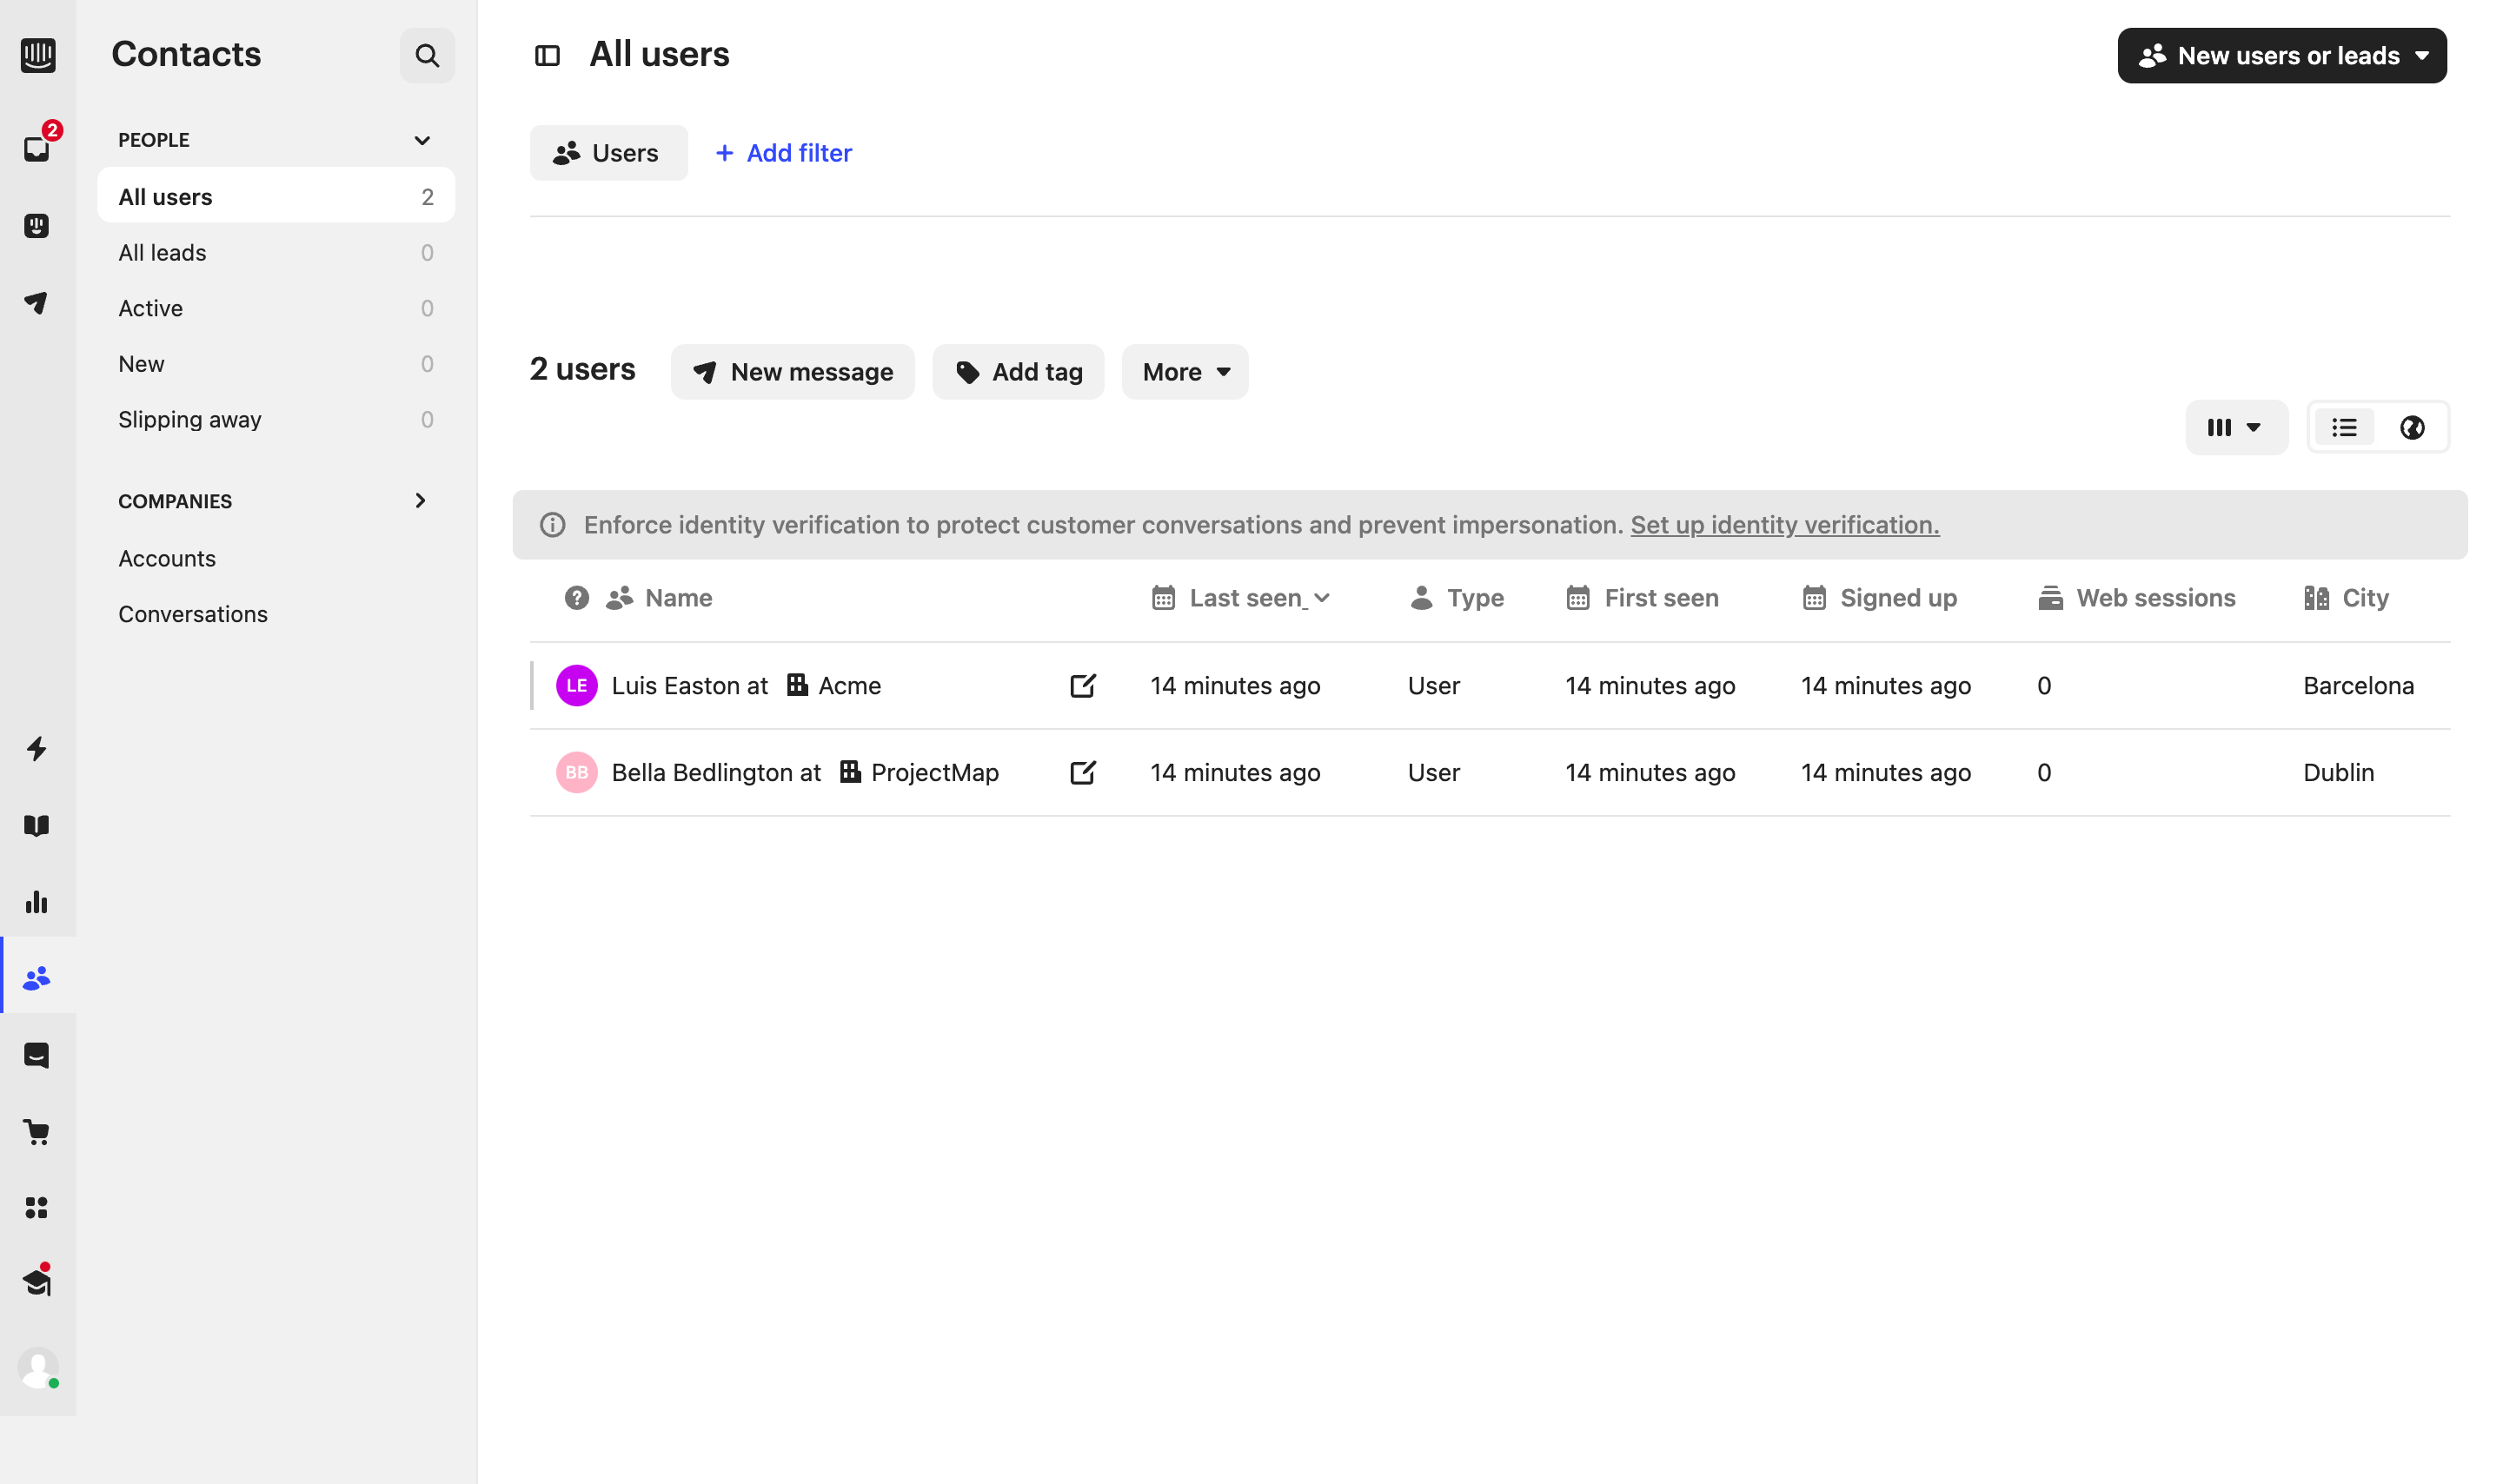
Hide advanced filters progressively, but never hide active ones. A filtered table that visually resembles the full dataset creates expensive mistakes.
Not every row action belongs in an overflow menu
June shows how a table can participate in a broader analytics workflow. The correct action hierarchy depends on frequency and reversibility: common safe actions can stay visible; rare or destructive actions can move into a menu.
Study June: June Analytics Table on SaaSFrame
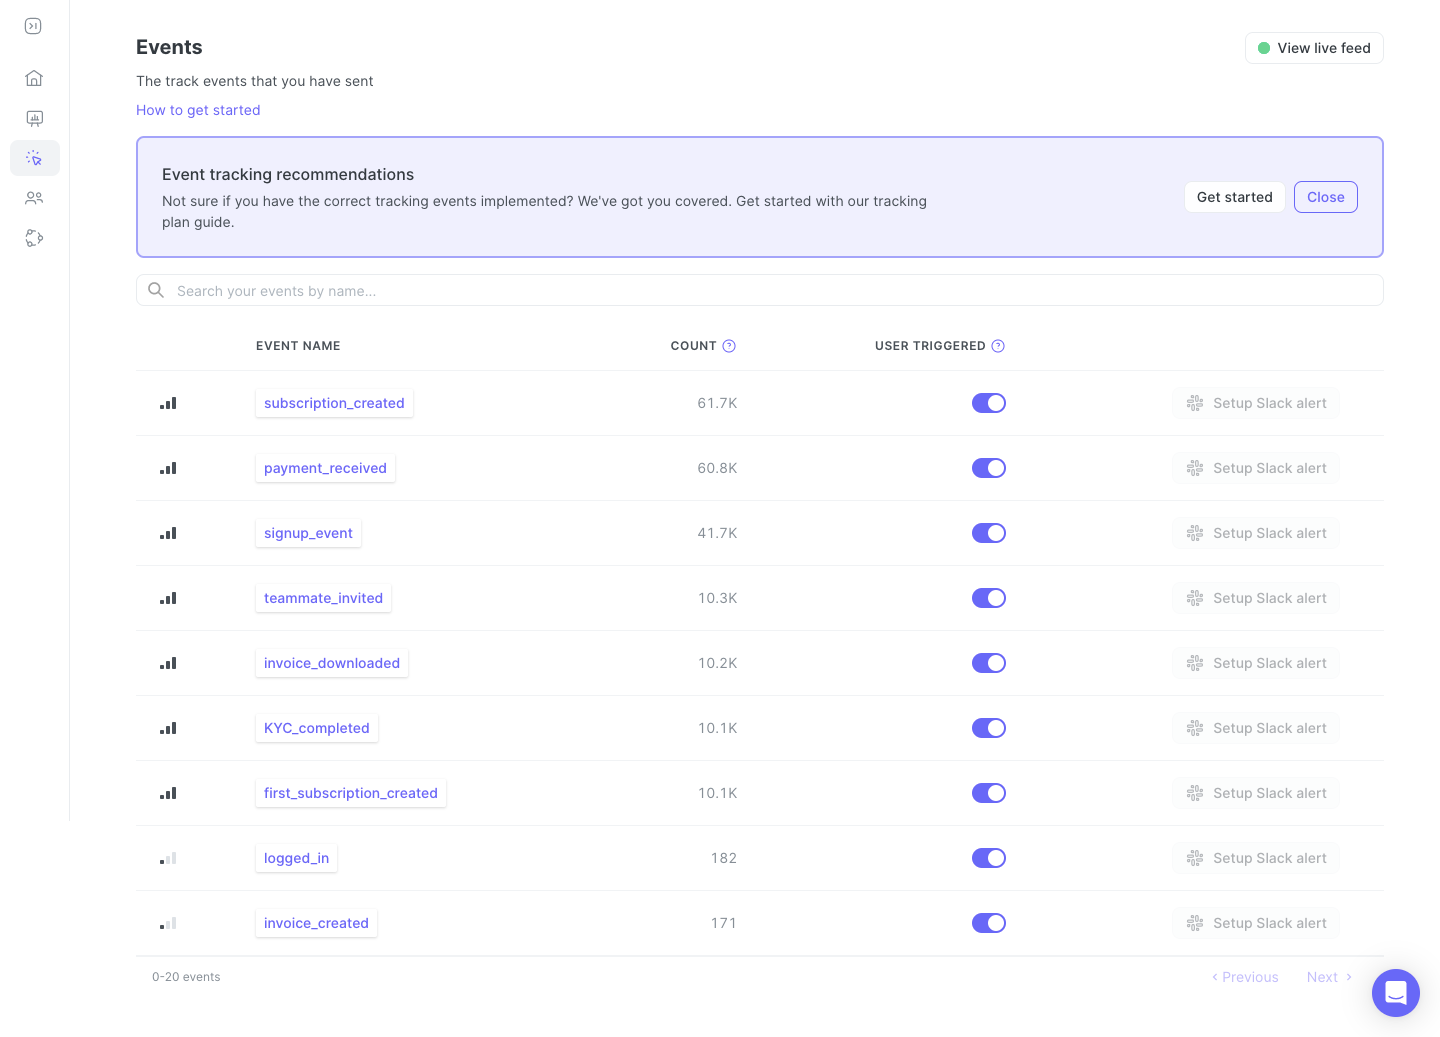
Menus reduce visual noise but increase discovery cost. Test row actions with real tasks instead of deciding purely from available space.
What to carry into your own design
Design tables from the decisions users make, then choose columns, alignment, density and actions. Also specify loading, empty, error and partial-data states: the table pattern is incomplete until it remains understandable when the dataset is not ideal.
Explore more real interfaces in the related SaaSFrame collection.