
Thank you! Your submission has been received!
Oops! Something went wrong while submitting the form.
Get SaaSFrame Pro
Monthly
$18
Quarterly
$48
Yearly
$180
Upgrade to access this feature
Browse all screens & flows
Filter and search screens & flows
Access Figma files
Access mobile versions
Bookmark screens & flows
Join now
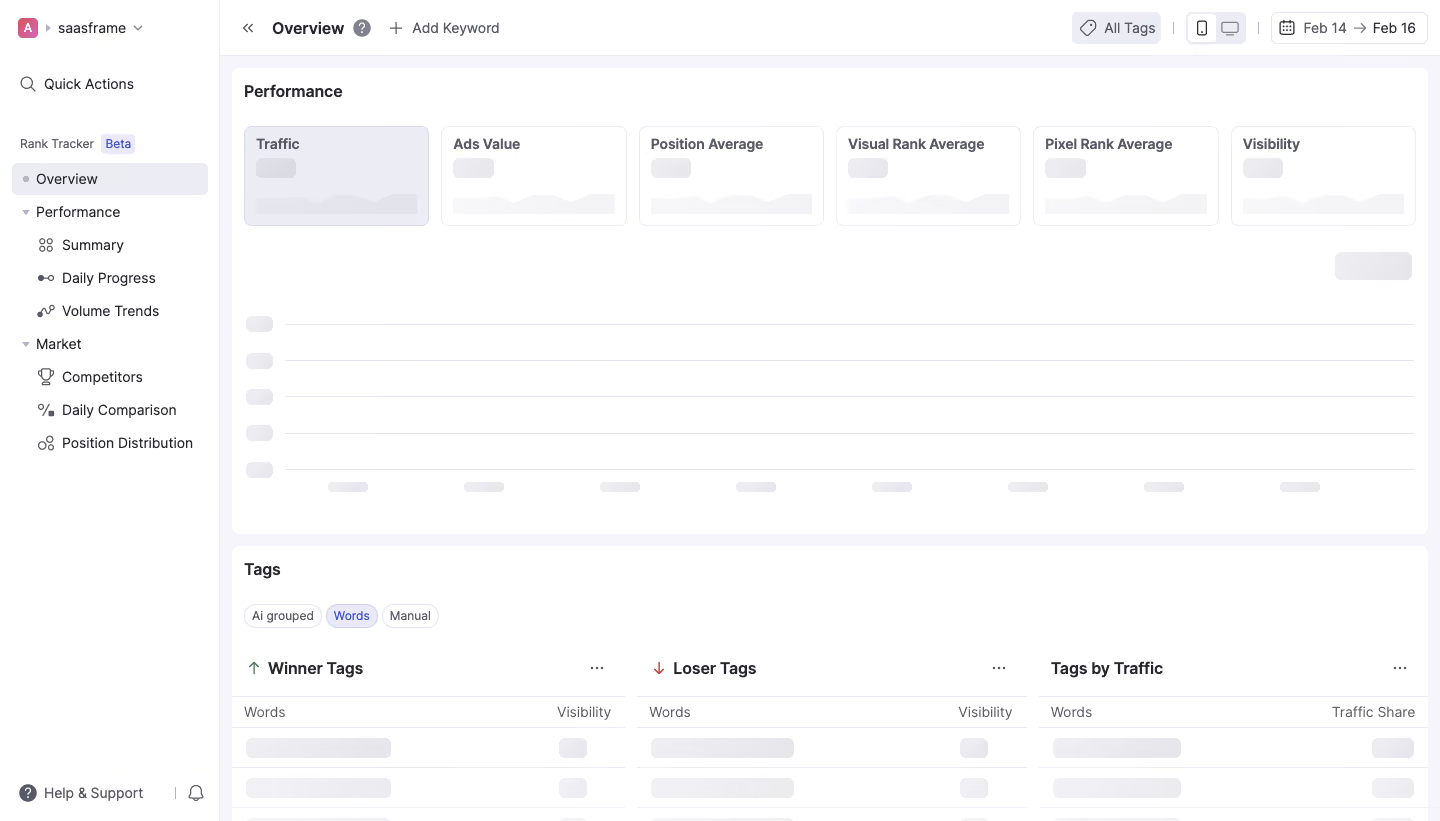
Wope Loading Dashboard

Wope
The New Era Of Rank Tracking
Designed by
No items found.

Bookmark
Bookmark

Design with AI
Thank you! Your submission has been received!
Oops! Something went wrong while submitting the form.
# Design from Reference: Wope Loading Dashboard
Create an original, high-fidelity visual design inspired by the reference. Prioritize composition, typography, colors, spacing, and component styling over technical implementation.
## Reference
- **Product:** Wope
- **Category:** Loading Screen
- **Screenshot:** https://cdn.prod.website-files.com/5e9dc792e1210c5325f7ebbc/6acbbd133b6b24eada54899a_6acbbc4e4a8f67bb0c2e16a4_cms-3b16c0d224a392822b592358.webp
Analyze the screenshot first. If inaccessible, request it rather than guessing.
## Content
{{content.instructions}}
{{content.data}}
Preserve essential messaging and factual accuracy. Adapt structure and copy length for visual balance; never invent product claims.
## Visual Design
### Overall aesthetic
- **Style:** Compact analytics dashboard with white panels, pale lavender-gray backgrounds and skeleton placeholders.
- **State:** The captured page is visibly loading; labels and navigation are present while metrics, chart values and table rows remain gray shapes.
### Page composition
- **Canvas:** Source 1440 × 821 pixels, inspected at 1400 × 798. CSS scale is unverified.
- **Sidebar:** Approximately 213px wide, with workspace selector, quick actions, grouped rank-tracking navigation and bottom support link.
- **Top toolbar:** Overview and Add Keyword sit left; tags, device toggles and date range align right.
- **Performance panel:** A wide white region begins near x225, y66. Six metric tiles sit above a large empty chart skeleton.
- **Tags panel:** A second white region begins near y531, with compact category pills and three side-by-side loading tables. Lower rows are cut off by the screenshot edge.
### Information hierarchy
- **Location:** Overview is selected in the sidebar and repeated in the toolbar.
- **Metrics:** Traffic, Ads Value, Position Average, Visual Rank Average, Pixel Rank Average and Visibility have persistent labels above loading placeholders.
- **Chart:** Horizontal gridlines, axis-label placeholders and a small control placeholder reserve the chart’s space.
- **Tag analysis:** Winner, loser and traffic-share tables form three equal content groups beneath category pills.
- **State fidelity:** No numerical metric or ranking result is visible and none should be inferred from placeholder geometry.
### Typography
- **Panel headings:** Approximately 16px semibold sans serif.
- **Navigation/body:** Around 14px regular; selected/section labels use medium weight.
- **Metric labels:** Approximately 14px semibold, with compact line height.
- **Small chips/table labels:** Around 12–14px. Exact family is unverified.
### Colors & surfaces
- **Measured base:** #FFFFFF white, #F5F5FA pale workspace and #ECEDF4 neutral selected/loading surfaces.
- **Measured boundary tones:** #E3E4EE, #EDEDF0, #EEEEF1 and #EBEBEE occur in outlines and skeleton blocks.
- **Measured text:** #25262E provides dark foreground pixels.
- **Accents:** Blue-violet selected chips and beta label, green up arrow and red down arrow provide small semantic highlights.
- **Depth:** Panels are mostly flat, separated by pale fill differences and thin borders.
### Components
- **Metric tiles:** Approximately 180 × 97px, thin pale border, 8px radius and 12px padding. The first tile has a lavender-tinted fill.
- **Skeletons:** Small rounded value blocks and low-contrast area-chart silhouettes sit inside each metric tile.
- **Chart skeleton:** Broad horizontal rules with short rounded labels along the left and bottom; no actual data series is rendered.
- **Category pills:** Small outlined rounded chips; Words is visibly highlighted.
- **Tables:** Three roughly equal columns with headings, overflow dots, column labels and repeated gray rounded placeholders.
- **Toolbar controls:** Outlined date picker, tag chip and compact device toggle. No dropdown or hover state is visible.
### Visual rhythm
- **Spacing:** About 12px panel padding and 12–14px gaps separate metric cards; the two major panels are about 12px apart.
- **Chart cadence:** Five horizontal rows and evenly spaced bottom labels provide a stable loading layout.
- **Navigation:** Indented subitems and roughly 32px row pitch make hierarchy compact.
- **Stability:** Placeholder shapes preserve the eventual metric/table structure without asserting the loaded data.
### Responsive
- **Observed scope:** Desktop loading view only; loaded and mobile states are unverified.
- **Recommended metrics:** Reflow six tiles into fewer columns while preserving labels.
- **Recommended shell:** Collapse sidebar and wrap toolbar controls before reducing chart readability.
- **Recommended tables:** Stack analysis groups or allow contained scrolling; maintain skeleton dimensions to reduce layout shifts.
### Adaptation guidance
- **Preserve:** Persistent labels, reserved chart/table space and low-contrast loading shapes.
- **State design:** Provide accessible loading announcements and transition to real values without inventing numbers.
- **Implementation:** Reuse the same card and table geometry for loading, empty, error and loaded states.
- **Motion:** If shimmer is added, keep it subtle and respect reduced-motion preferences; motion is not demonstrated by this image.
Use this context to reproduce the reference's visual language: layout, typography, colors, spacing, borders, radii, and distinctive elements. The screenshot takes priority if descriptions conflict.
## Direction
{{preferences.fidelityInstructions}}
## Output
{{output.instructions}}
Deliver a polished, cohesive design with precise alignment, hierarchy, and spacing. Produce the requested visual artifact, not just a description. If unsupported, explain the limitation.


Category
Patterns
Tech Stack

Added on
February 16, 2023
Similar screens




Upgrade to SaaSFrame Pro now to see similar examples.
Monthly
$18 /month
Billed $18 monthly
Browse all screens & flows
Filter and search screens & flows
Search text in screenshots
Access Figma files
Access mobile versions
Join now
Quarterly
$16 /month
Billed $48 quarterly
Browse all screens & flows
Filter and search screens & flows
Search text in screenshots
Access Figma files
Access mobile versions
Join now
Yearly
$15 /month
Billed $180 yearly
Browse all screens & flows
Filter and search screens & flows
Search text in screenshots
Access Figma files
Access mobile versions
Join now