Generate a new design based on this screen using your own content.
Thank you! Your submission has been received!
Oops! Something went wrong while submitting the form.
# Design from Reference: June SaaS Product Metrics Benchmark
Create an original, high-fidelity visual design inspired by the reference. Prioritize composition, typography, colors, spacing, and component styling over technical implementation.
## Reference
- **Product:** June
- **Category:** Free Side Product
- **Screenshot:** https://cdn.prod.website-files.com/5e9dc792e1210c5325f7ebbc/6acb726bb10d21a746c47c2e_6acb6f1259427db08a8af2f8_cms-fa766a7b3fecd7b4169d3191.webp
Analyze the screenshot first. If inaccessible, request it rather than guessing.
## Content
{{content.instructions}}
{{content.data}}
Preserve essential messaging and factual accuracy. Adapt structure and copy length for visual balance; never invent product claims.
## Visual Design
Use this context to reproduce the reference's visual language: layout, typography, colors, spacing, borders, radii, and distinctive elements. The screenshot takes priority if descriptions conflict.
## Direction
{{preferences.fidelityInstructions}}
## Output
{{output.instructions}}
Deliver a polished, cohesive design with precise alignment, hierarchy, and spacing. Produce the requested visual artifact, not just a description. If unsupported, explain the limitation.
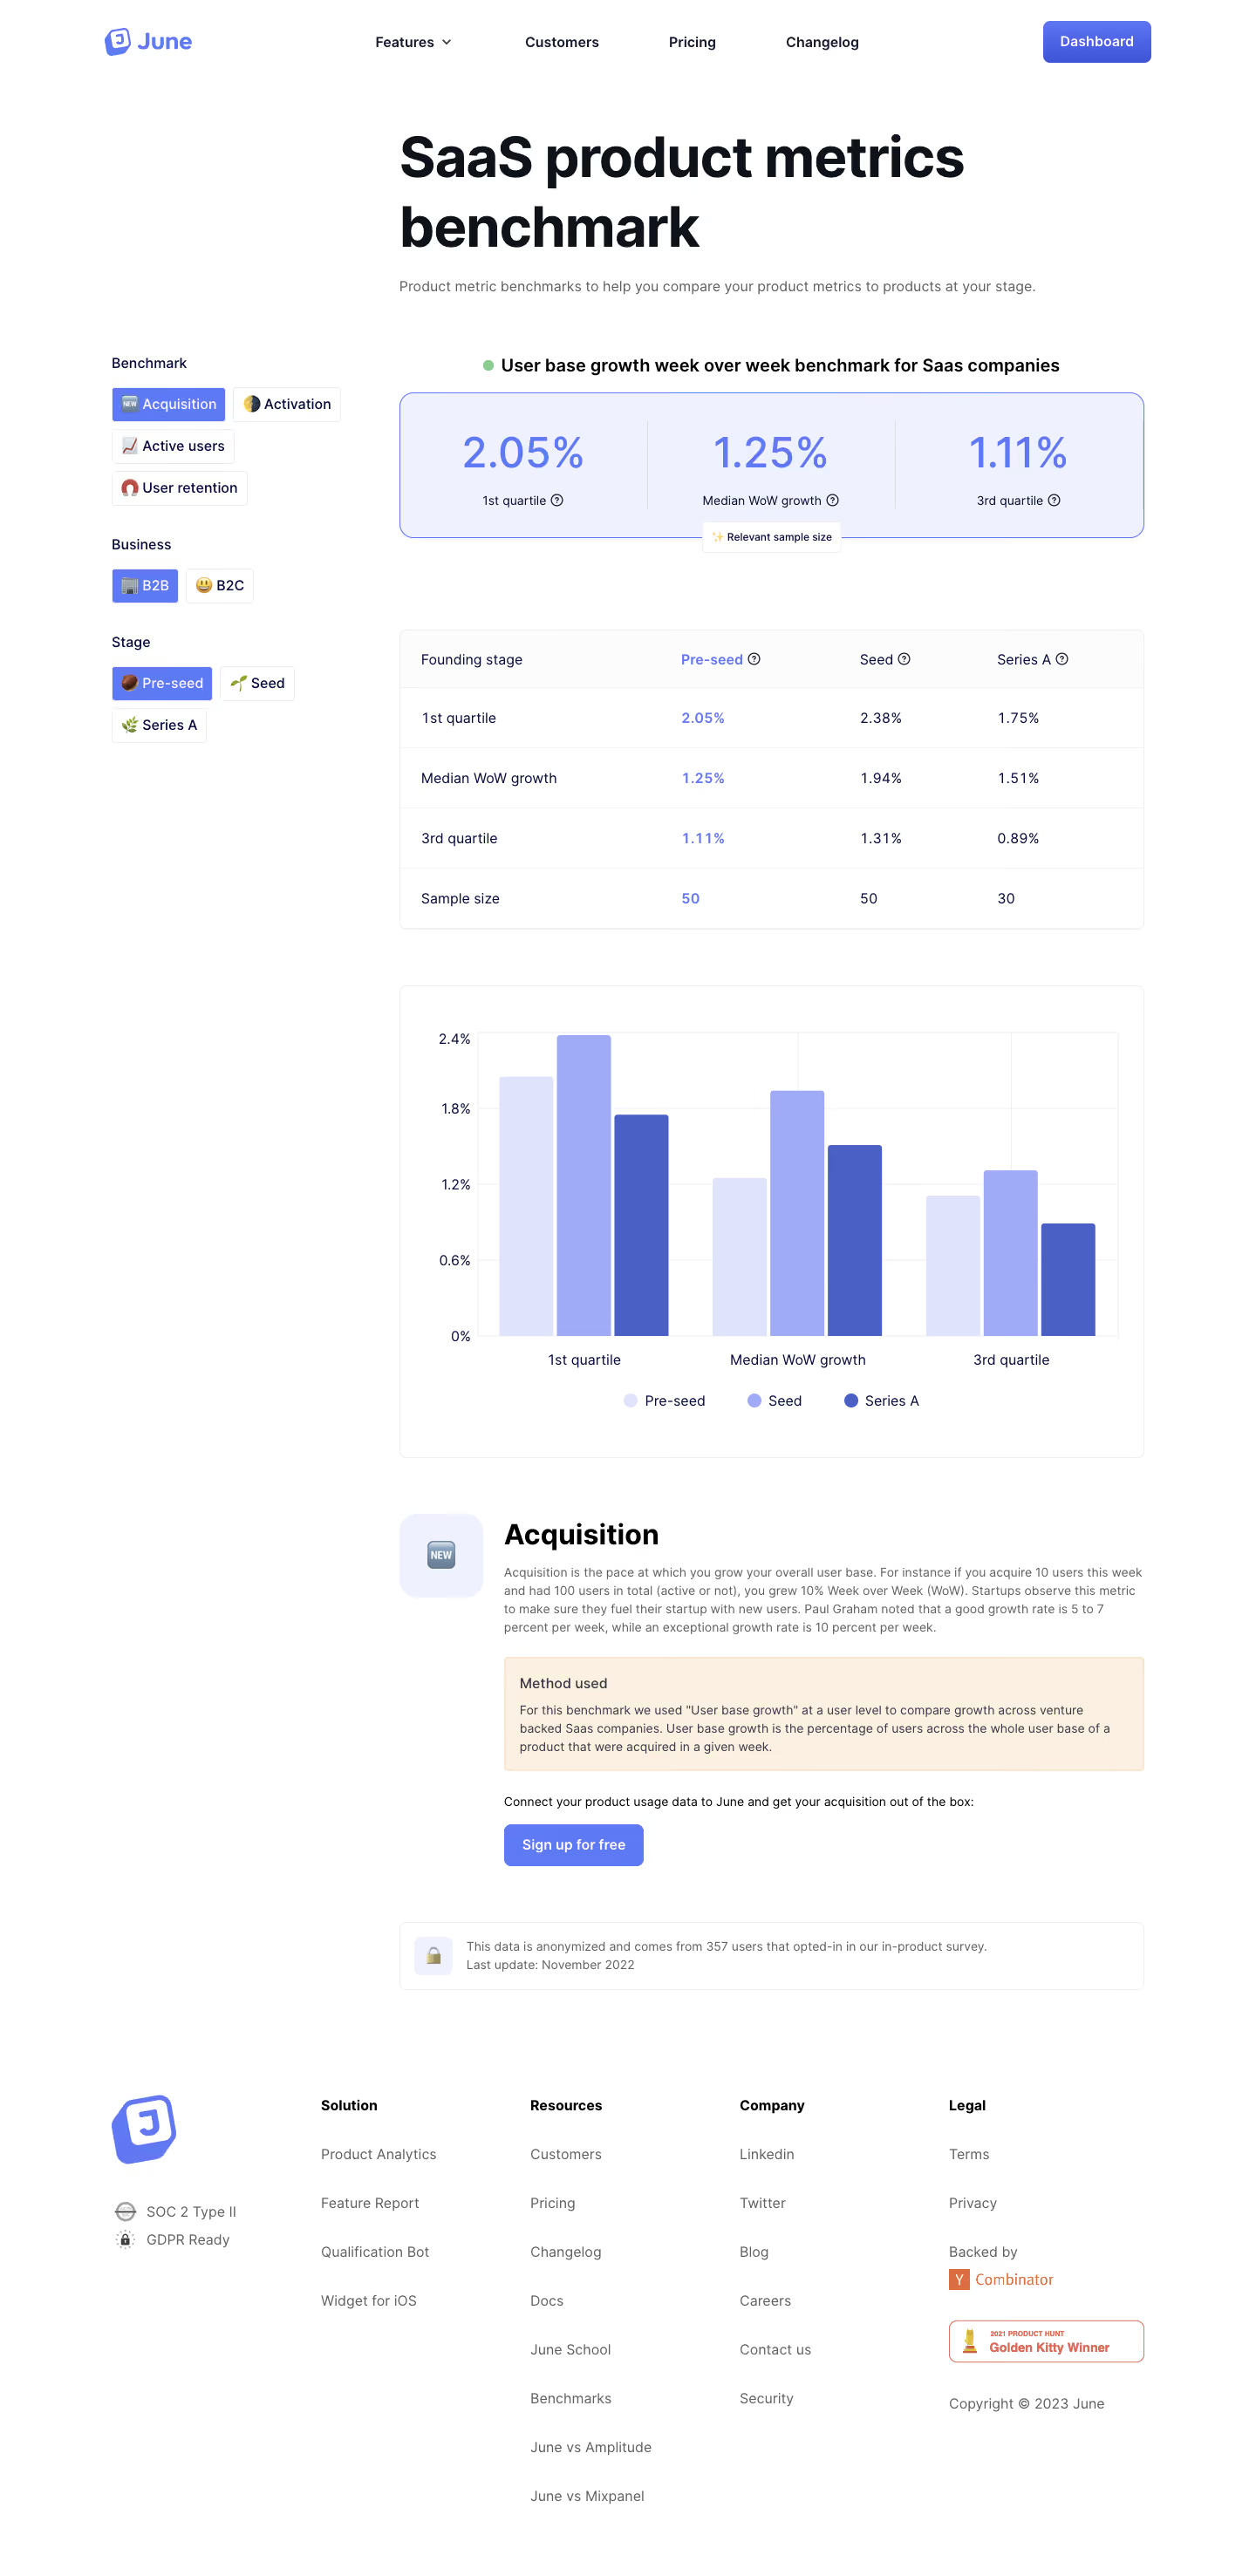
June’s Benchmarks page embraces a sleek, minimalist approach with a sharp modern edge. The aesthetic is exceptionally clean—ample white space, muted monochrome backgrounds, and well-balanced pops of color deliver visual calm and immediate focus. The tone feels friendly yet professional, exuding confidence and approachability without appearing flashy.
Layout and Structure
The page is precisely structured to guide the visitor—from a concise hero section with a clear purpose to segmented data-driven content. Sticky navigation keeps essential links visible, while modular sections break content into digestible, scrollable blocks. There are no distracting feature overloads, just streamlined content with data visualizations and actionable insights.
Visual Elements
Sophisticated data visualizations take center stage, using custom charts and graphs with smooth micro-interactions. Subtle animations enliven numerical changes and hover states, making benchmark comparisons engaging. Strategic icon use in cards reinforces ideas without clutter, while the absence of stock photography or illustration keeps attention on product capabilities.
Color Palette and Typography
A refined palette pairs white and soft grays with accent blues and purples—accents cue interactivity and guide focus. Typography is bold and geometric for headings, paired with legible sans-serif for body copy, creating a seamless hierarchy that aids quick scanning. Graph data uses color to categorize and emphasize trends.
User Experience Patterns
Navigation is kept persistent yet unobtrusive; CTAs (primary buttons, contextual links) are distinct but never intrusive. Interaction cues are subtle—micro-animations, hover effects, and intuitive filtering on charts enhance usability. No forms clutter the journey, keeping friction low for benchmarking exploration.
Unique Design Choices & Tone
What sets this page apart is its use of real, live SaaS data in visually interactive ways, avoiding “template” patterns common in SaaS. The page feels transparent, insightful, and forward-thinking—a design that builds trust and invites discovery for data-driven makers.