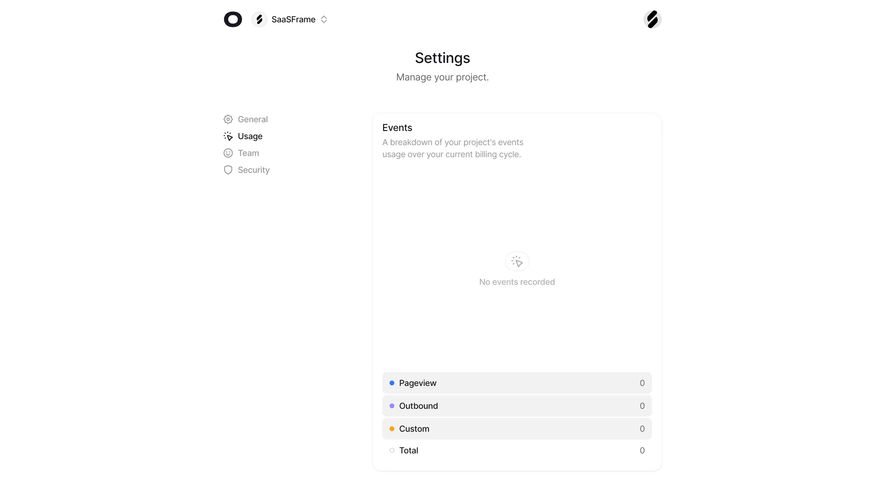
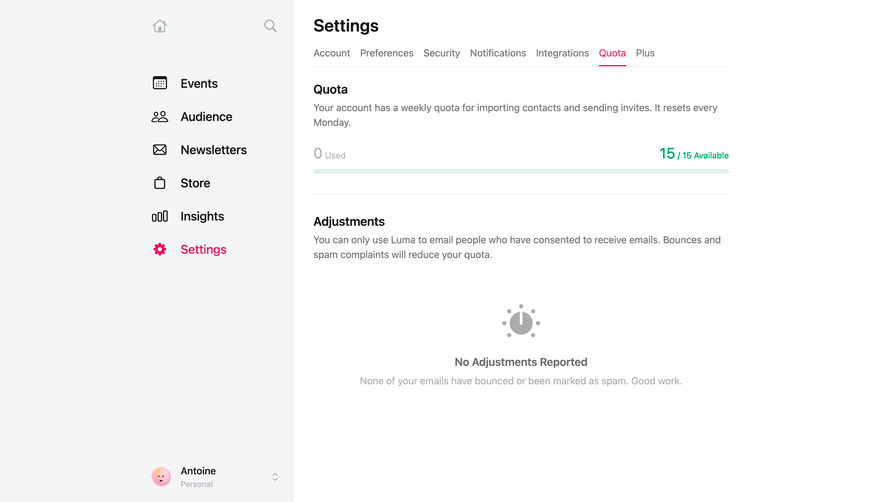
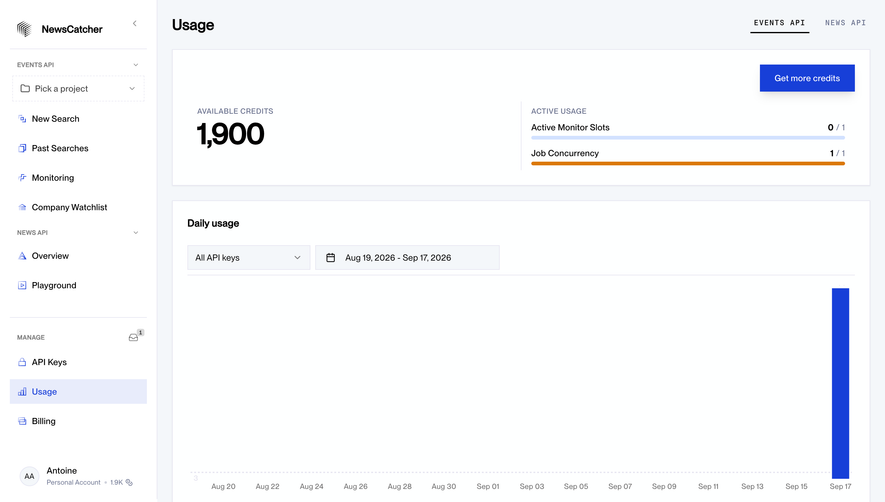
Generate a new design based on this screen using your own content.
Thank you! Your submission has been received!
Oops! Something went wrong while submitting the form.
# Design from Reference: Claude API Usage
Create an original, high-fidelity visual design inspired by the reference. Prioritize composition, typography, colors, spacing, and component styling over technical implementation.
## Reference
- **Product:** Claude
- **Category:** Usage
- **Screenshot:** https://cdn.prod.website-files.com/5e9dc792e1210c5325f7ebbc/69971c3ac1c9a6ce495732c5_saQIobjaQme5AvAj6g0MJkh7sT5Te6bTXQd1TbJktFk.avif
Analyze the screenshot first. If inaccessible, request it rather than guessing.
## Content
{{content.instructions}}
{{content.data}}
Preserve essential messaging and factual accuracy. Adapt structure and copy length for visual balance; never invent product claims.
## Visual Design
Use this context to reproduce the reference's visual language: layout, typography, colors, spacing, borders, radii, and distinctive elements. The screenshot takes priority if descriptions conflict.
## Direction
{{preferences.fidelityInstructions}}
## Output
{{output.instructions}}
Deliver a polished, cohesive design with precise alignment, hierarchy, and spacing. Produce the requested visual artifact, not just a description. If unsupported, explain the limitation.
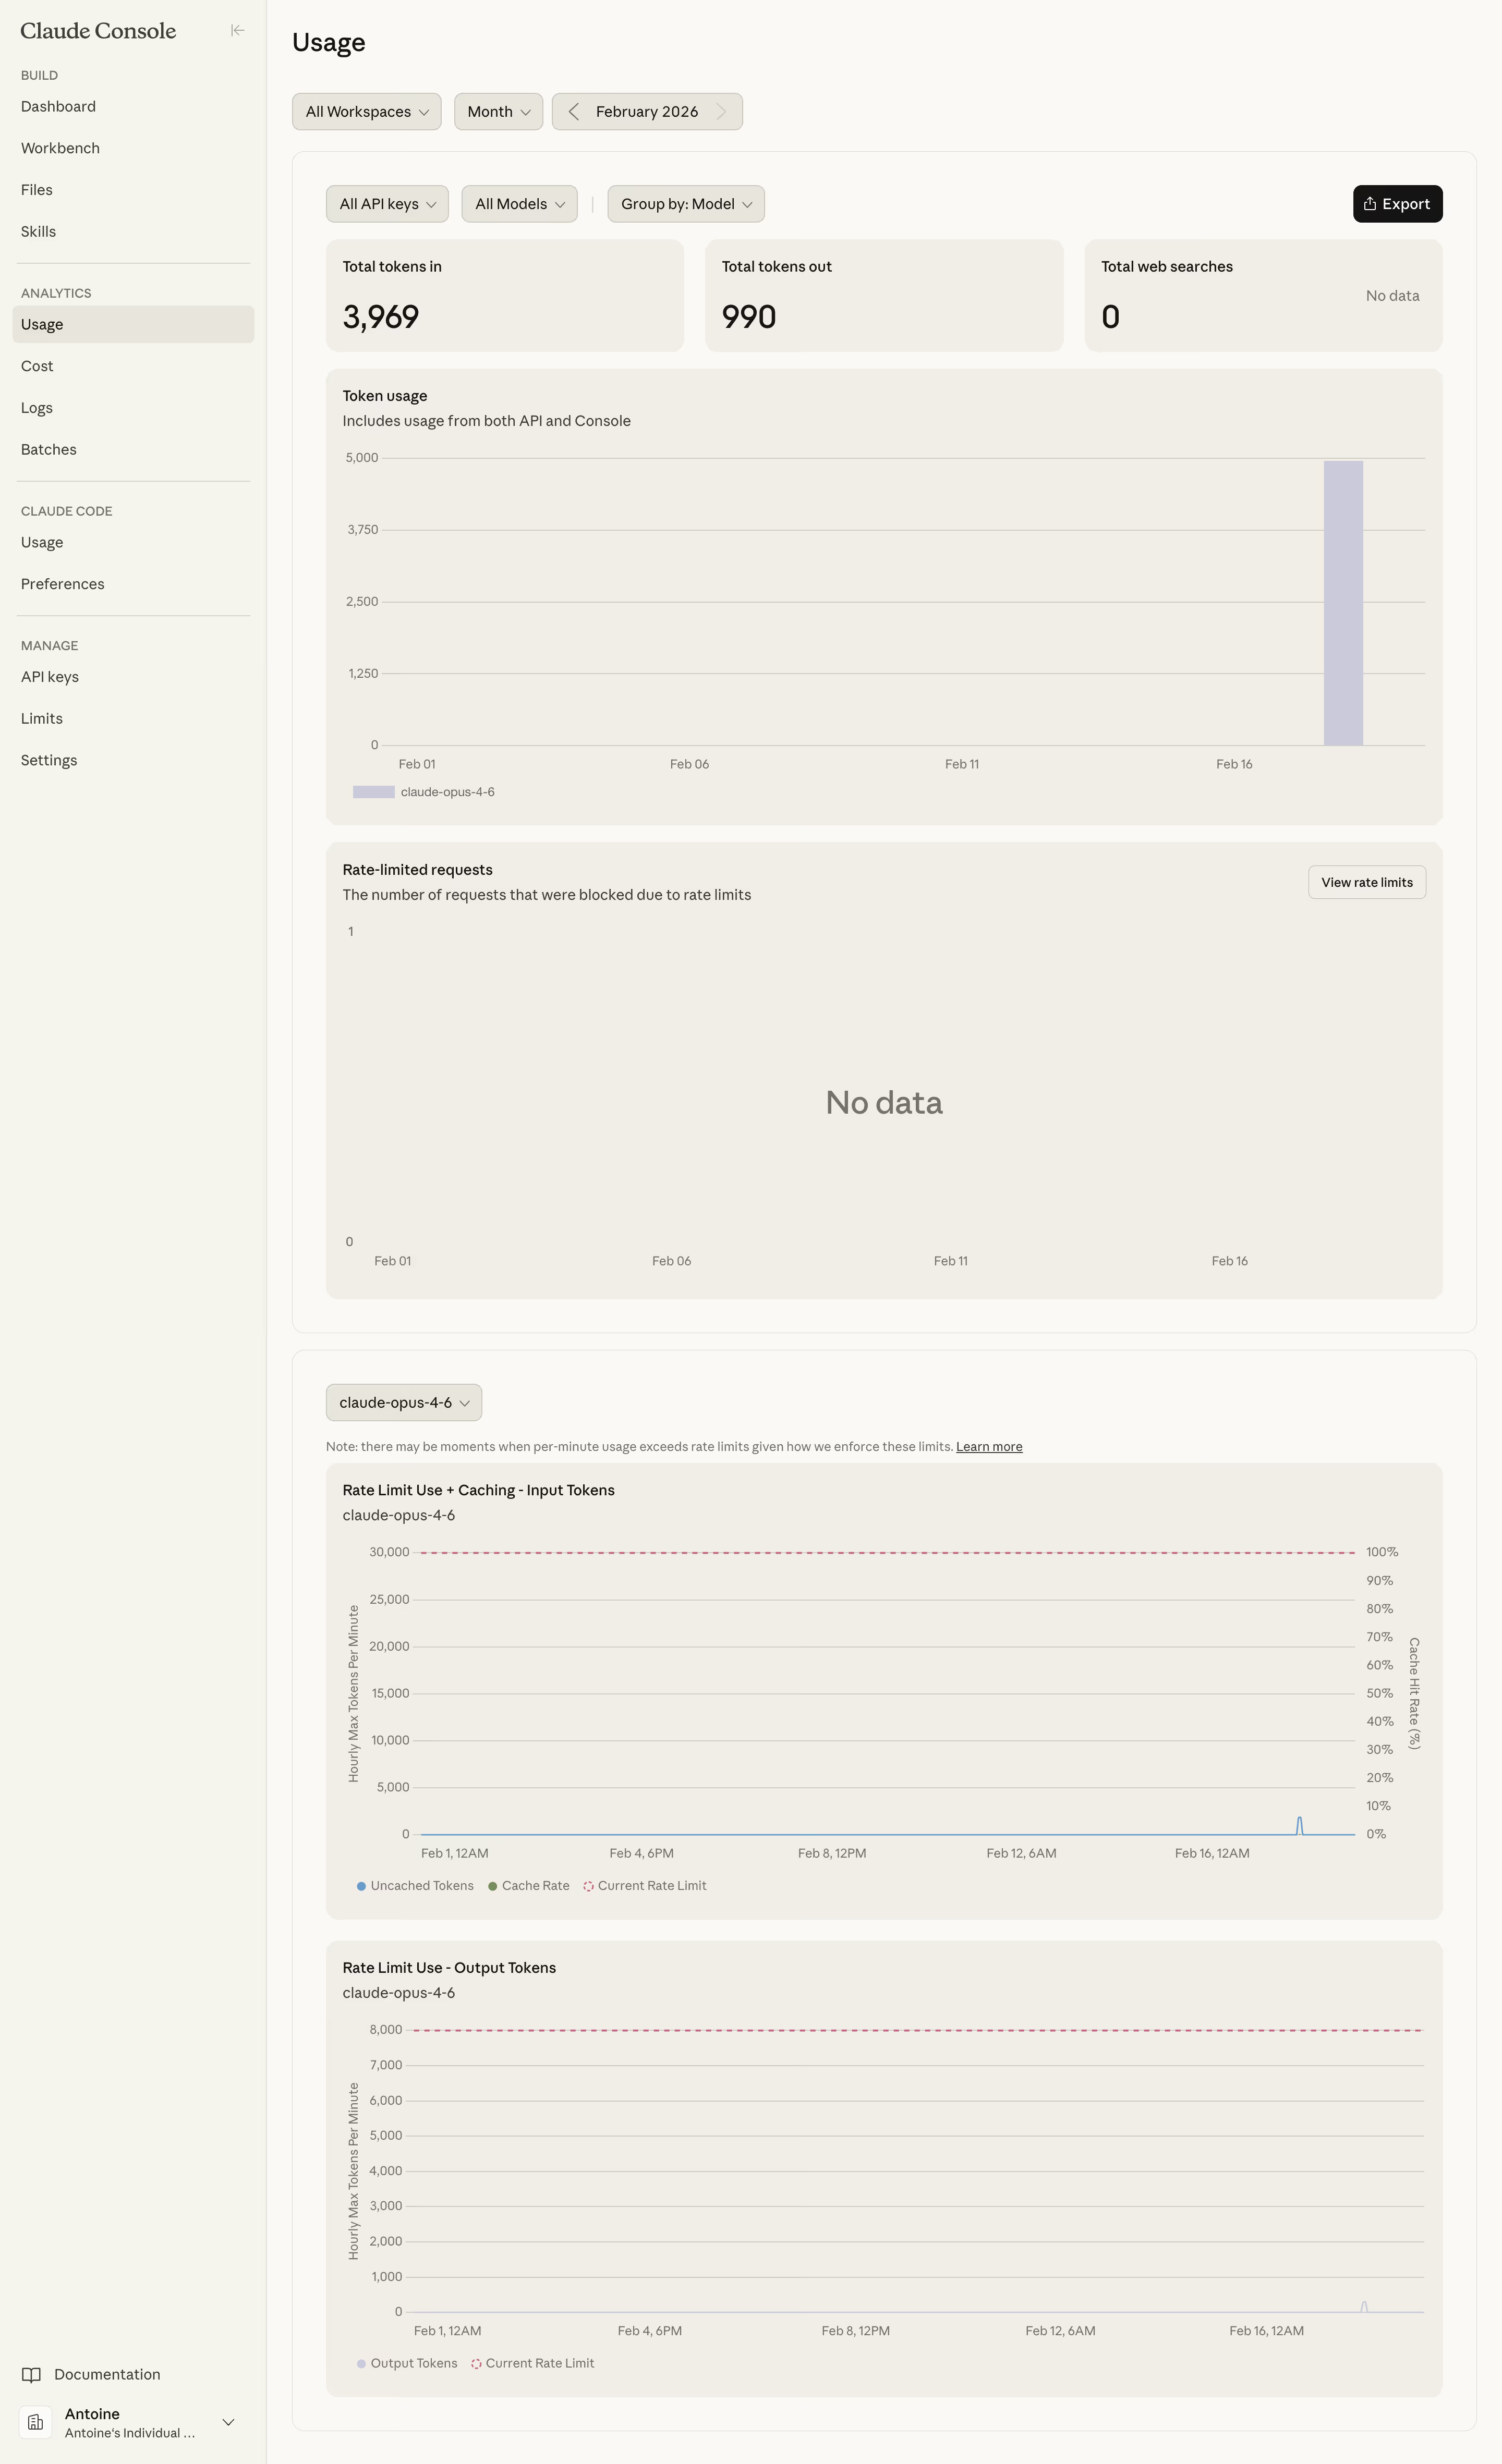
First thing you notice is the warm beige background. It's not the typical cold white SaaS dashboard and it instantly feels more considered. Anthropic's Claude Console usage page proves that data-heavy screens don't need to look clinical.
Data Without the Noise
The layout is super methodical. Big stat cards up top (3,969 tokens in, 990 out) give you the headline numbers immediately. Then it flows into time-series charts that are clean but not oversimplified. The "No data" empty state for rate-limited requests is handled gracefully with just plain text. No sad illustrations, no filler. The pill-shaped filter controls at the top feel tactile and well-grouped.
Typography and Color Doing the Heavy Lifting
Everything is set in what looks like a clean sans-serif, probably their custom system font. The muted purplish-gray bar charts against that cream canvas create just enough contrast without screaming. One standout detail: the rate limit charts at the bottom use dashed lines for limits versus solid for actual usage. Smart visual encoding. The left sidebar stays quiet with its light gray hierarchy labels like BUILD, ANALYTICS, MANAGE. Understated but scannable.