Design with AI
Generate a new design based on this screen using your own content.
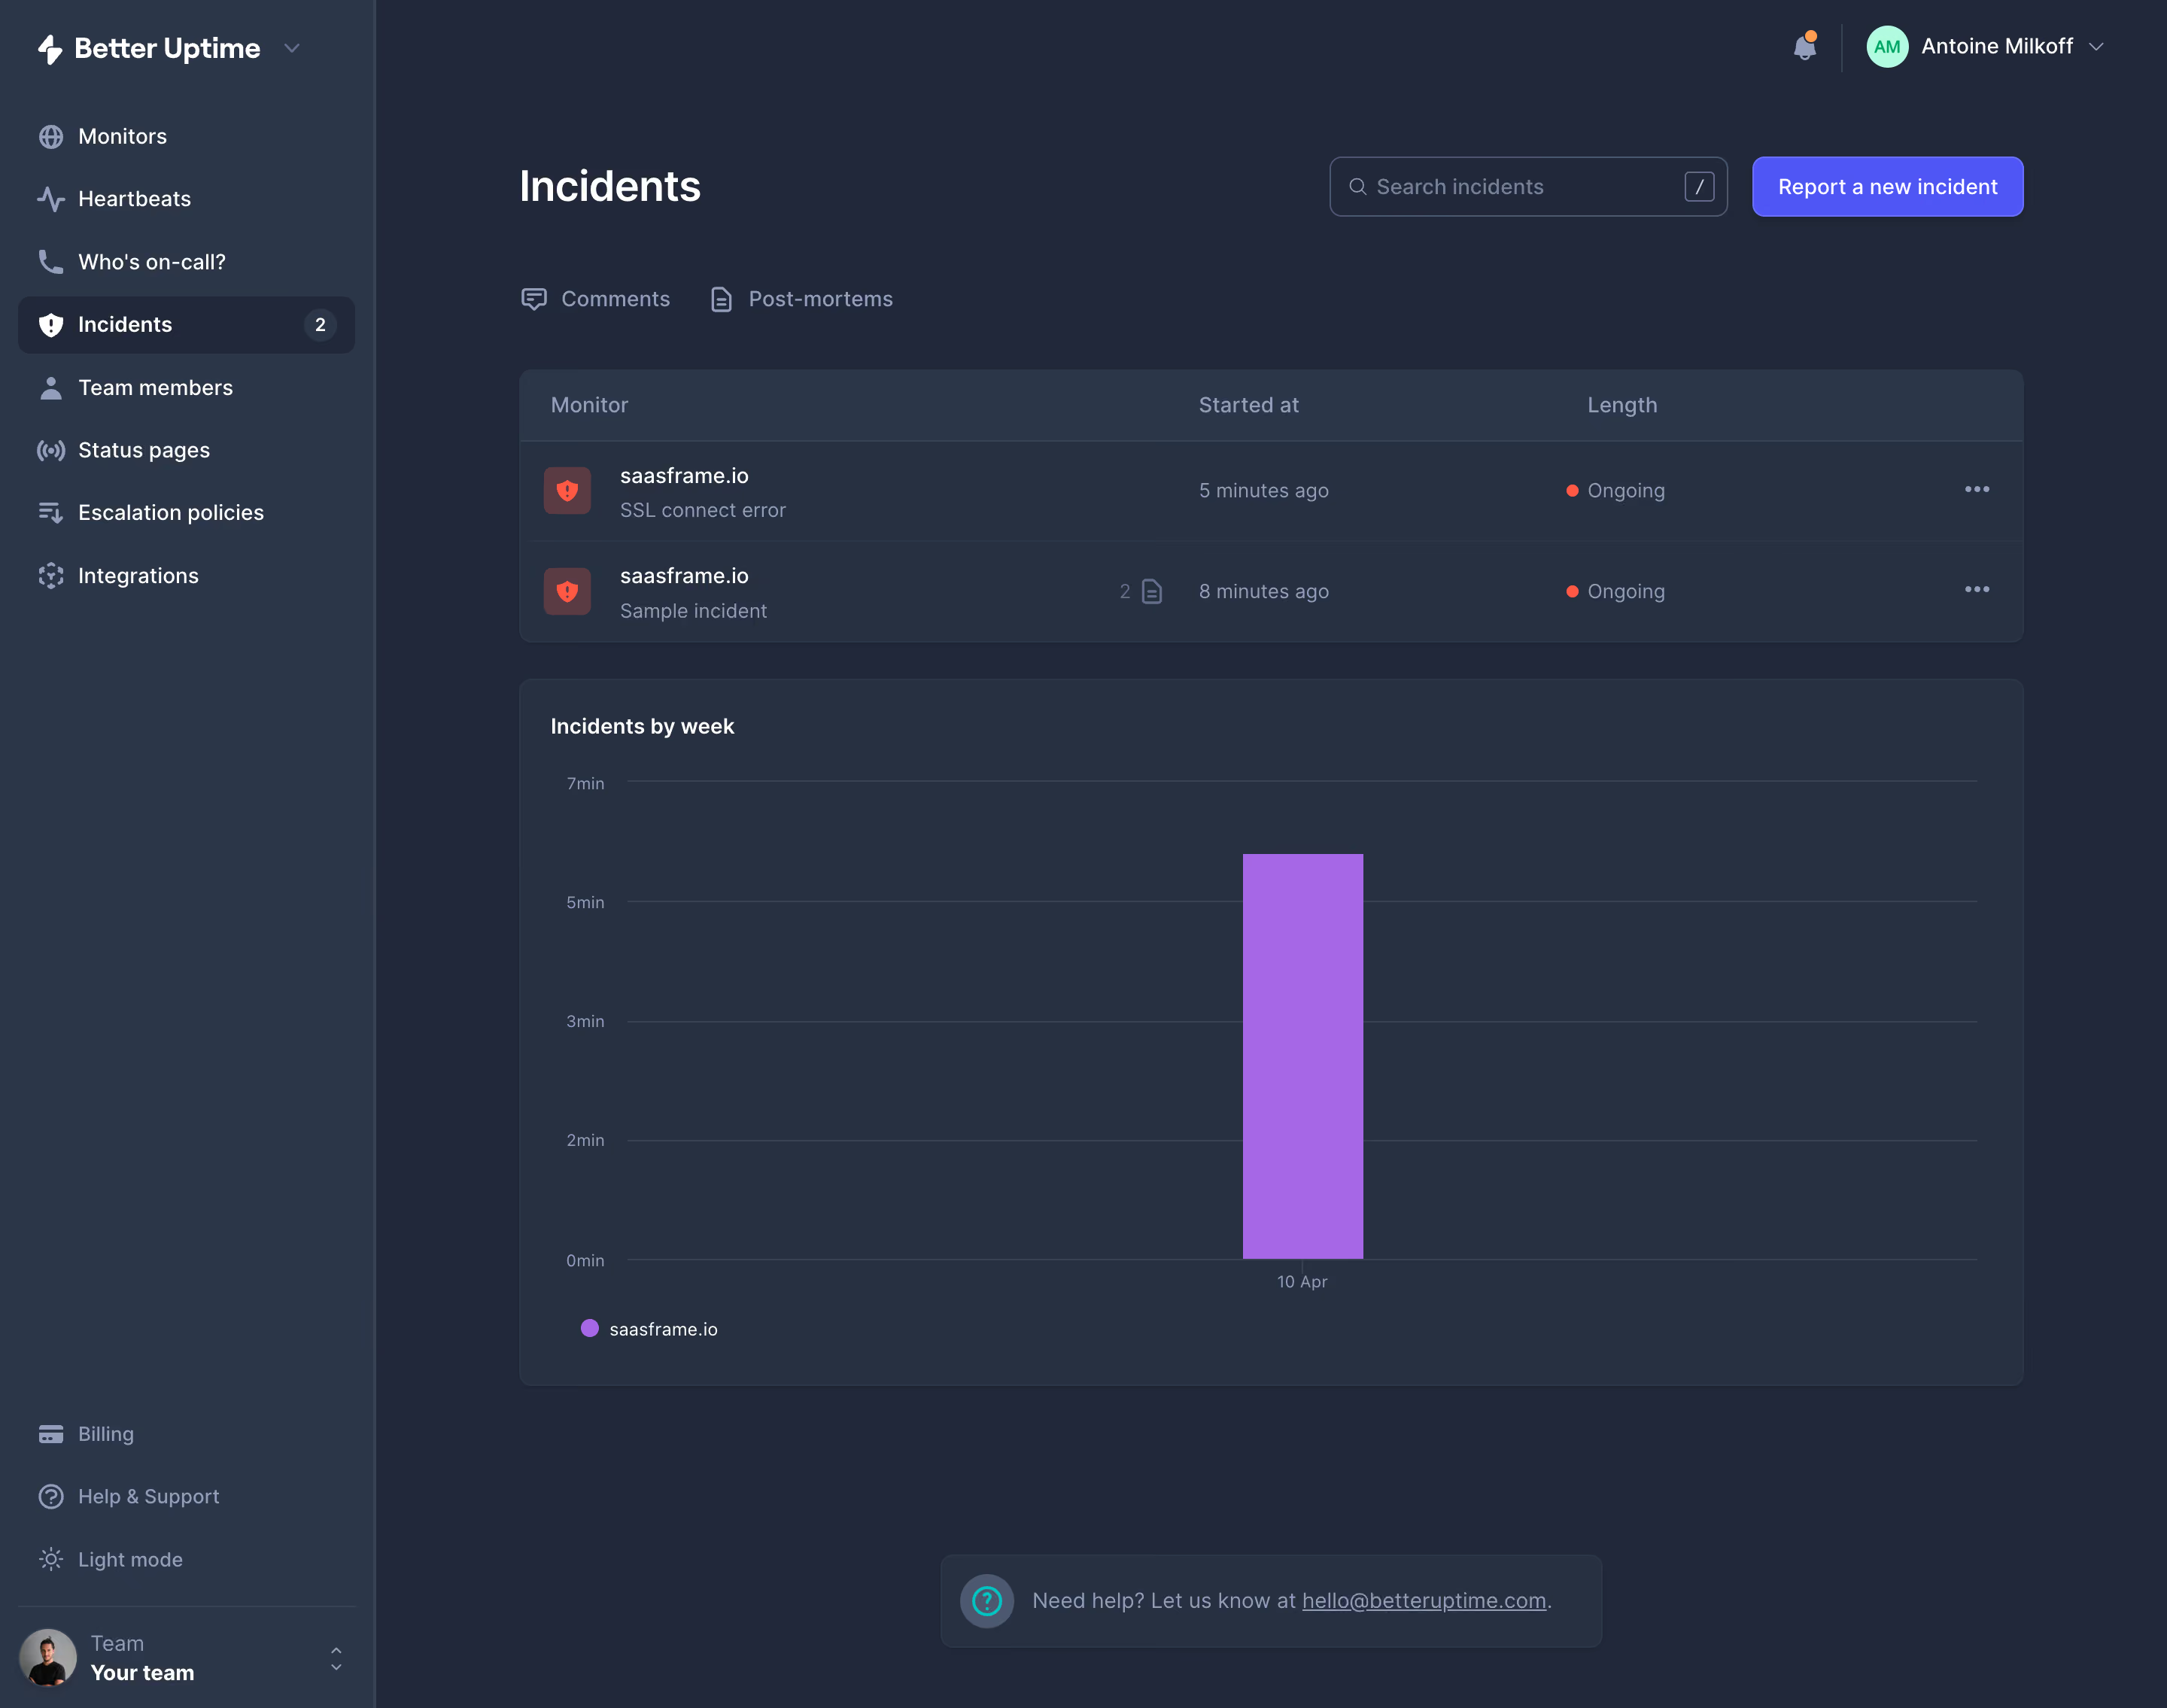
# Design from Reference: Better Stack etter Uptime Incidents Dashboard
Create an original, high-fidelity visual design inspired by the reference. Prioritize composition, typography, colors, spacing, and component styling over technical implementation.
## Reference
- **Product:** Better Stack
- **Category:** Dashboard
- **Screenshot:** https://cdn.prod.website-files.com/5e9dc792e1210c5325f7ebbc/6acbb9bbd1be8ecd2912dde4_6acb6a055391d62536b62679_cms-d76ec83973593603ab1cd92f.webp
Analyze the screenshot first. If inaccessible, request it rather than guessing.
## Content
{{content.instructions}}
{{content.data}}
Preserve essential messaging and factual accuracy. Adapt structure and copy length for visual balance; never invent product claims.
## Visual Design
### Overall aesthetic
- **Character:** Dense, dark monitoring workspace with restrained violet accents and operational status cues.
### Page composition
- **Canvas:** Screenshot measures 2880 × 2270 px; estimated CSS dimensions below assume a 2× capture.
- **Structure:** Full-height left navigation, main incident header and two-row table, then a large weekly chart. Sidebar is approximately 250 CSS px wide; main gutters approximately 32 px.
### Information hierarchy
- **Priority:** Incidents heading and Report new incident action lead; ongoing incident rows precede historical trend analysis.
- **Navigation:** Selected Incidents item has a count badge; Comments and Post-mortems form a secondary tab row.
### Typography
- **Family:** Neutral interface sans serif; exact font unverified.
- **Scale:** Estimated CSS title 28 px, table and navigation 14 px, chart labels 12 px; medium-weight headings and muted supporting text.
### Colors & surfaces
- **Sampled palette:** Canvas #212839; panels #263041; sidebar #2C3649; fine borders #384255; primary action #4F56F5; chart bar #A567E5.
- **Status:** Red status dots and shield tiles distinguish active incidents from the cool blue-gray interface.
### Components
- **Table:** Two compact incident rows, aligned monitor/time/duration columns and trailing overflow controls.
- **Chart:** Thin horizontal grid lines, minute labels and one prominent violet vertical bar.
- **Surfaces:** Estimated 8 px panel radii and 1 px borders; search and action controls approximately 36–40 px tall.
### Visual rhythm
- **Spacing:** Tight navigation rows contrast with generous chart area. Approximately 24–32 px separates major blocks.
### Responsive
- **Observed:** Desktop only.
- **Adaptation:** Collapse navigation on narrow screens; allow table scrolling and retain status labels alongside color. Keep chart axes readable.
### Adaptation guidance
- **Preserve:** Dark layered surfaces, restrained borders, compact incident rows and clear operational hierarchy.
- **Replace:** Use actual monitoring data and actions; reserve violet for primary actions and chart emphasis.
Use this context to reproduce the reference's visual language: layout, typography, colors, spacing, borders, radii, and distinctive elements. The screenshot takes priority if descriptions conflict.
## Direction
{{preferences.fidelityInstructions}}
## Output
{{output.instructions}}
Deliver a polished, cohesive design with precise alignment, hierarchy, and spacing. Produce the requested visual artifact, not just a description. If unsupported, explain the limitation.