

Shortcut
October 21, 2026
Shortcut rebuilds reporting charts with drill-down tables
What changes
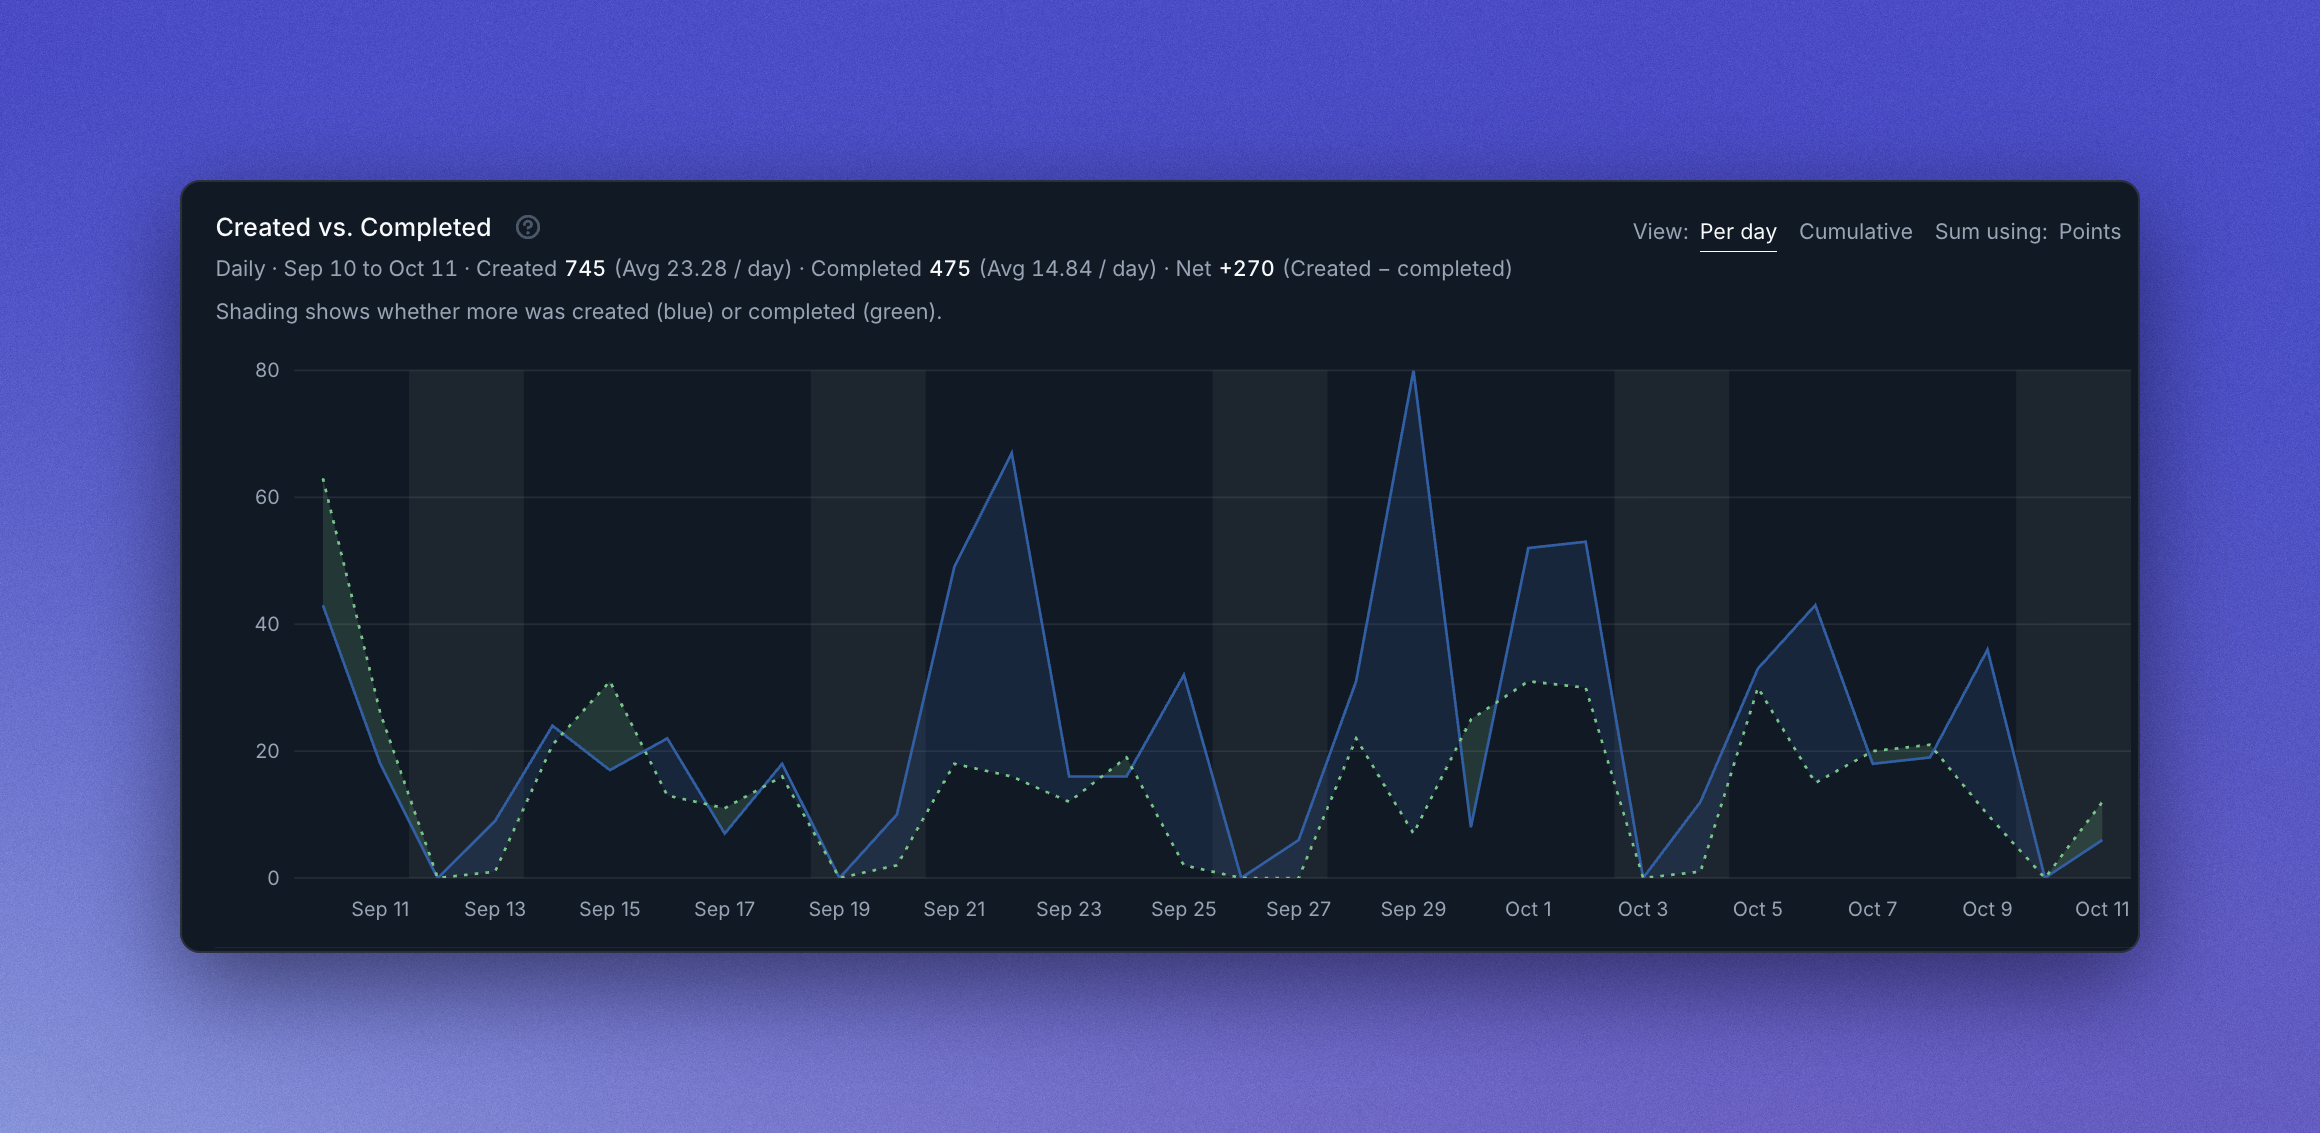
Shortcut rebuilt six report charts with consistent formatting and dark mode, added a Created vs. Completed chart, and lets users click Time Spent or Cycle Time data points to inspect the underlying Stories in tables.
Why it's interesting
Teams can move from a high-level trend to the exact work behind a metric without leaving the reporting flow.