Comparison
20
Win the competitive landscape with SaaS Comparison patterns. Use side-by-side feature tables and 'Us vs. Them' checklists to highlight your unique selling points and help buyers make informed decisions.

A SaaS comparison section helps visitors evaluate alternatives using explicit criteria. It can compare products, implementation approaches, or the product's proposed benefit against another route. The design is useful when it clarifies a real choice, but it needs consistent definitions and maintained evidence to avoid turning visual persuasion into misleading certainty.
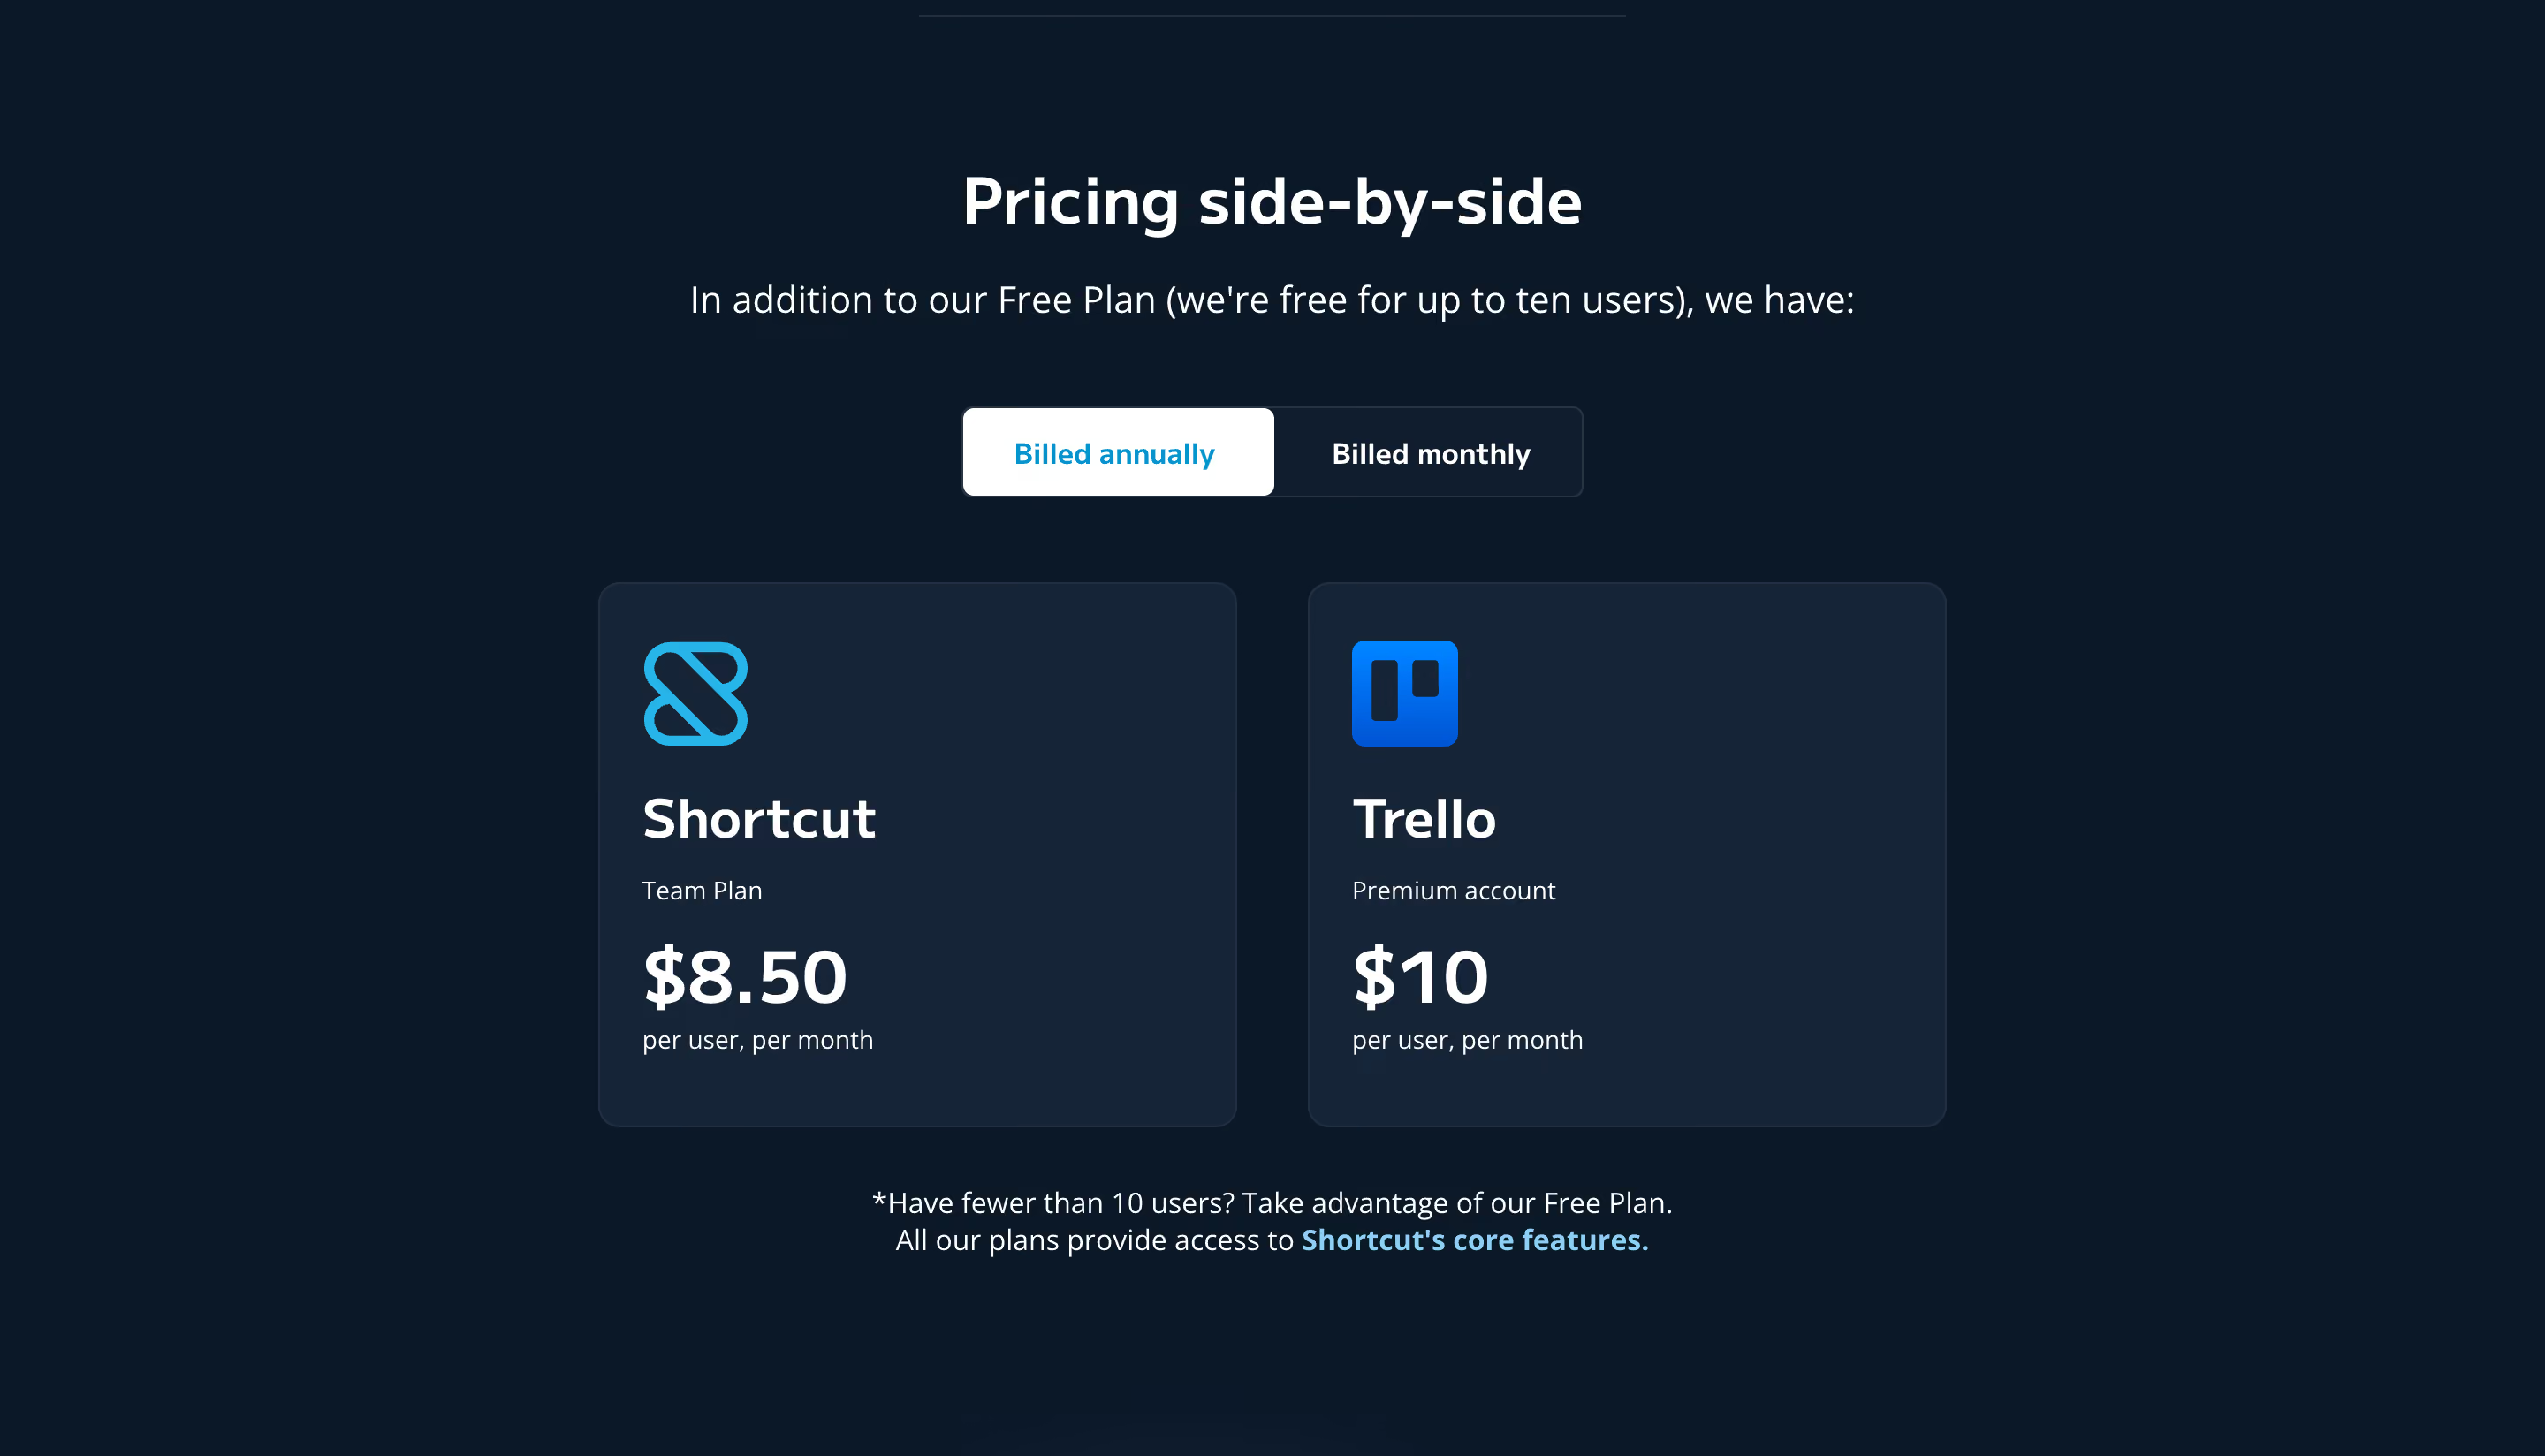
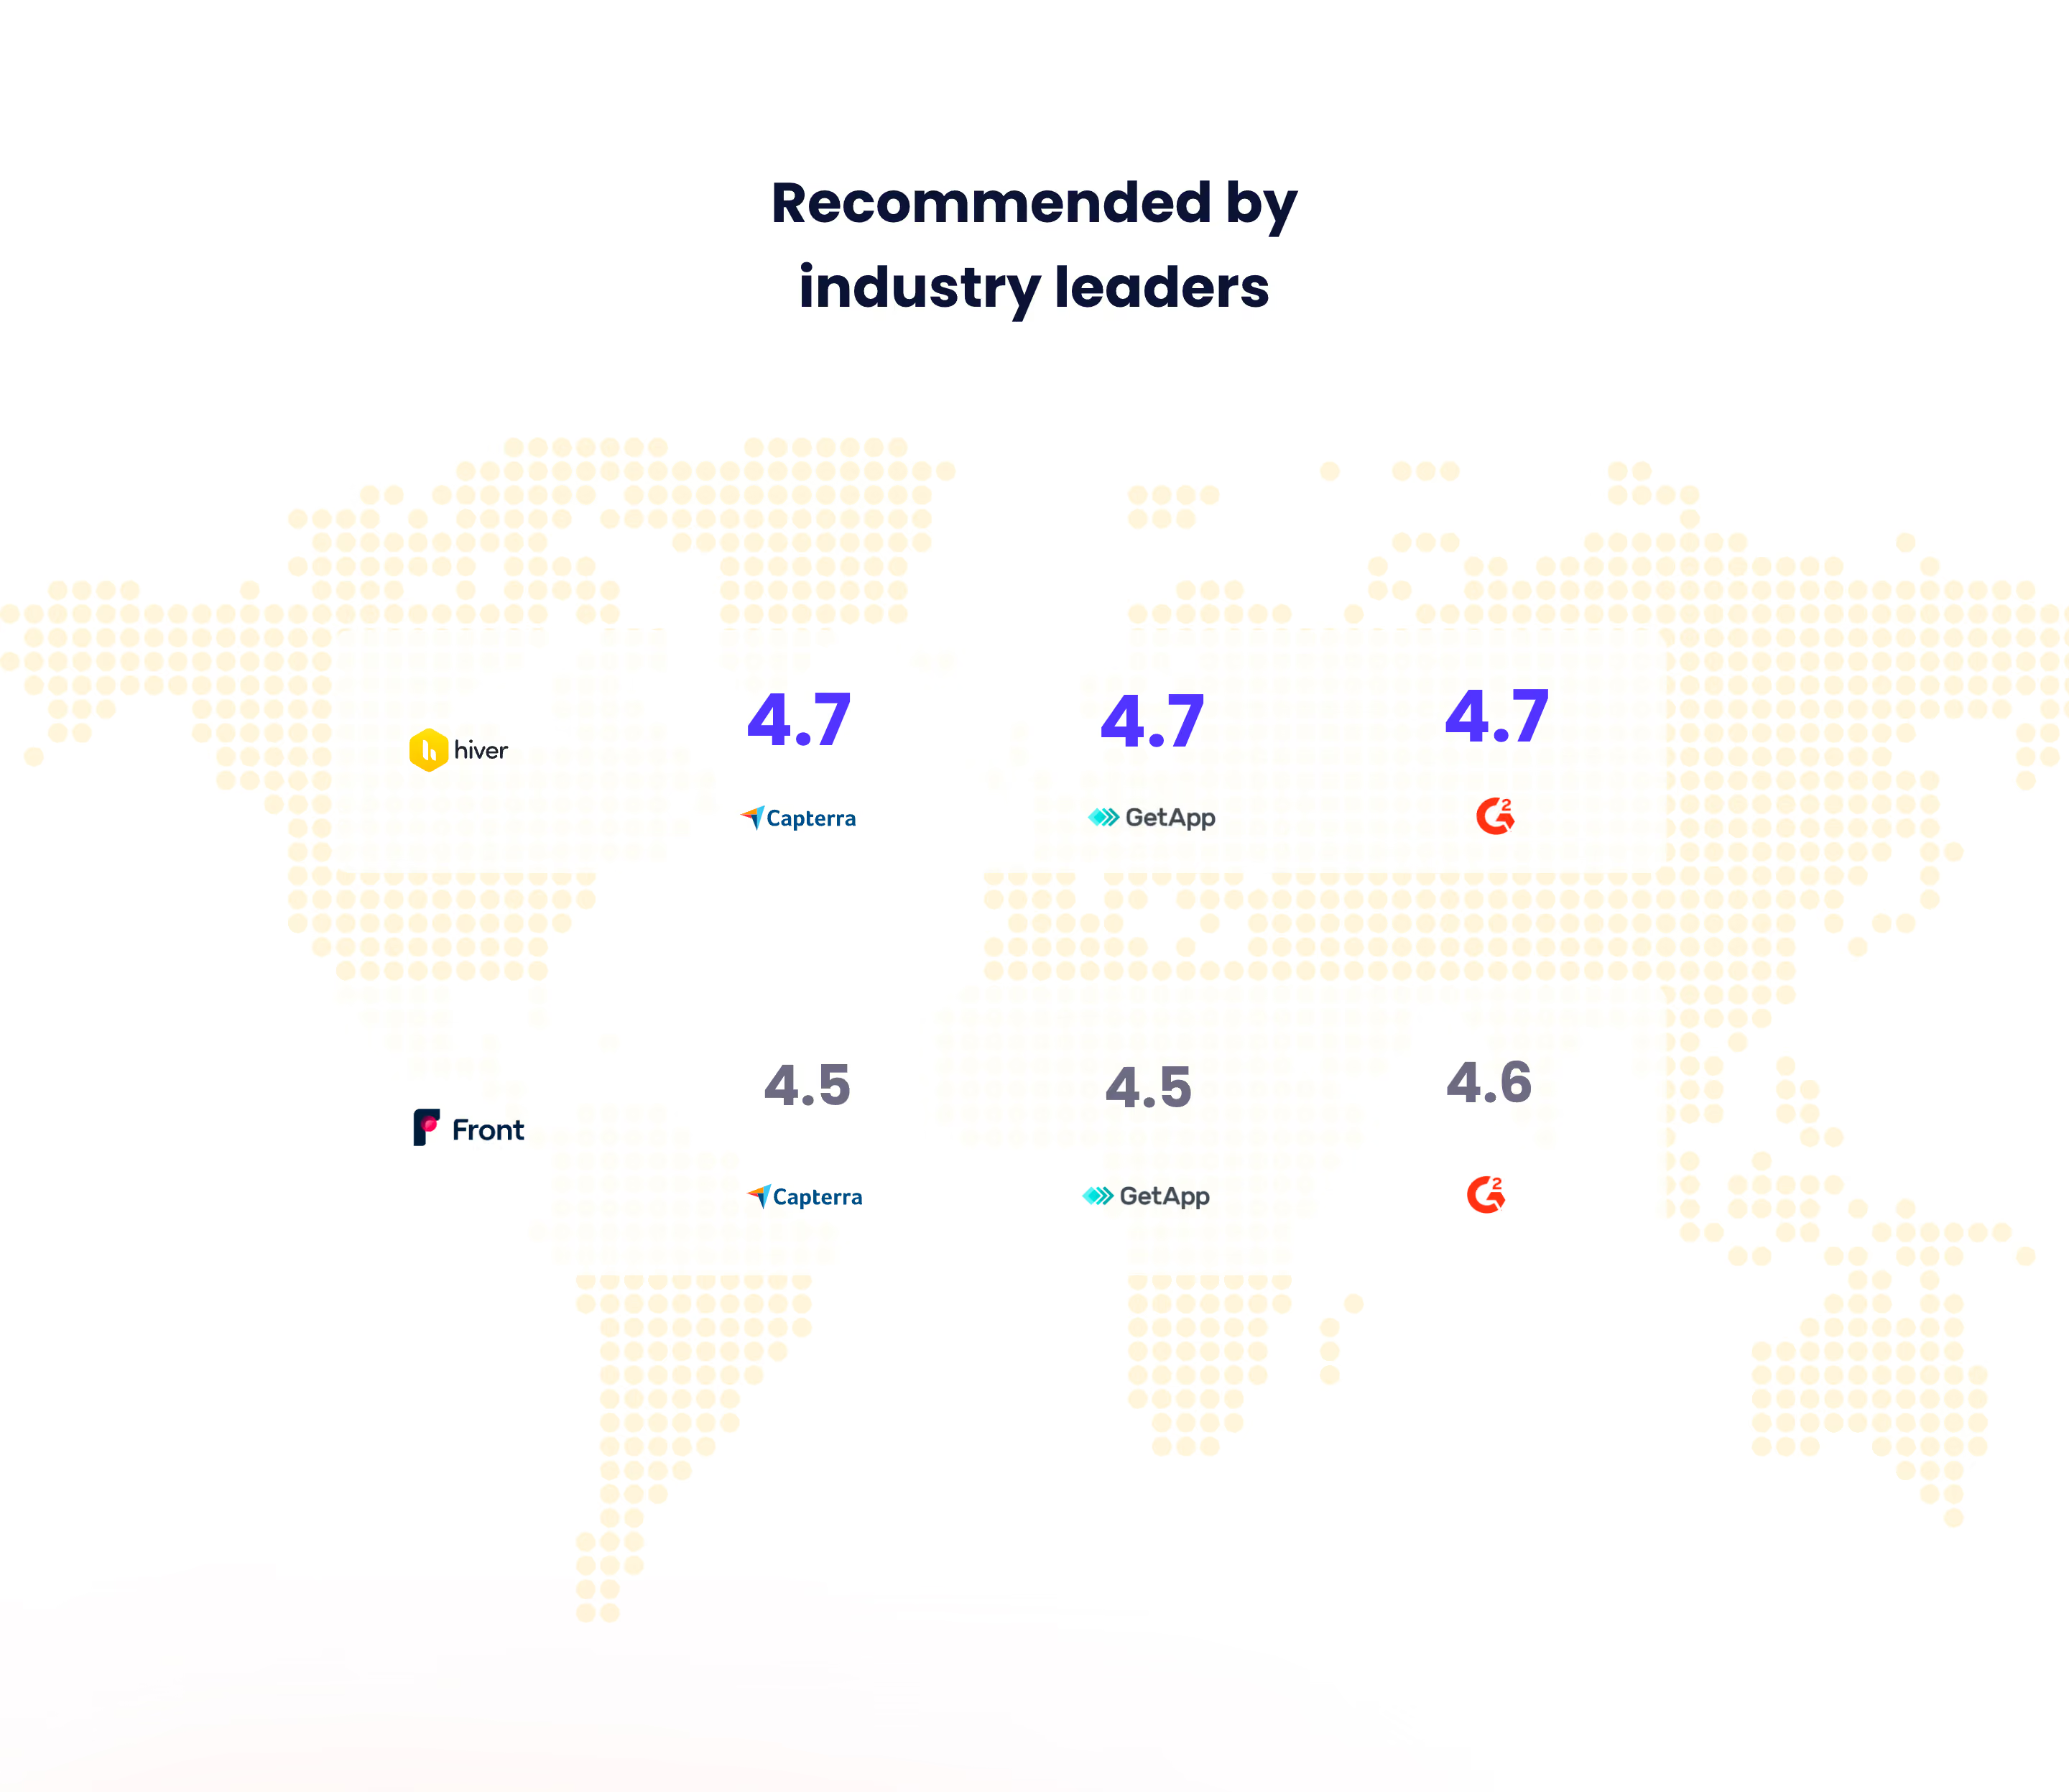
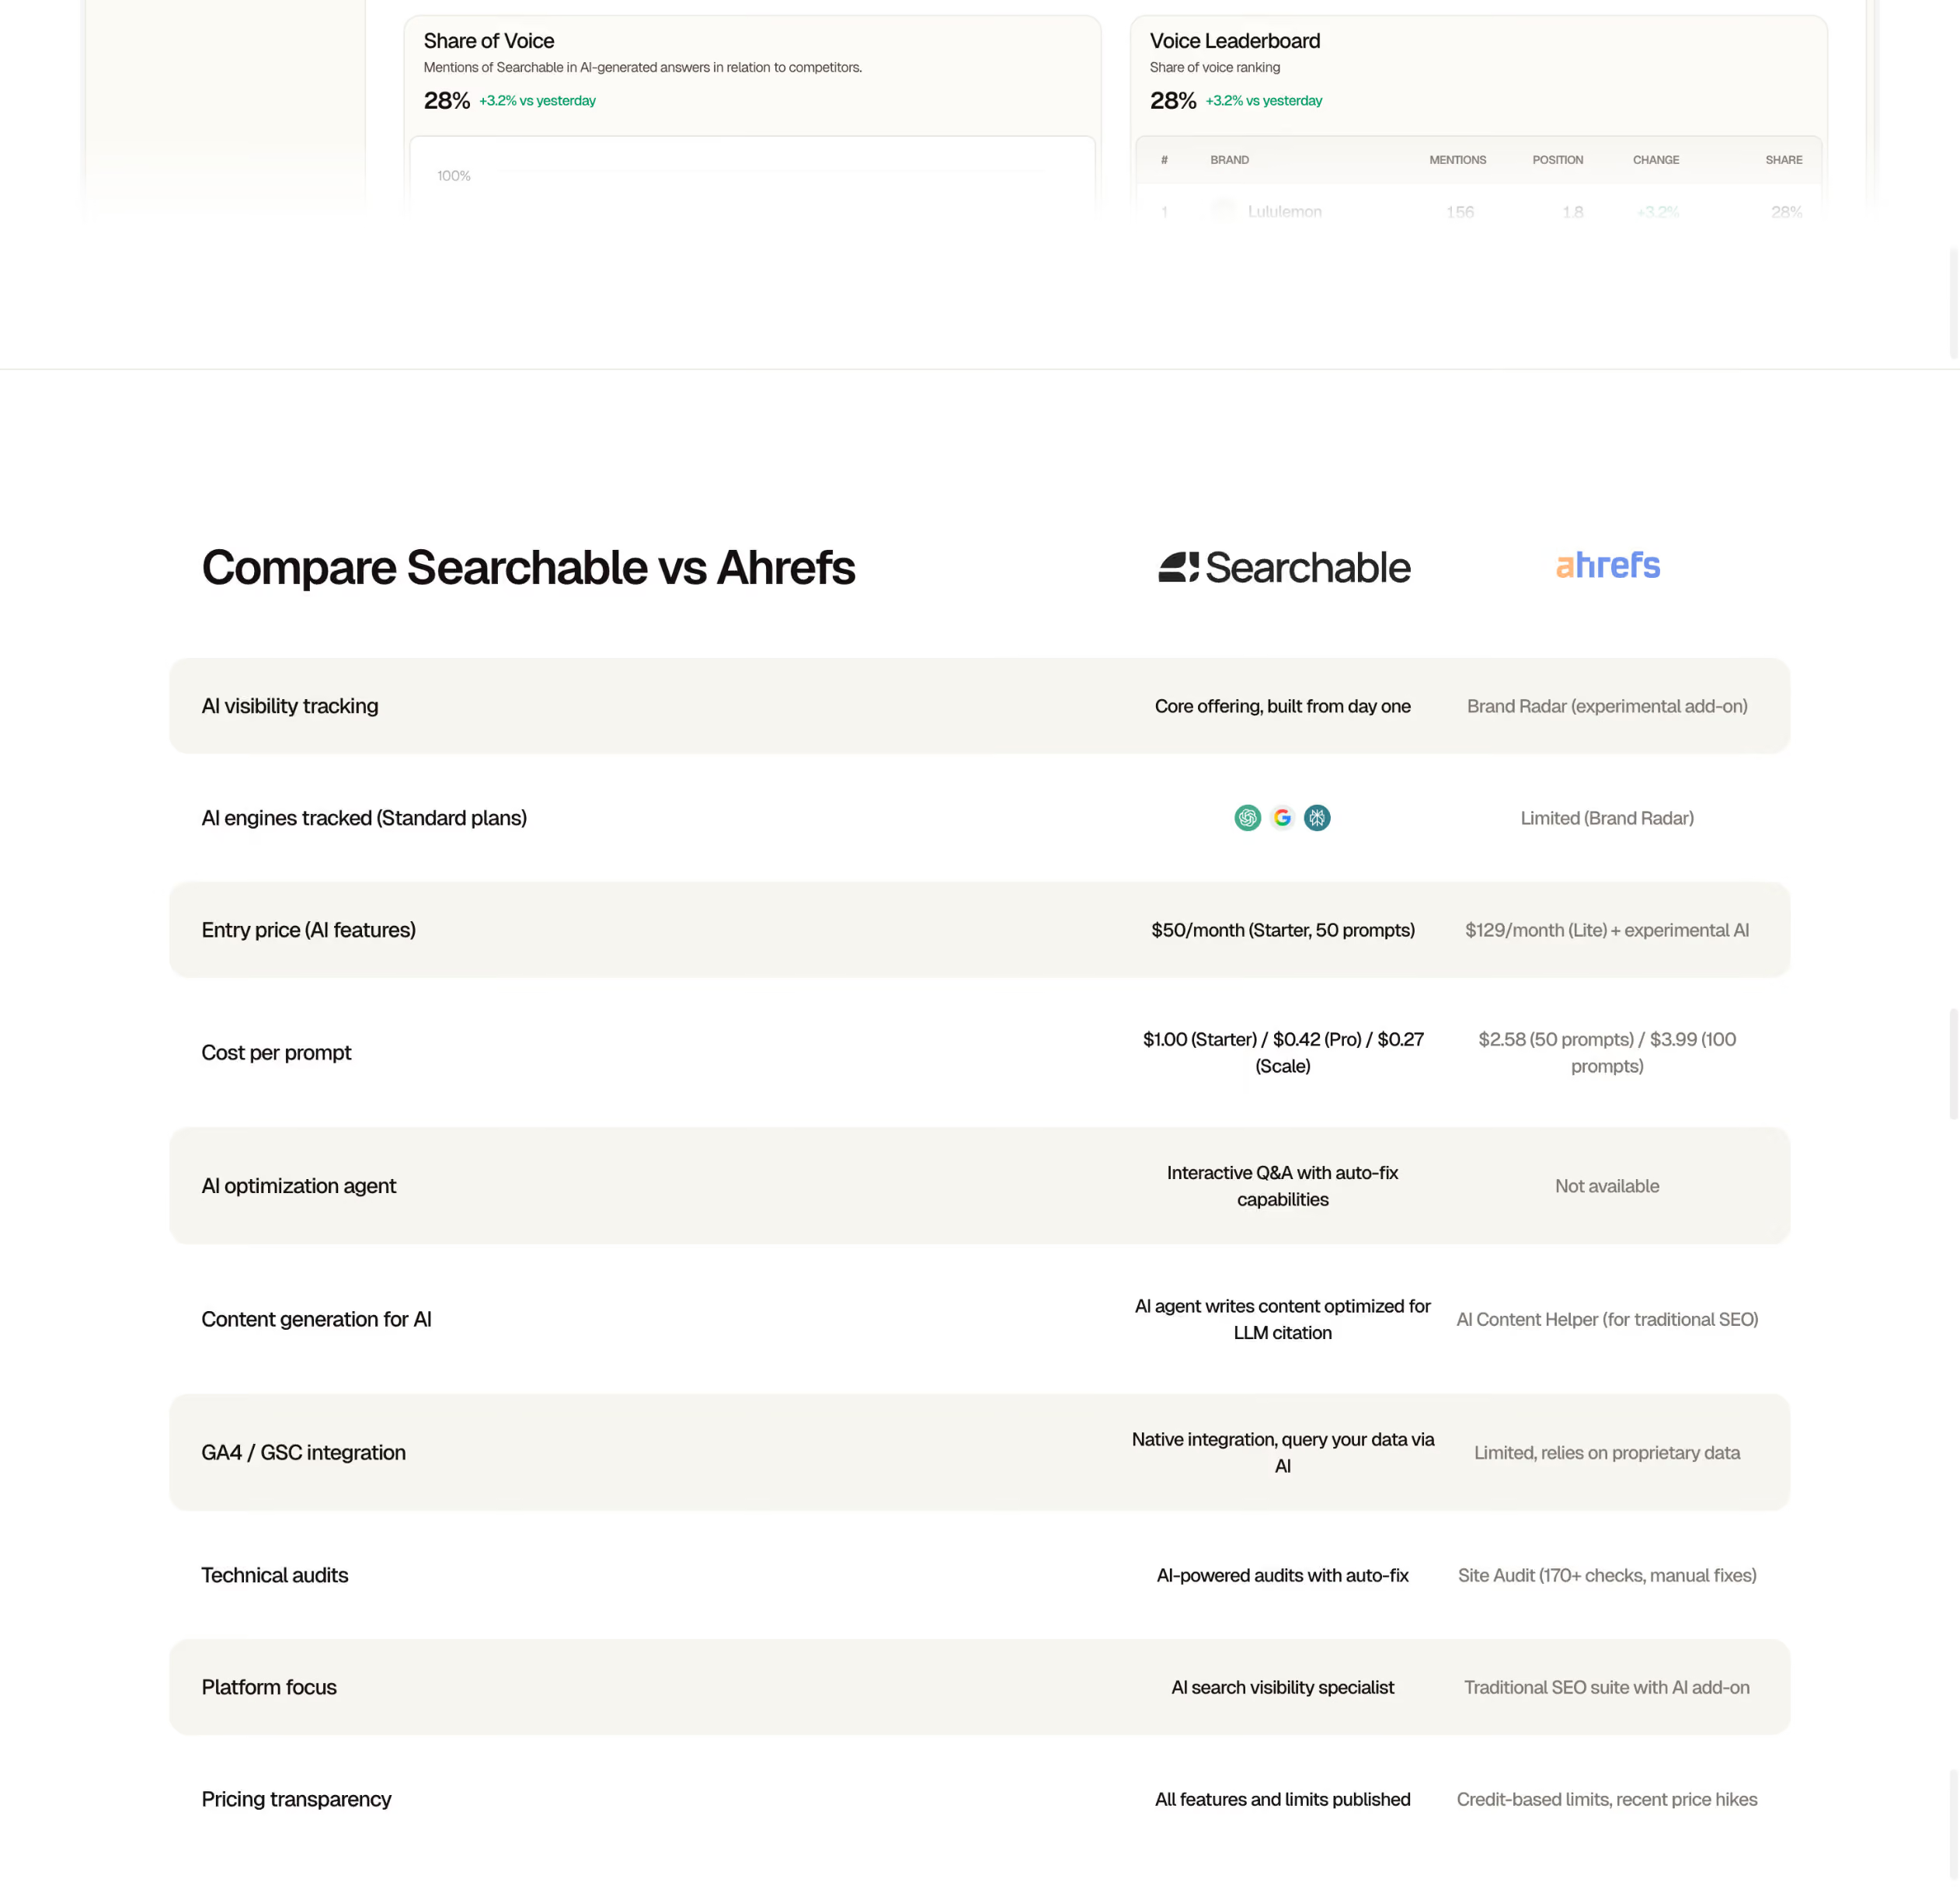
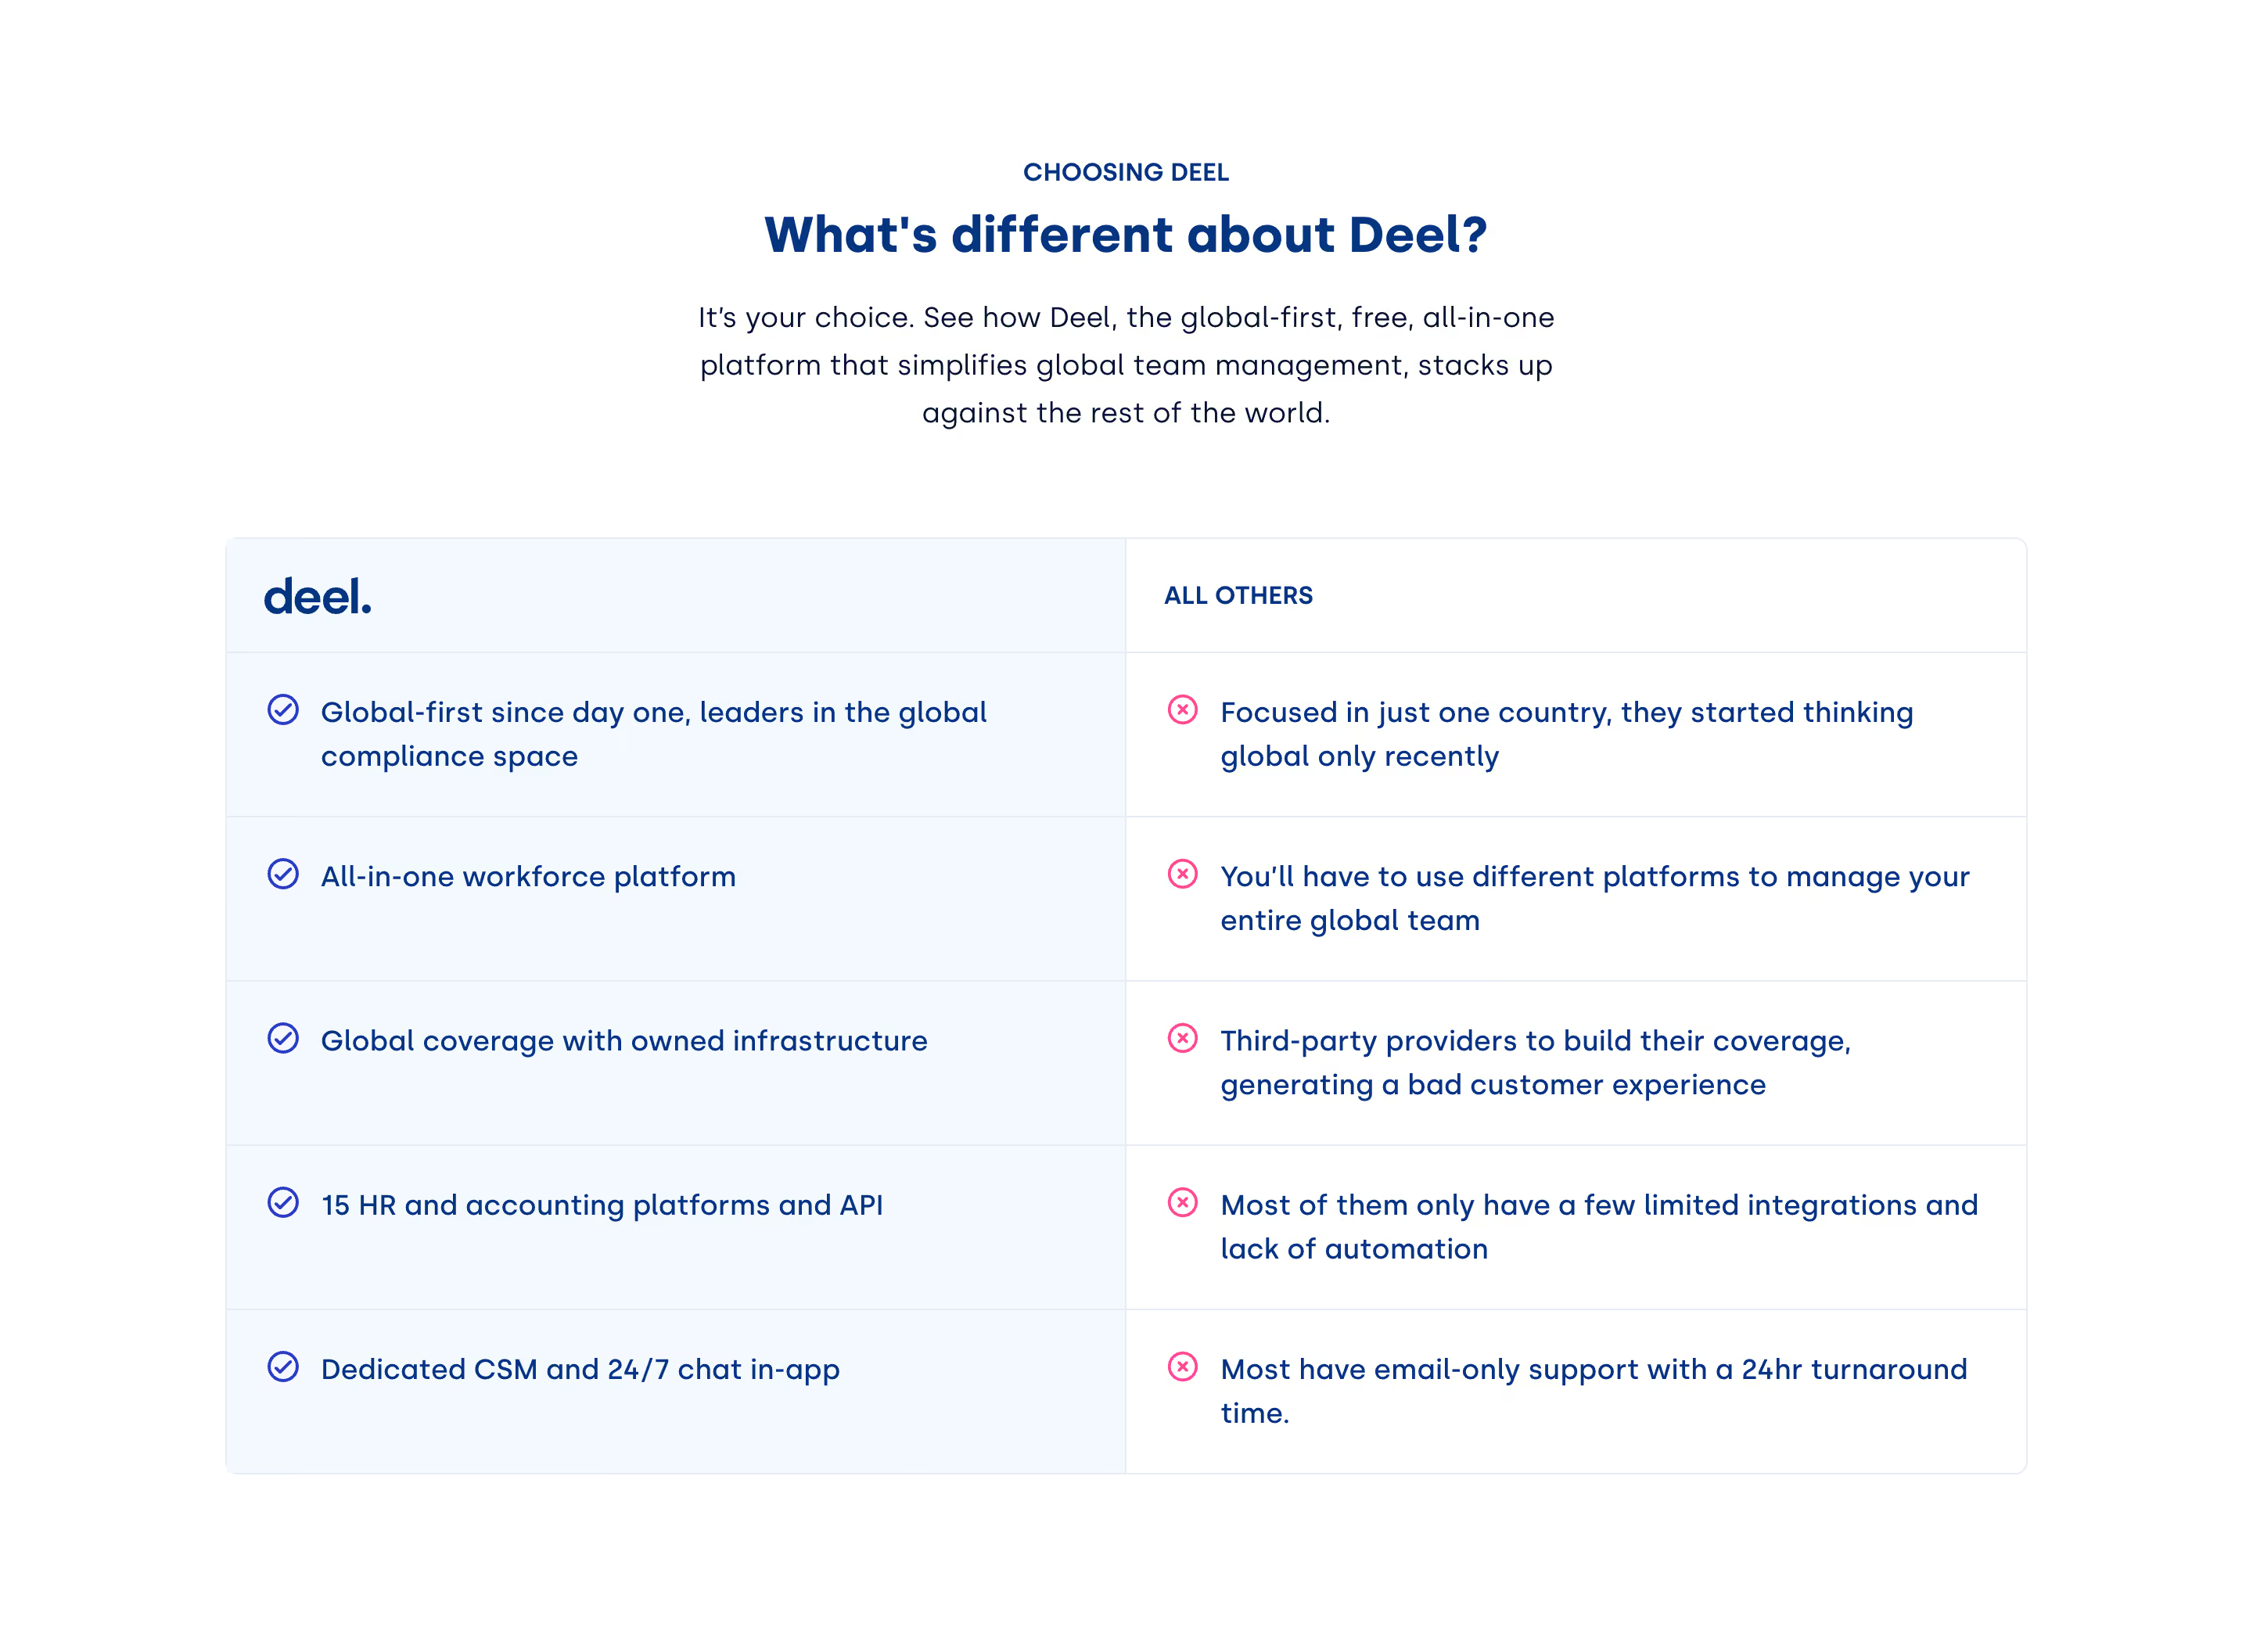
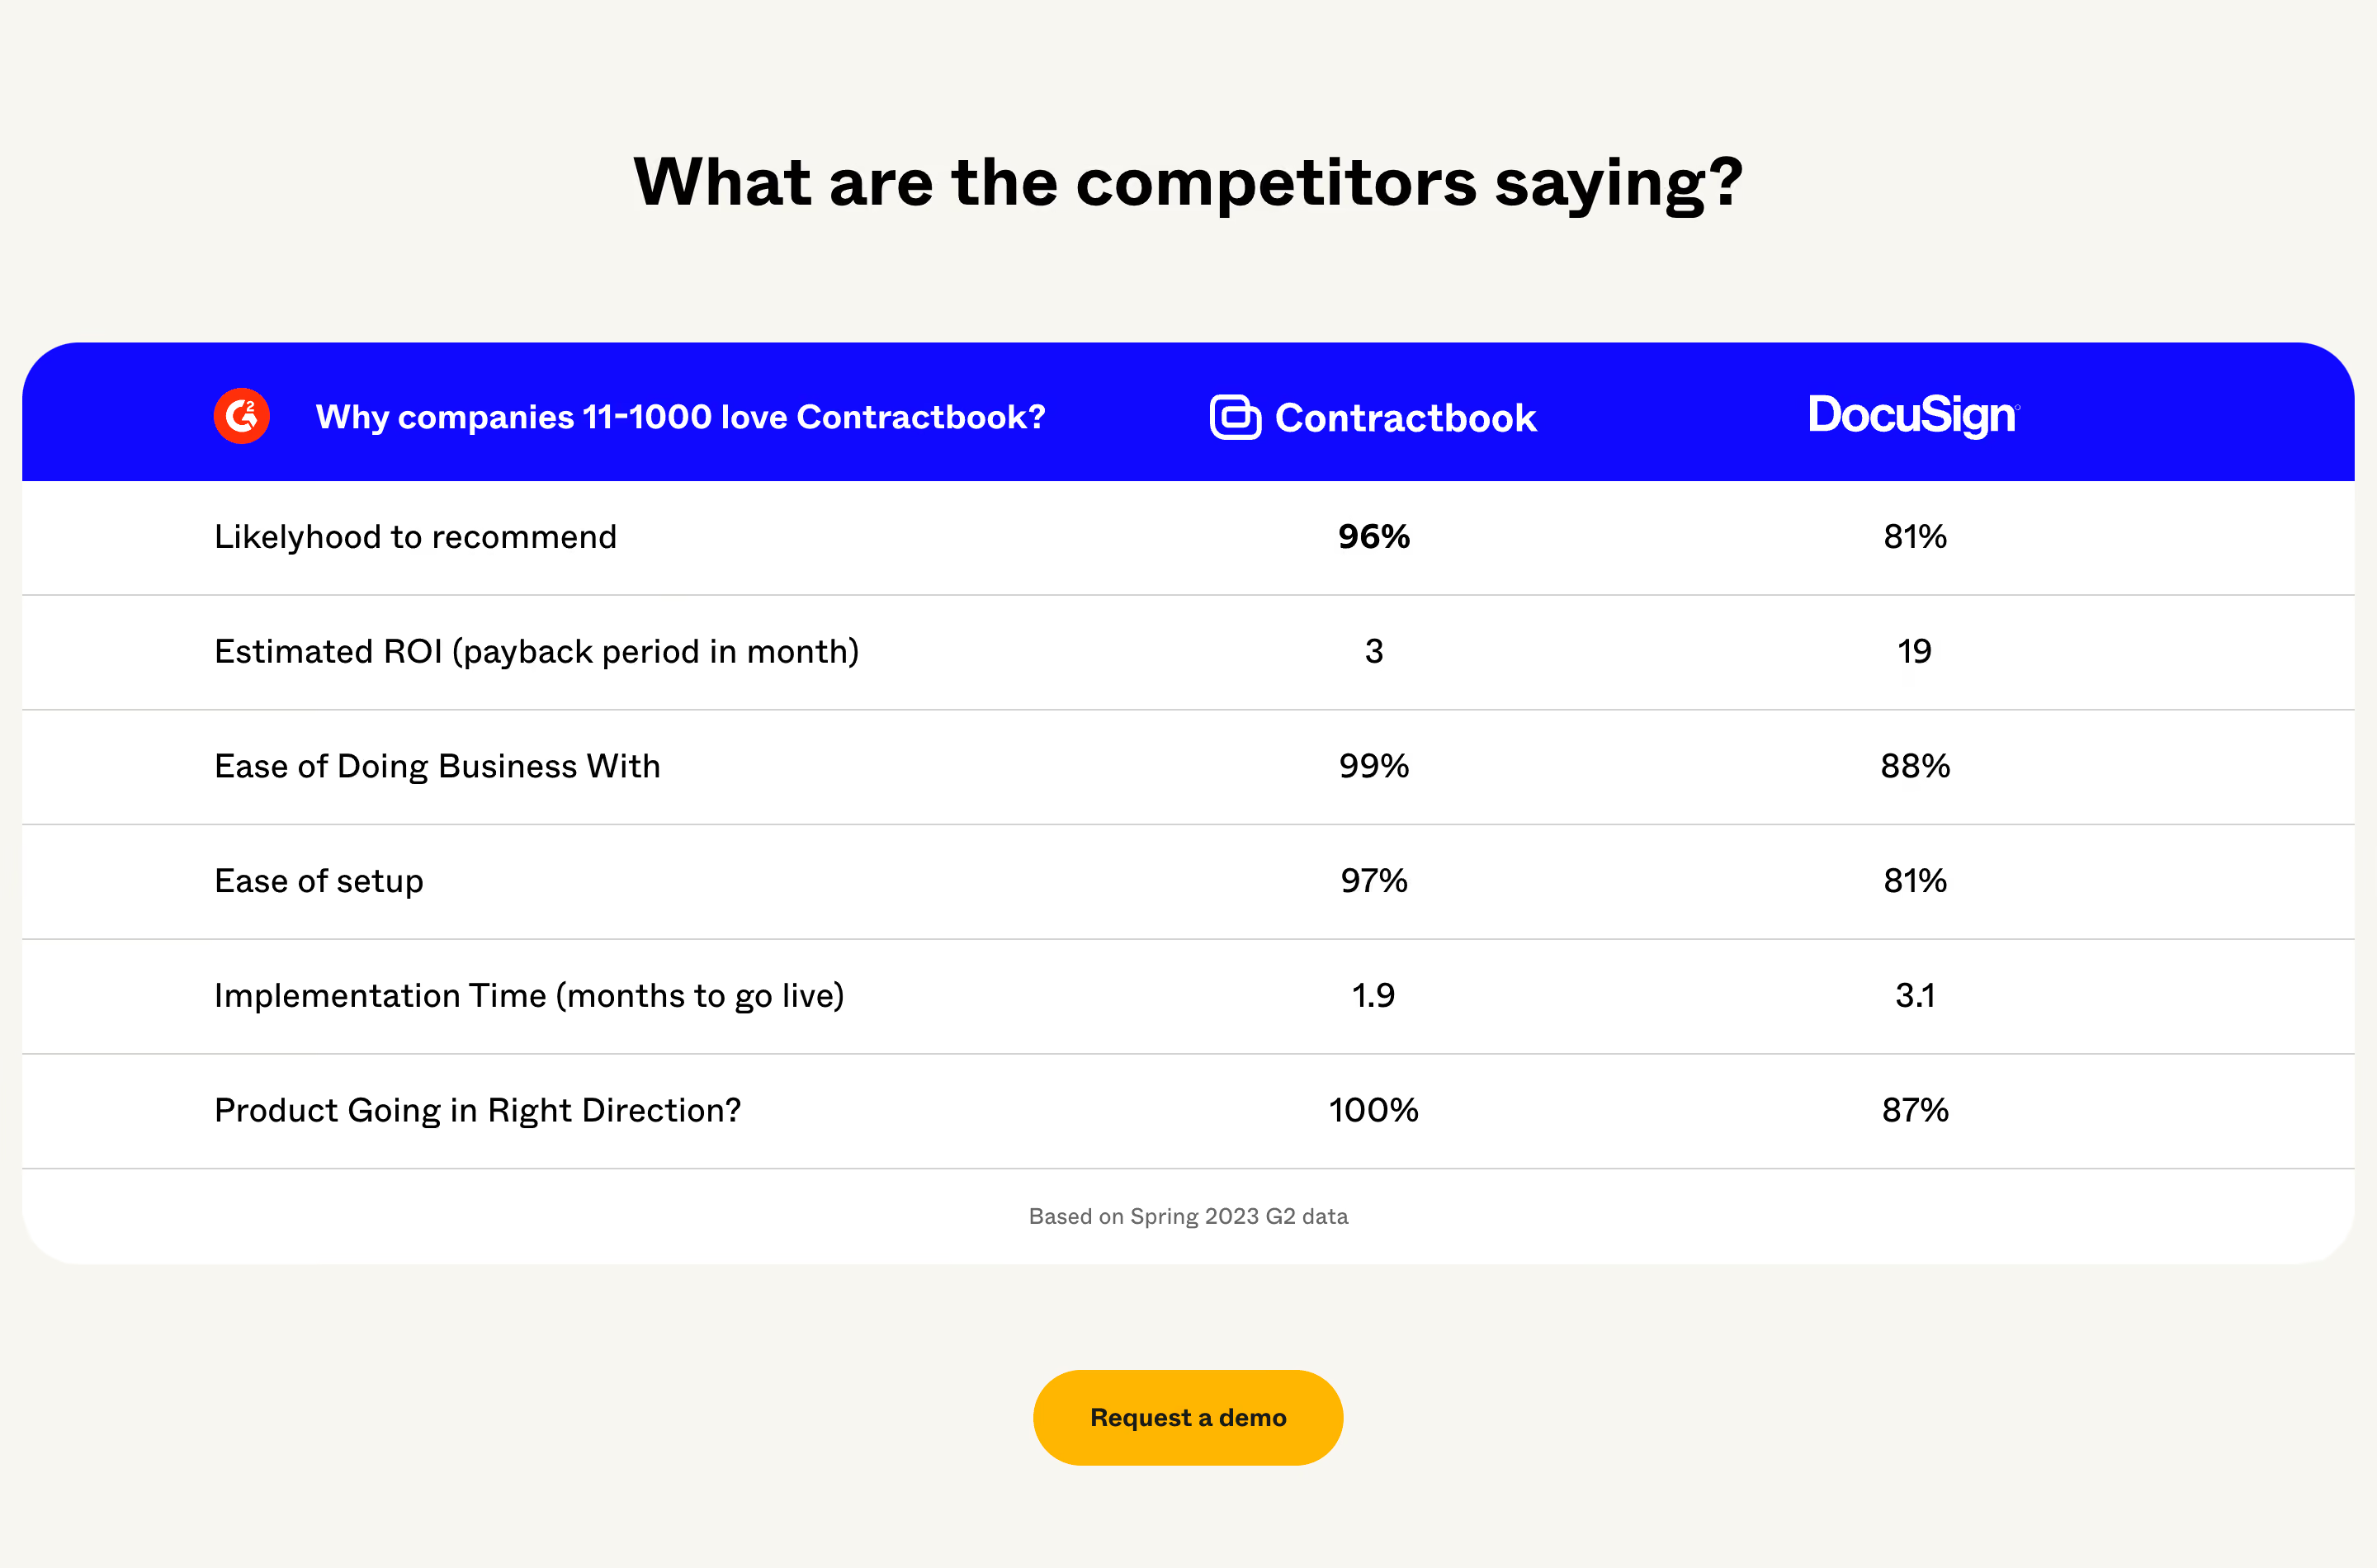
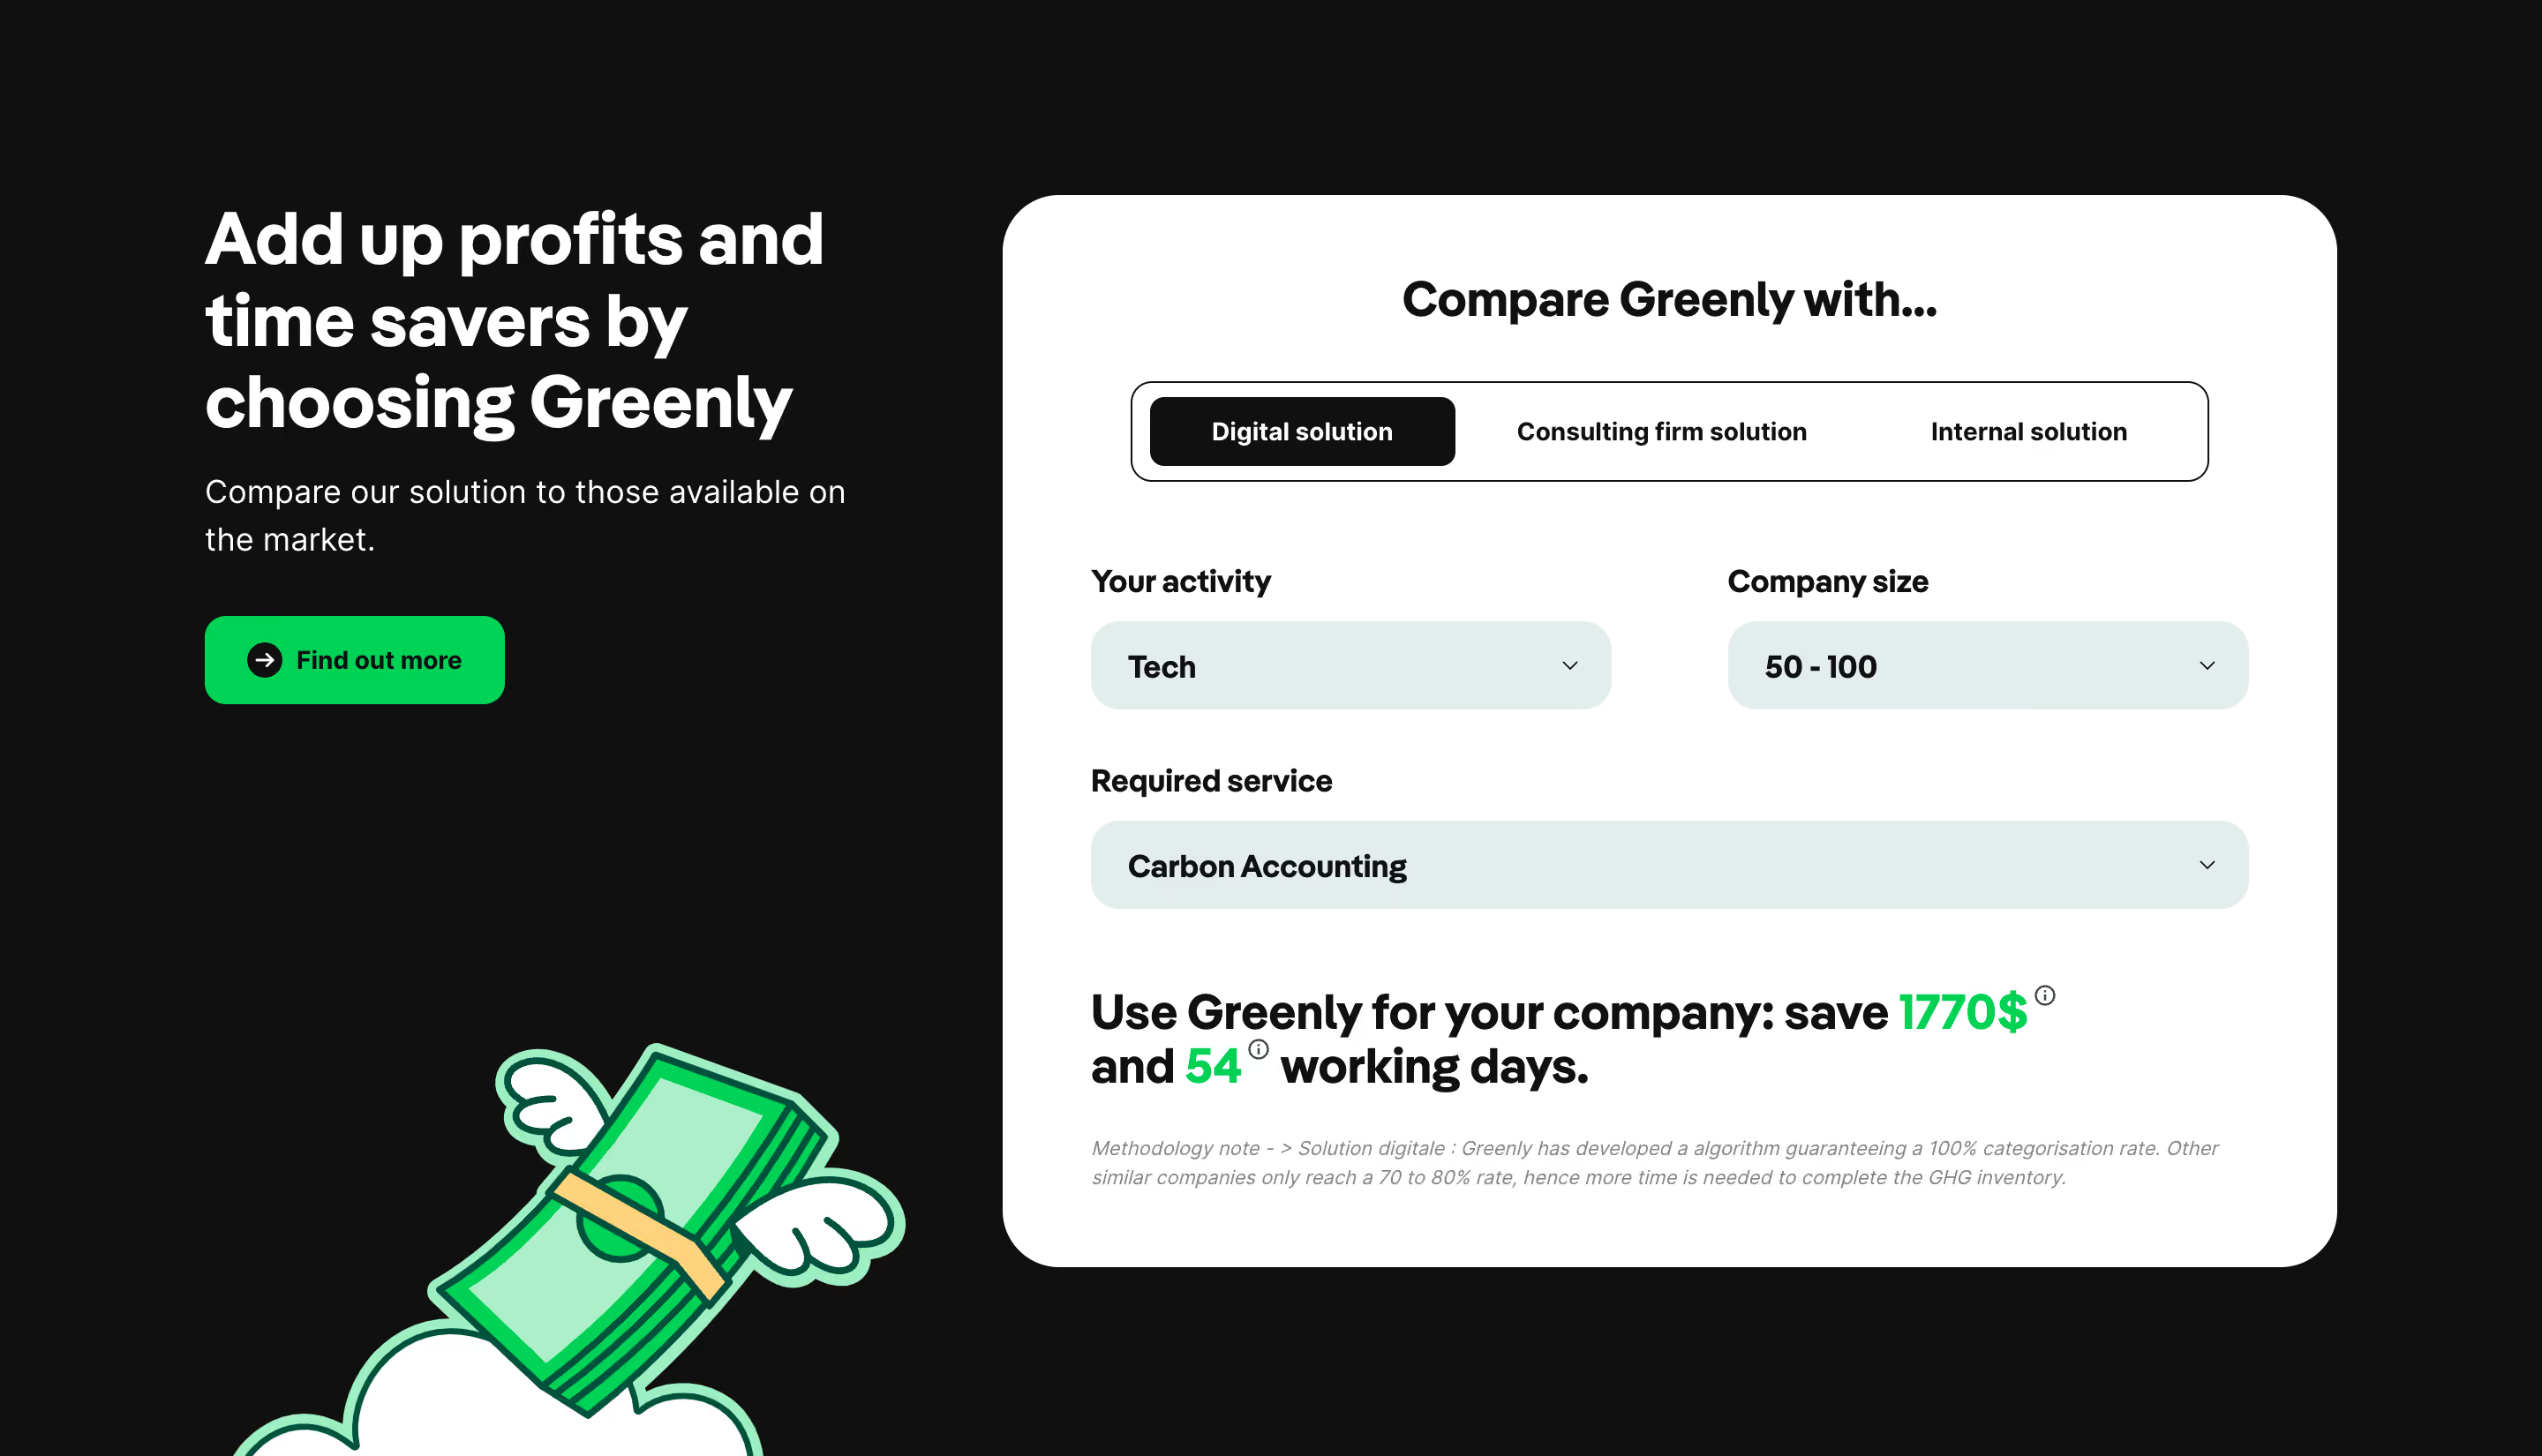
Hyperline and FullEnrich illustrate two forms: a criterion-based competitor table and a visual comparison of reach through a pipeline. The examples are historical design references. Their claims about competitors or outcomes are not independently verified here and should not be treated as current product facts.
Start with the choice the visitor is trying to make. Comparing two products is different from comparing a custom build with a ready-made service, or comparing a current workflow with a proposed one. Name the alternatives clearly and explain the basis of evaluation.
Choose criteria relevant to the task. A buyer may care about setup effort, supported workflows, cost structure, administration, or assistance. A comparison that emphasizes only the seller's strongest points may look decisive while leaving the visitor's actual requirements unanswered.
Set the scope before designing the table or diagram. Specify which version, plan, configuration, or period the comparison concerns when those details matter. A broad product name can conceal materially different offers. The reader should be able to understand what is being compared without reconstructing hidden assumptions.
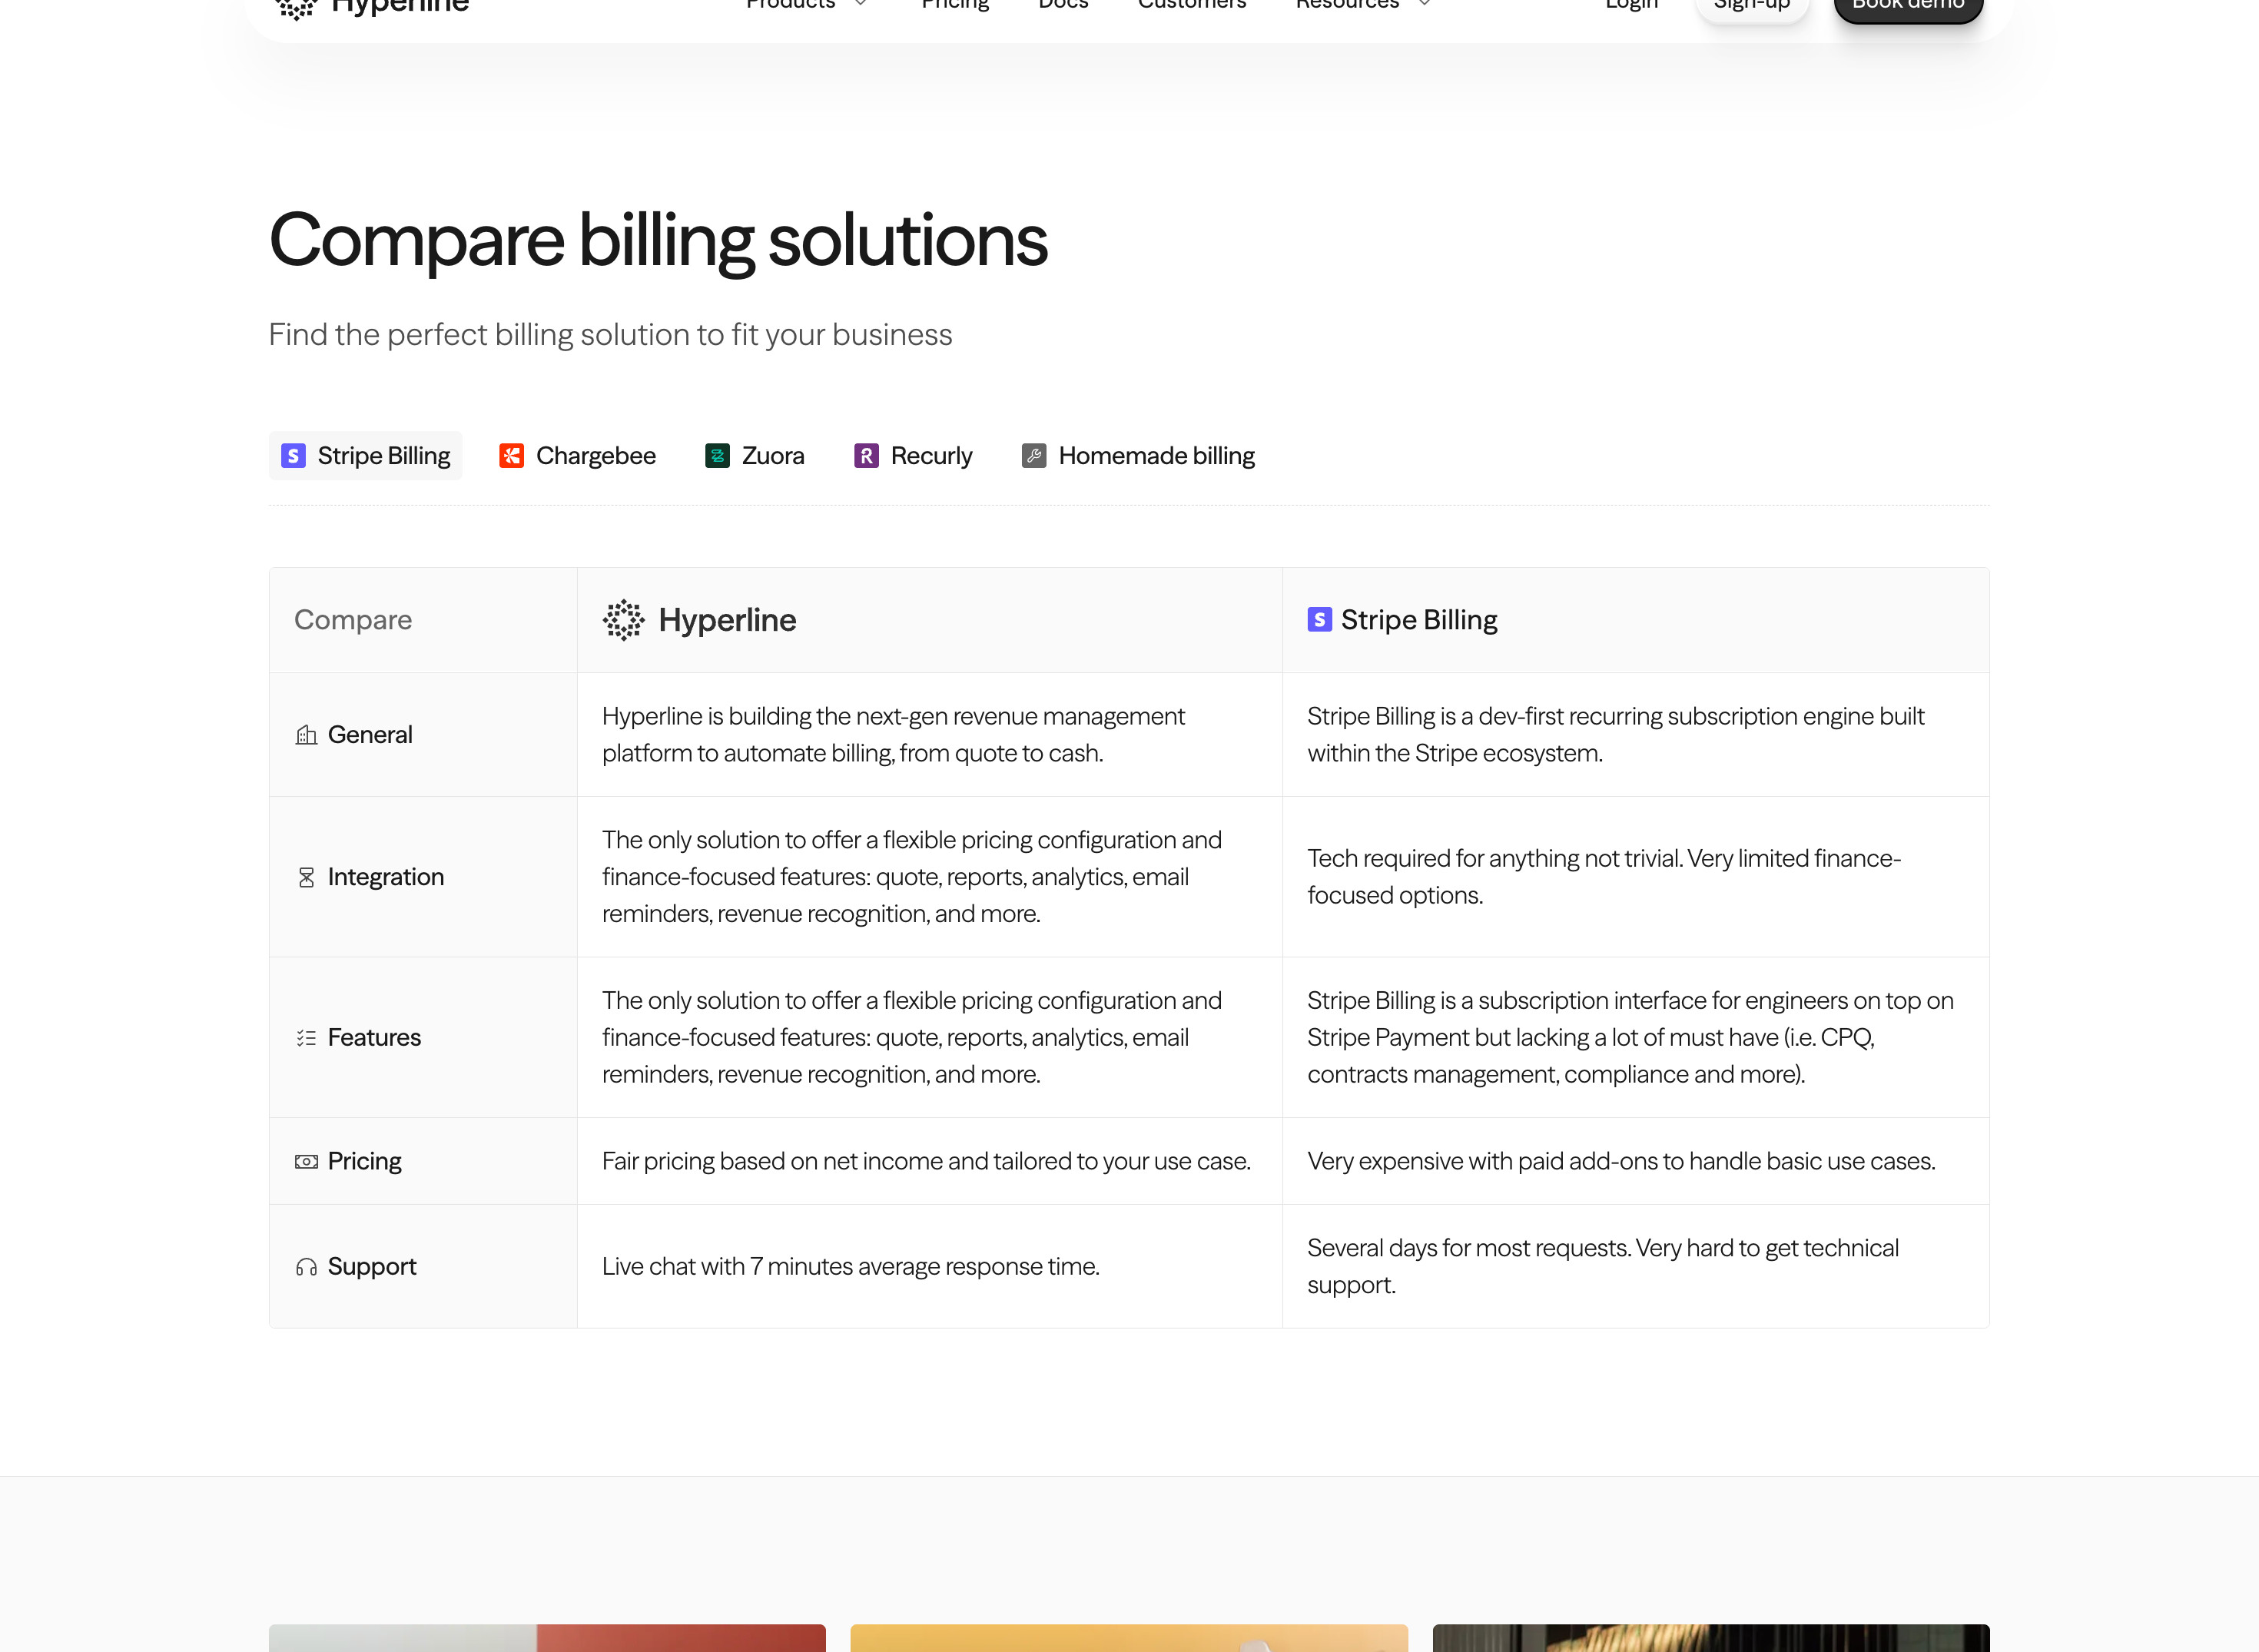
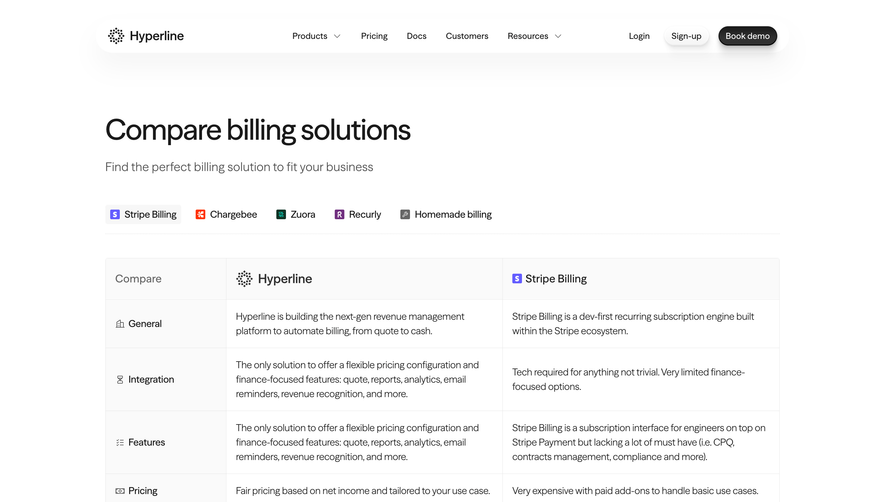
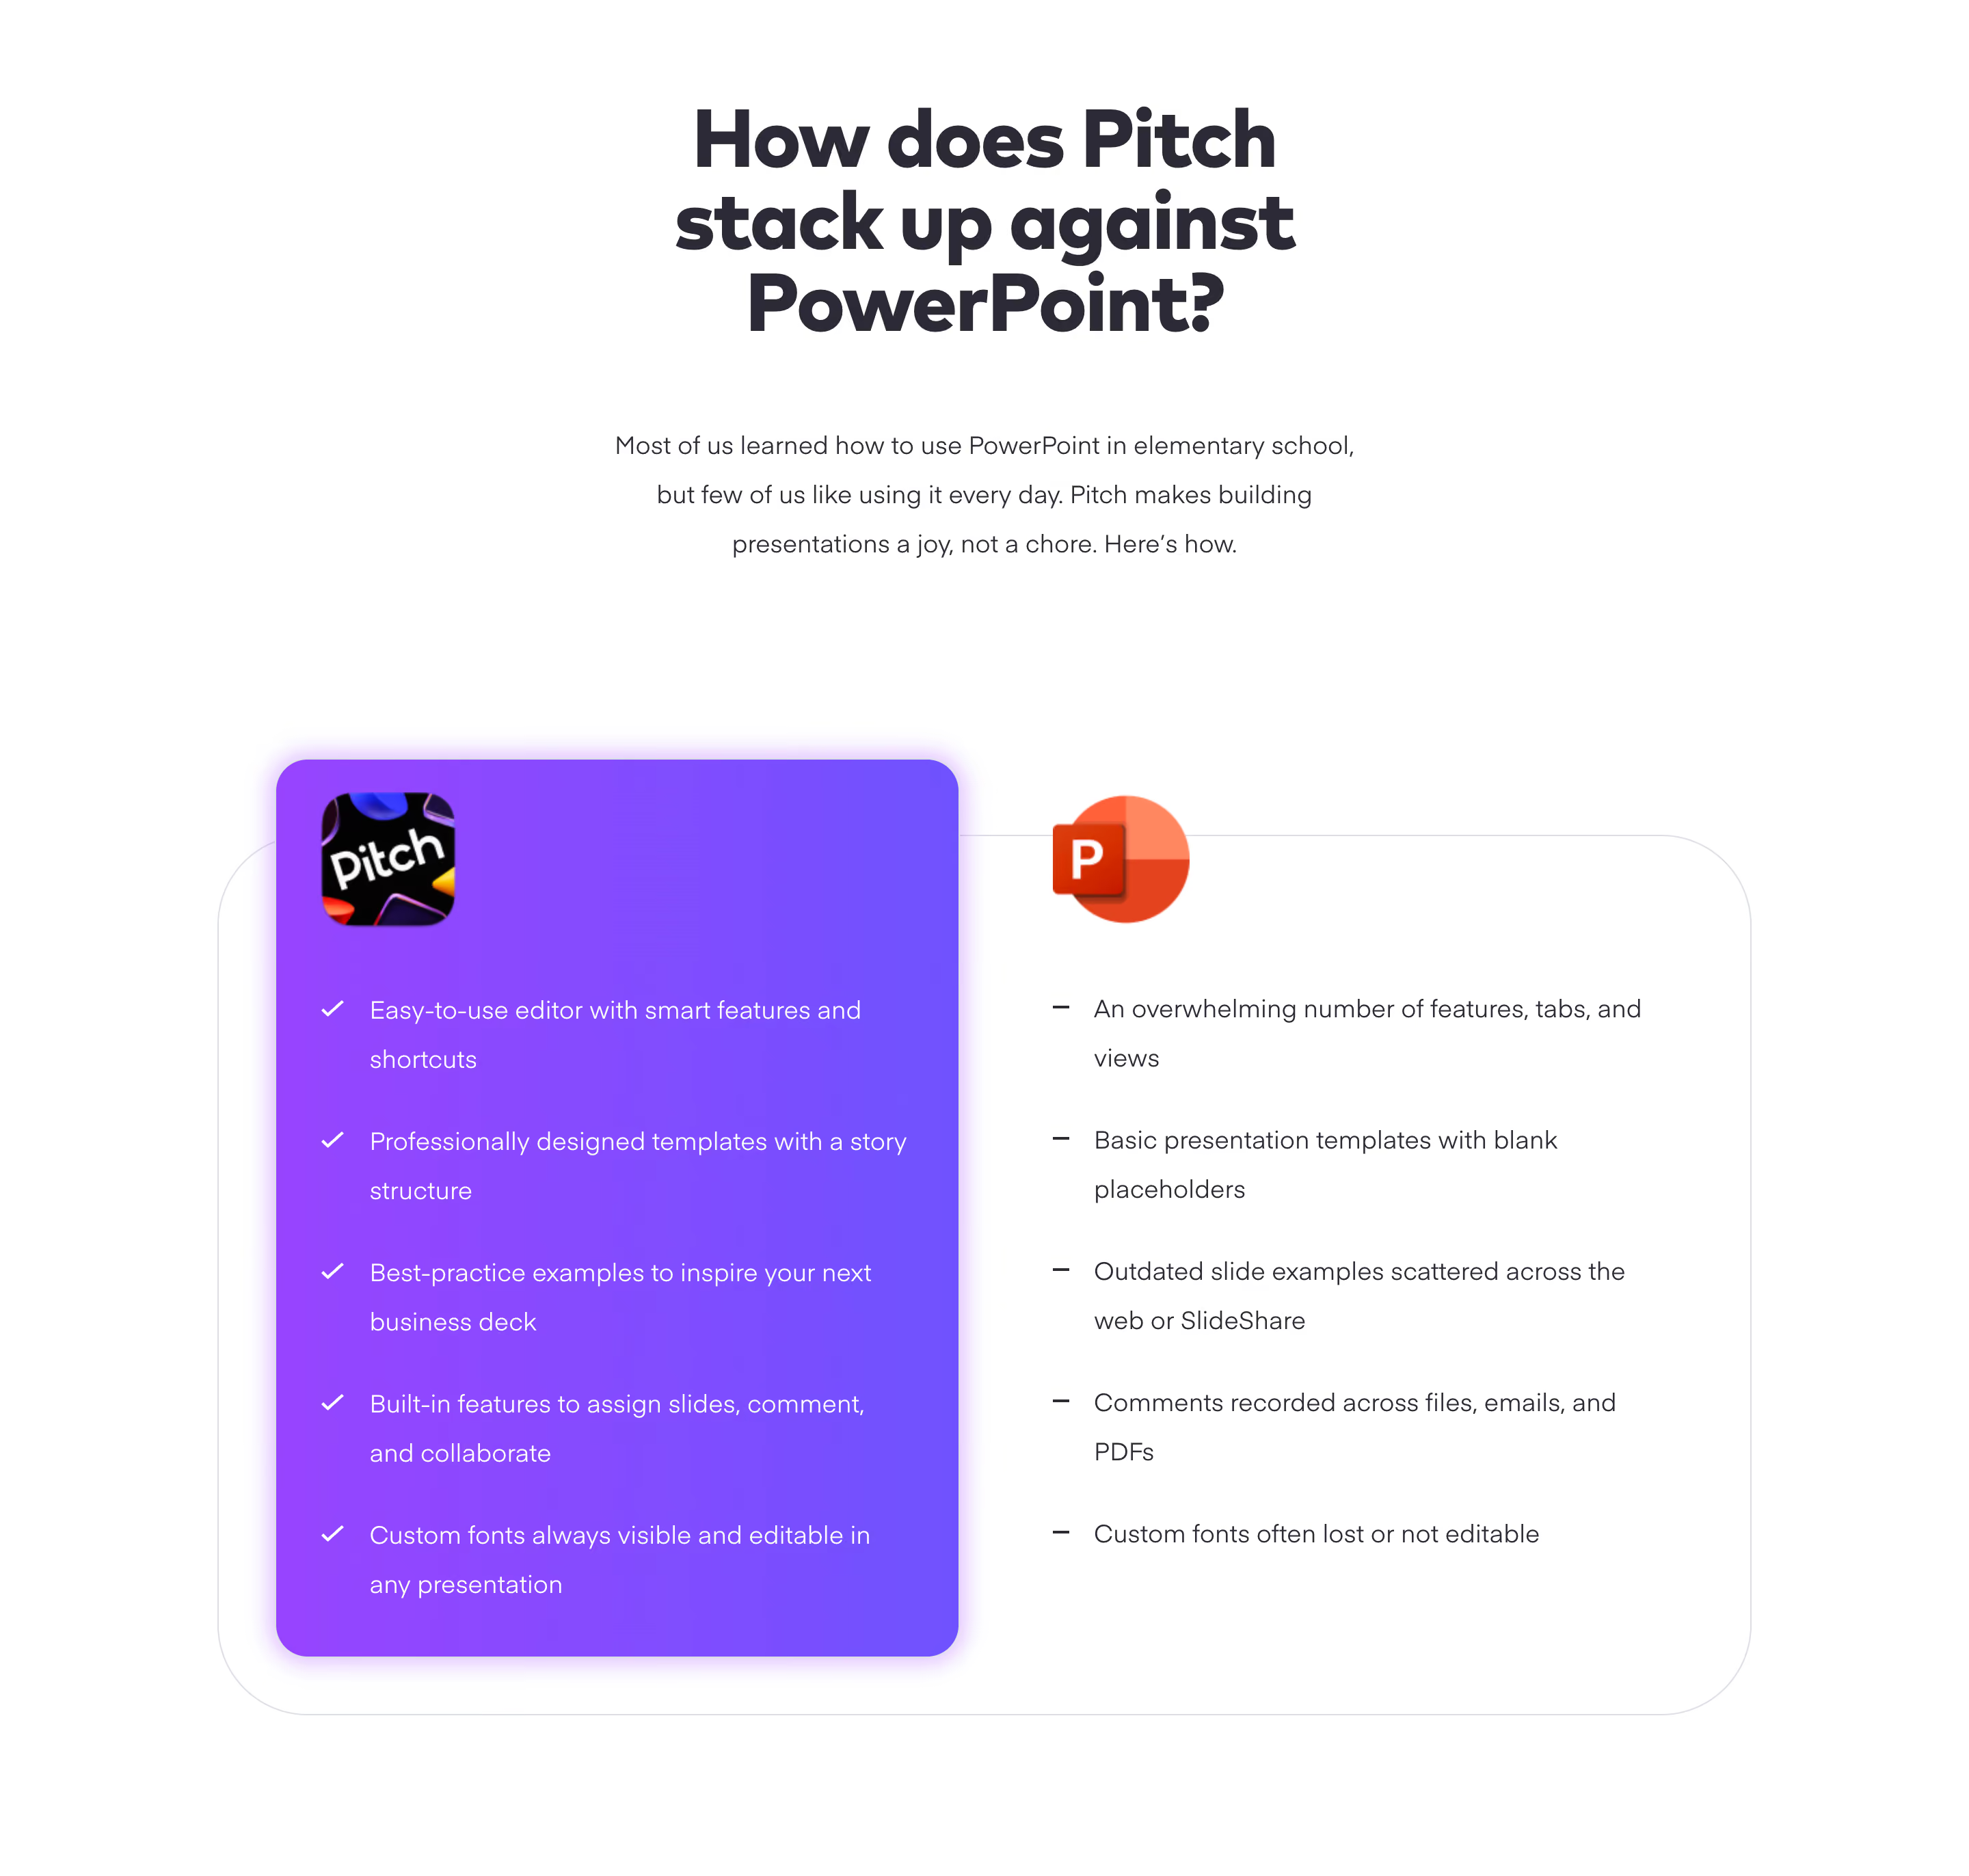
Hyperline shows a row of alternatives above a table with two product columns. The visible categories include general fit, integration, features, pricing, and support. This structure lets a visitor inspect one evaluation topic at a time while retaining the same two alternatives.
The layout is useful for organizing a complex comparison, but the wording deserves a separate review. The capture includes strong evaluative language and repeated material across rows. Such copy can make the seller's preference clear without giving the reader consistent, verifiable criteria.
Use the table structure while improving the editorial standard. Describe observable differences, identify the relevant scope, and provide sources for consequential claims. Keep the amount of detail reasonably parallel across columns. A favorable adjective in one cell and a vague criticism in another does not create a meaningful comparison.
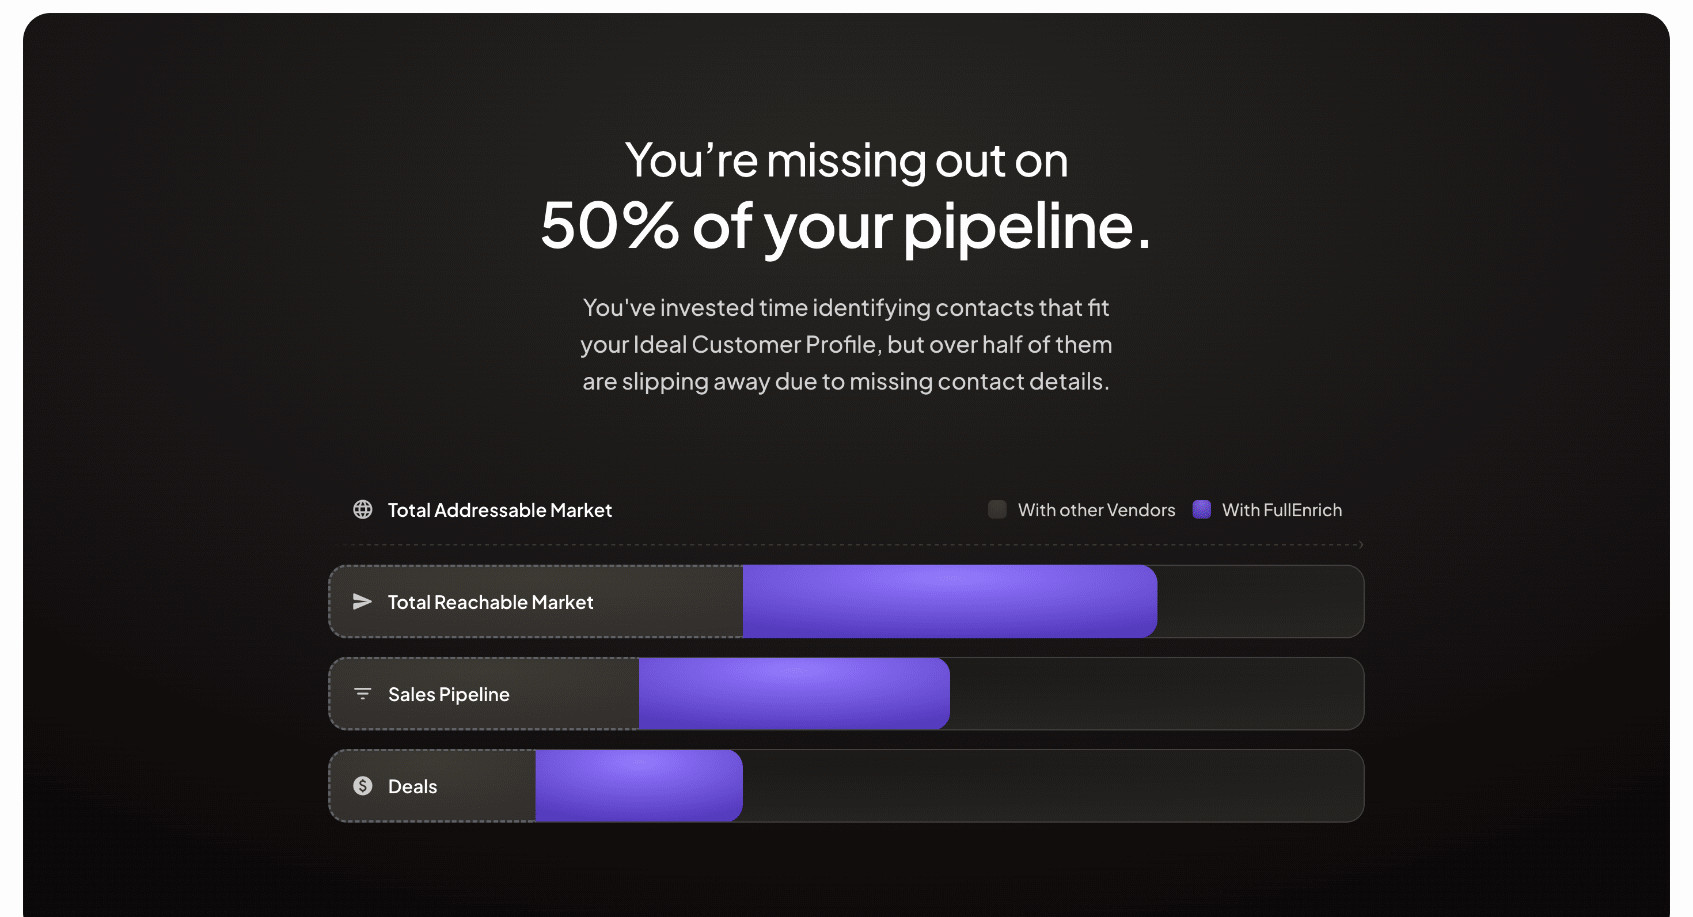
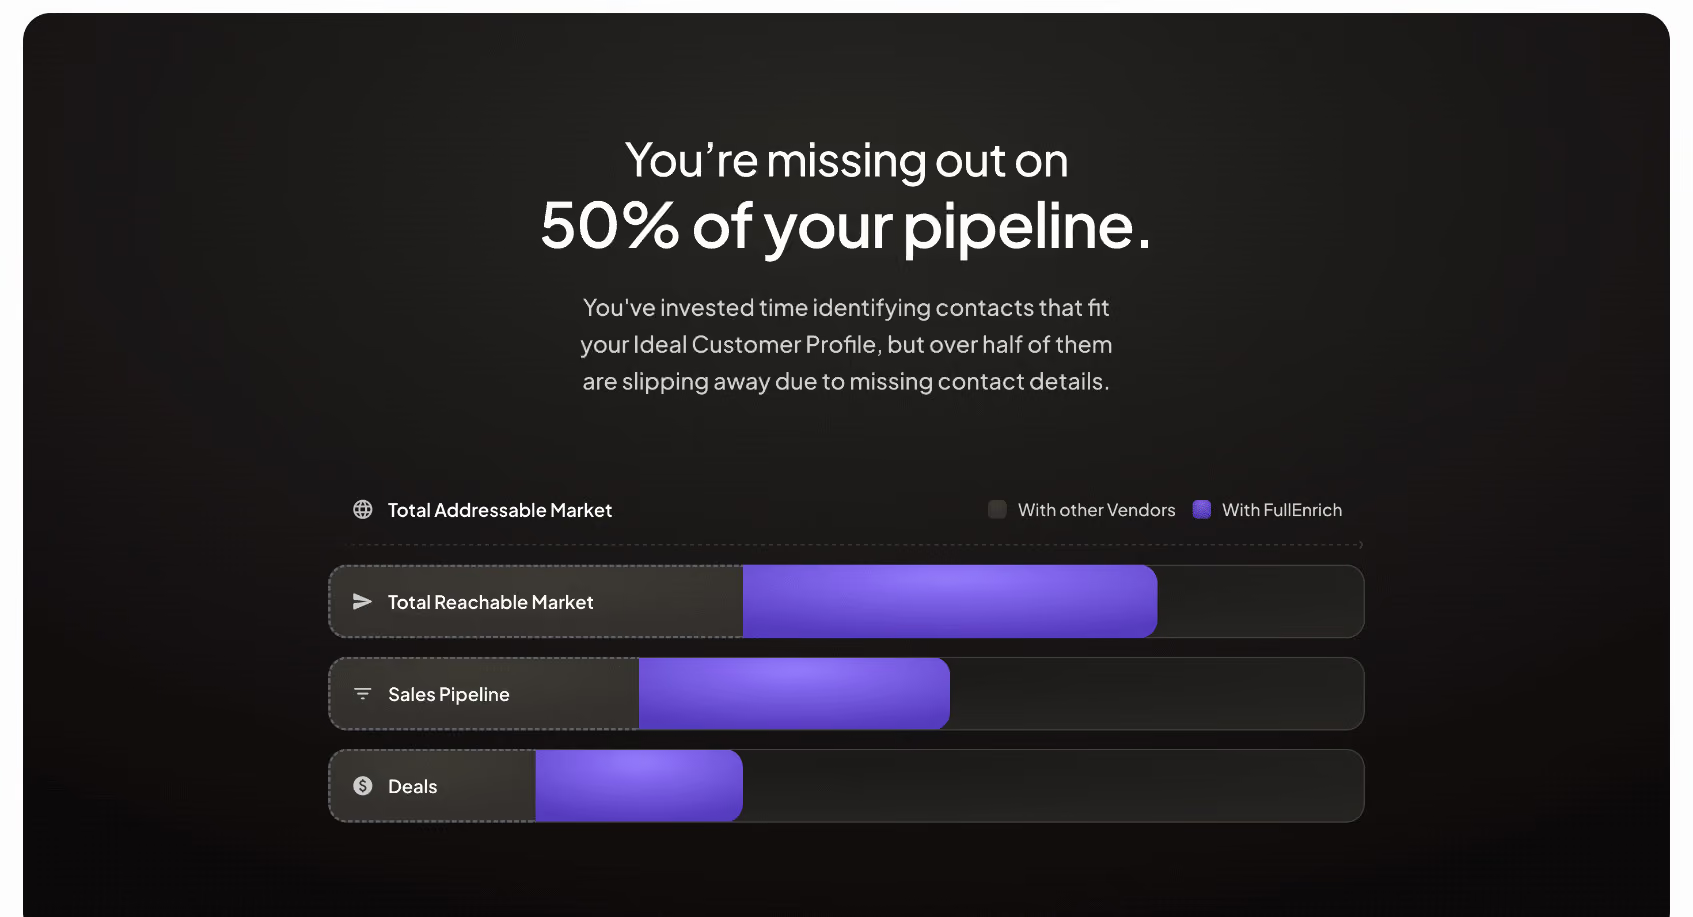
FullEnrich uses a visual sequence from an addressable market reference to reachable market, pipeline, and deals. A legend distinguishes other vendors from FullEnrich, and colored segments suggest additional reach at each stage. The structure communicates a proposed relationship across a funnel-like process.
This is a different kind of comparison from a feature table. The visitor is being shown a visual explanation of potential coverage and downstream opportunity, not a list of specific entitlements. A diagram can make that relationship memorable, but it must be clear whether the proportions are measured or illustrative.
The capture does not provide a visible numerical axis or methodology. Therefore, the bars should not be interpreted as independently verified quantities. In a live design, explain the basis of the graphic and link to supporting evidence when the proportions make a quantitative claim. An evocative shape is not a substitute for measurement context.
A strong criterion describes something a reader can examine: a supported workflow, an available route, a defined limit, or a pricing basis. Words such as better, fair, and easy need explanation. They can reflect a perspective, but they do not establish a comparison on their own.
Use the same question for both alternatives. If one column describes a product capability, the other should address that capability rather than shift to an unrelated weakness. If a value depends on plan or configuration, make that scope visible.
Include tradeoffs that matter to the visitor. A custom build may offer control while requiring implementation work. A ready-made route may simplify setup while limiting flexibility. A useful comparison helps readers decide which tradeoff fits their needs, rather than treating every difference as evidence that one alternative is universally superior.
Competitor capabilities, pricing, support policies, and integrations can change. Establish a review process and retain the sources behind each statement. Where useful, show a checked date or provide links that let readers inspect the relevant details.
Use primary product information for technical or commercial claims. Avoid turning an anecdotal support experience into a universal policy statement. When a claim cannot be substantiated at the required scope, qualify it, remove it, or replace it with a clearer criterion.
Review the entire comparison after a change, not only the affected cell. A new feature can alter a broader summary, and a renamed plan can make several rows ambiguous. If the comparison depends on a specific configuration, keep that configuration documented so later editors understand the basis.
Hyperline's visible alternatives suggest a selector for changing the compared product. A screenshot cannot establish how the table updates, but a live implementation needs a coherent model. The selected alternative should remain identifiable, and every relevant row should update together.
Use controls with clear names, visible focus, and an exposed selected state. If changing the alternative triggers loading, preserve context and show useful feedback. Do not leave some cells from the previous selection while replacing others.
Keep comparisons accessible without requiring precise pointer use. Long alternative names may need wrapping or a different mobile control. If the table supports more than one selected comparison, make the resulting column order predictable. The visitor should know which product each value belongs to at every point.
Color, background, and typography can make the seller's product easier to track. That emphasis is a design choice, not proof of superiority. Keep the competing column readable and do not reduce its context so much that a balanced evaluation becomes impossible.
For a diagram such as FullEnrich's, a bright segment can communicate the proposed difference quickly. Pair it with labels and definitions so readers do not rely on color alone. If the chart represents real measurements, use an appropriate scale and explain the calculation. If it is conceptual, label it accordingly.
Avoid decorative checkmarks for assertions that are more nuanced than inclusion. A statement about setup effort, support quality, or suitability may need text and context rather than a binary symbol. The visual language should match the kind of evidence being presented.
A wide table may need horizontal scrolling, stacked criterion groups, or a selector that changes one alternative at a time. Choose a model that keeps the criterion and both relevant values associated. Do not shrink text until it becomes difficult to read.
For stacked content, repeat product names or provide persistent labels where necessary. A visitor should not have to remember a header from several screens earlier. Use semantic table headers for a true matrix and test its reading order with assistive technology.
For visual diagrams, keep legends, stage labels, and qualifications readable at small sizes. If the graphic cannot adapt, provide a textual explanation of the relationship. Essential meaning should not disappear when the image is cropped, animation is disabled, or a screen reader encounters the section.
Keep methodological information close enough to find. A brief note beneath a table can state the comparison scope and direct readers to sources without overwhelming the rows. For a visual claim, explain what the segments represent and whether their widths have numerical meaning. Readers should not have to search a footer to discover that a seemingly measured chart is only a conceptual illustration.
Separate a missing fact from a negative result. If a capability has not been verified for an alternative, do not mark it unavailable merely to complete the matrix. Use an accurate qualified state or omit the claim until it can be checked. Consistent completeness is useful, but it cannot justify filling unknown cells with a favorable assumption.
Review the selected criteria with someone outside the product team. They may identify requirements that the seller's framing overlooks, such as migration effort or ongoing ownership. Those questions can make the comparison more useful even when they complicate a simple winning narrative.
Test by asking visitors to explain which alternative fits a scenario and what evidence informed their choice. If they repeat the seller's adjectives without understanding the criteria, the section may be persuasive but not informative. Refine the wording and supporting detail so the decision rests on interpretable differences.
Provide a relevant next step after evaluation. A product detail page, migration guide, pricing explanation, or demo may help the visitor resolve the remaining question. Keep the action connected to the comparison context instead of using the table only as a decorative lead-in to signup.
Consider whether a comparison is the right format at all. If the product's value can be explained more accurately through a workflow demonstration or customer story, that may be a better section. Use direct comparison when there are meaningful alternatives and reliable criteria, rather than forcing a contest because the layout seems convincing.
Name alternatives when doing so helps a real evaluation and the claims can be maintained accurately. Be clear about scope, plans, and sources. A category comparison can be useful when the choice is between approaches rather than specific brands.
Yes, when it is clearly presented as conceptual and does not imply unsupported measurements. If proportions or headline figures make a quantitative claim, explain the source and method. Keep an accessible textual explanation available.
Review them whenever relevant product or offer information changes, and establish a regular ownership process. The right interval depends on how quickly the claims change. Dates and retained sources help editors identify what needs checking.
Explore SaaS comparison section examples on SaaSFrame to compare evaluation criteria, competitor selectors, visual explanations, and evidence-aware presentation.