Generate a new design based on this screen using your own content.
Thank you! Your submission has been received!
Oops! Something went wrong while submitting the form.
# Design from Reference: Steep Analytics
Create an original, high-fidelity visual design inspired by the reference. Prioritize composition, typography, colors, spacing, and component styling over technical implementation.
## Reference
- **Product:** Steep
- **Category:** Analytics
- **Screenshot:** https://cdn.prod.website-files.com/5e9dc792e1210c5325f7ebbc/6acad56f86f1bee9c3650746_6acad49ac910b3adf9e4c4a7_cms-f11d617b462d5e9f6a05d820.webp
Analyze the screenshot first. If inaccessible, request it rather than guessing.
## Content
{{content.instructions}}
{{content.data}}
Preserve essential messaging and factual accuracy. Adapt structure and copy length for visual balance; never invent product claims.
## Visual Design
Use this context to reproduce the reference's visual language: layout, typography, colors, spacing, borders, radii, and distinctive elements. The screenshot takes priority if descriptions conflict.
## Direction
{{preferences.fidelityInstructions}}
## Output
{{output.instructions}}
Deliver a polished, cohesive design with precise alignment, hierarchy, and spacing. Produce the requested visual artifact, not just a description. If unsupported, explain the limitation.
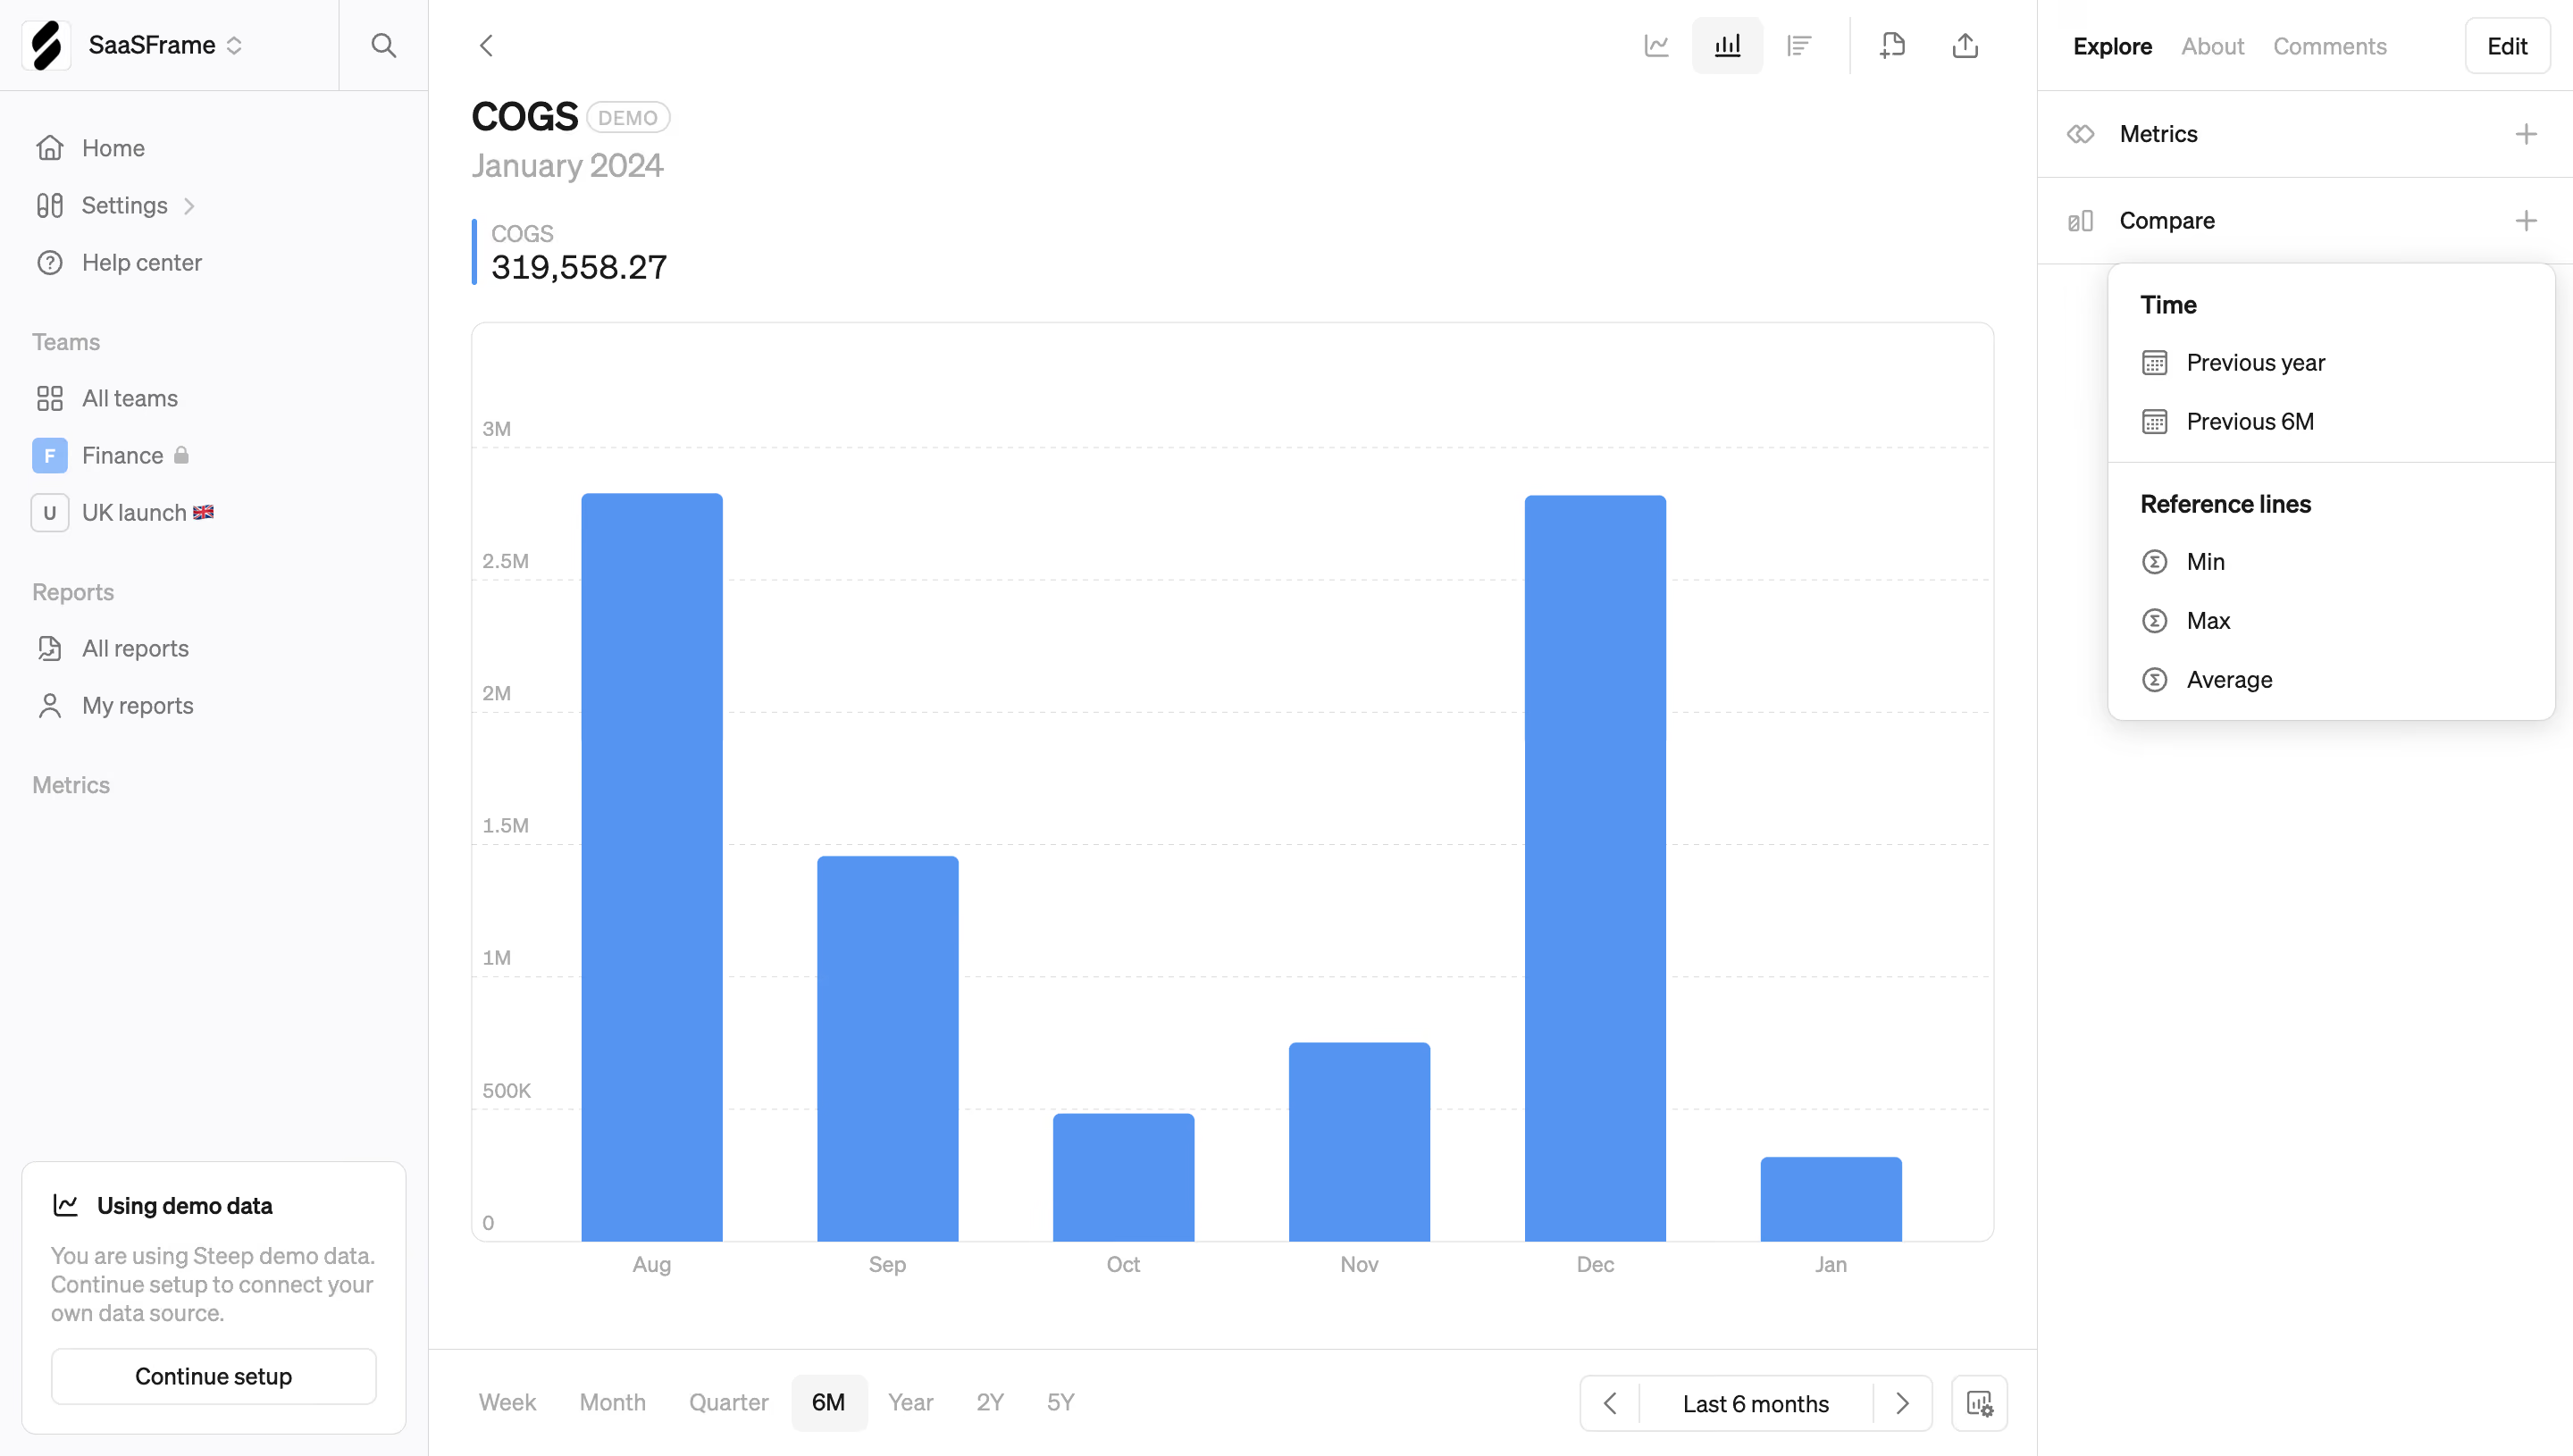
SaaSFrame's COGS metric page is a masterclass in restraint. The massive 319,558.27 figure hits you first. Bold, black, no decoration. You know exactly what matters the moment you land here.
The Bar Chart Does the Heavy Lifting
That soft blue bar chart dominates the center without feeling heavy. August and December spike tall while October dips low. The time range selector at the bottom (Week, Month, Quarter, 6M) is dead simple. No fancy toggles, just plain text buttons with the active "6M" pill highlighted. It works.
Sidebar That Earns Its Space
The right panel is smart. Compare options like "Previous year" and "Previous 6M" sit alongside reference lines for Min, Max, and Average. Everything's tucked into a collapsible structure that doesn't crowd the chart. The left nav uses tiny team emoji flags (that UK launch 🇬🇧 detail is a fun touch).
What Makes It Stand Out
Typography is confident. Plenty of whitespace. The whole page feels like it trusts the user to explore rather than overwhelming them with dashboards nobody asked for.