Overall Style and Aesthetic
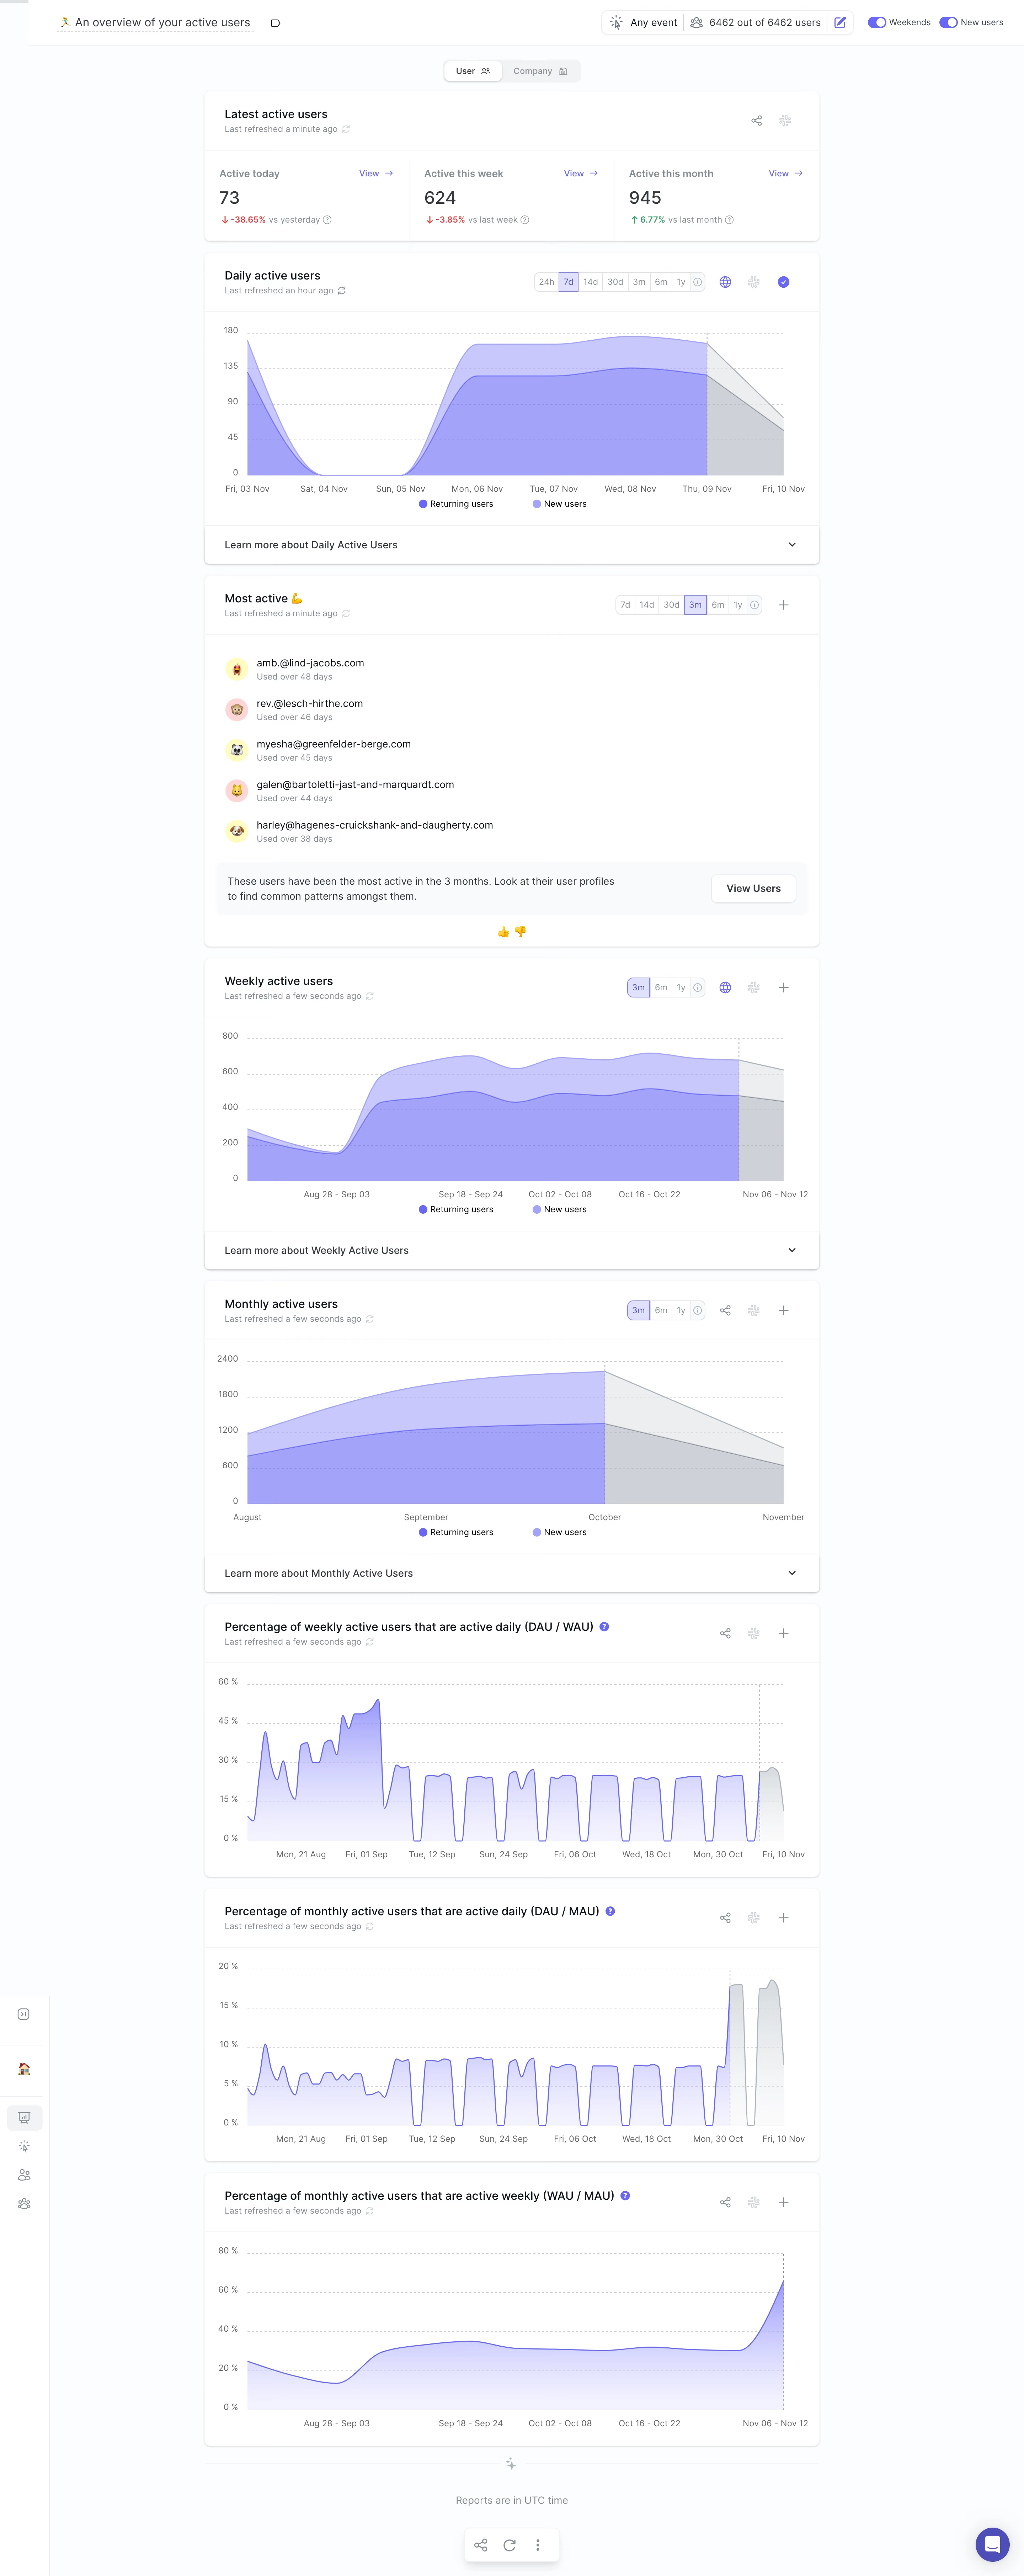
June Analytics embraces a sleek, minimalist aesthetic that balances professionalism with an approachable, modern vibe. White space dominates, giving data room to breathe and letting content shine. The interface feels light and uncluttered, ideal for analytical SaaS products aiming for clarity. Layout and Structure
The page adopts a streamlined dashboard style, forgoing traditional hero banners for immediate immersion in actionable data. The modular card layout stacks data visualizations, trend summaries, and filter controls efficiently. Navigation remains persistent along the left, ensuring users can jump between reports effortlessly. Visual Elements
Vivid charts and graphs are the visual stars, employing soft accent gradients and crisp lines that command user attention without overwhelming. Subtle, animated loading indicators communicate responsiveness. Delicate icons support actions and filters, while the absence of intrusive photography keeps focus on insights. Color Palette and Typography
A refined palette of cool blues, soft grays, and occasional teal accents exudes tech-forward sophistication. San-serif fonts, likely Inter or similar, offer readable, scalable text, with headlines bolded and body copy lightweight, reinforcing hierarchy and legibility at a glance. User Experience Patterns
Sticky navigation and filter tools enhance discoverability and empower user-driven exploration. Clear, high-contrast CTAs—such as "Export" or "Drill down"—guide users to the next step. Hover states provide immediate feedback, and interactive charts invite deep dives without ever feeling overwhelming. Unique or Notable Design Choices
June’s decision to drop conventional dashboards in favor of report-driven layouts is striking. Prioritizing direct access to metrics by user level showcases a user-centric philosophy. The relaxed, analytics-first tone inspires trust and invites engagement, while micro-interactions subtly guide, never distract.