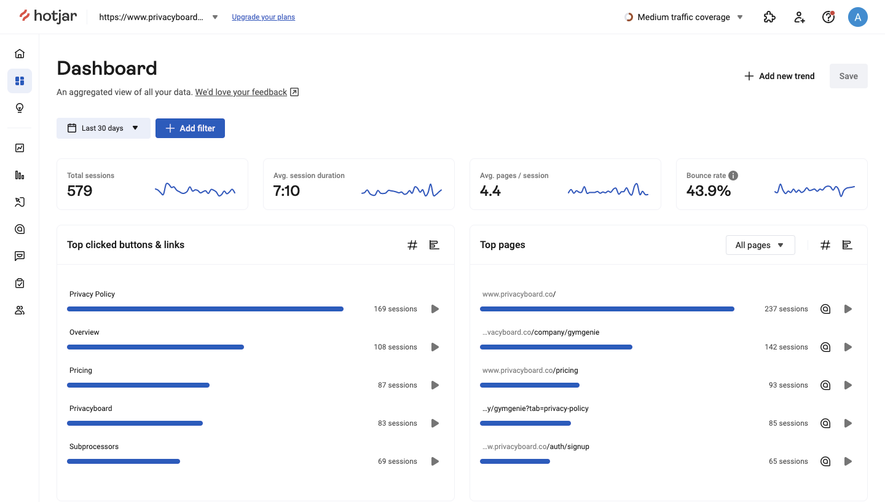
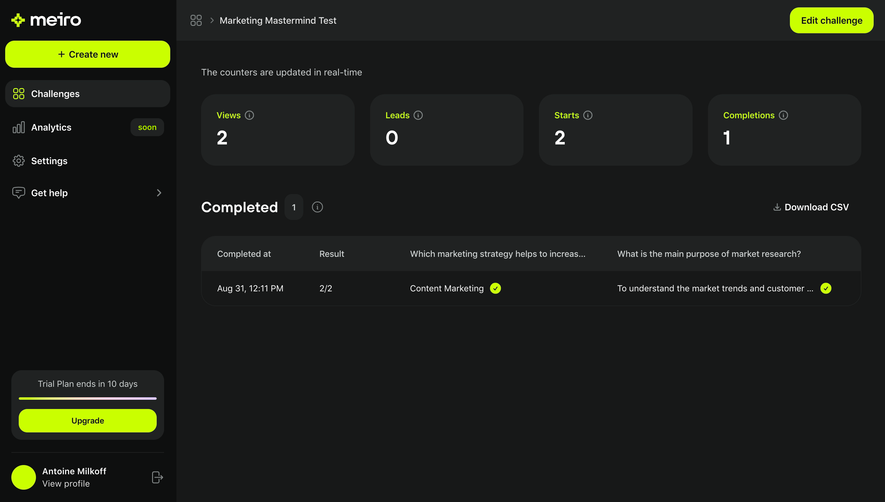
Generate a new design based on this screen using your own content.
Thank you! Your submission has been received!
Oops! Something went wrong while submitting the form.
# Design from Reference: Visitors Analytics Dashboard
Create an original, high-fidelity visual design inspired by the reference. Prioritize composition, typography, colors, spacing, and component styling over technical implementation.
## Reference
- **Product:** Visitors
- **Category:** Analytics
- **Screenshot:** https://cdn.prod.website-files.com/5e9dc792e1210c5325f7ebbc/6acad3a6c2028efdec71afbc_6acad14fb2165b6c7fffb4ec_cms-570524b0bd34553d92eb68b5.webp
Analyze the screenshot first. If inaccessible, request it rather than guessing.
## Content
{{content.instructions}}
{{content.data}}
Preserve essential messaging and factual accuracy. Adapt structure and copy length for visual balance; never invent product claims.
## Visual Design
Use this context to reproduce the reference's visual language: layout, typography, colors, spacing, borders, radii, and distinctive elements. The screenshot takes priority if descriptions conflict.
## Direction
{{preferences.fidelityInstructions}}
## Output
{{output.instructions}}
Deliver a polished, cohesive design with precise alignment, hierarchy, and spacing. Produce the requested visual artifact, not just a description. If unsupported, explain the limitation.
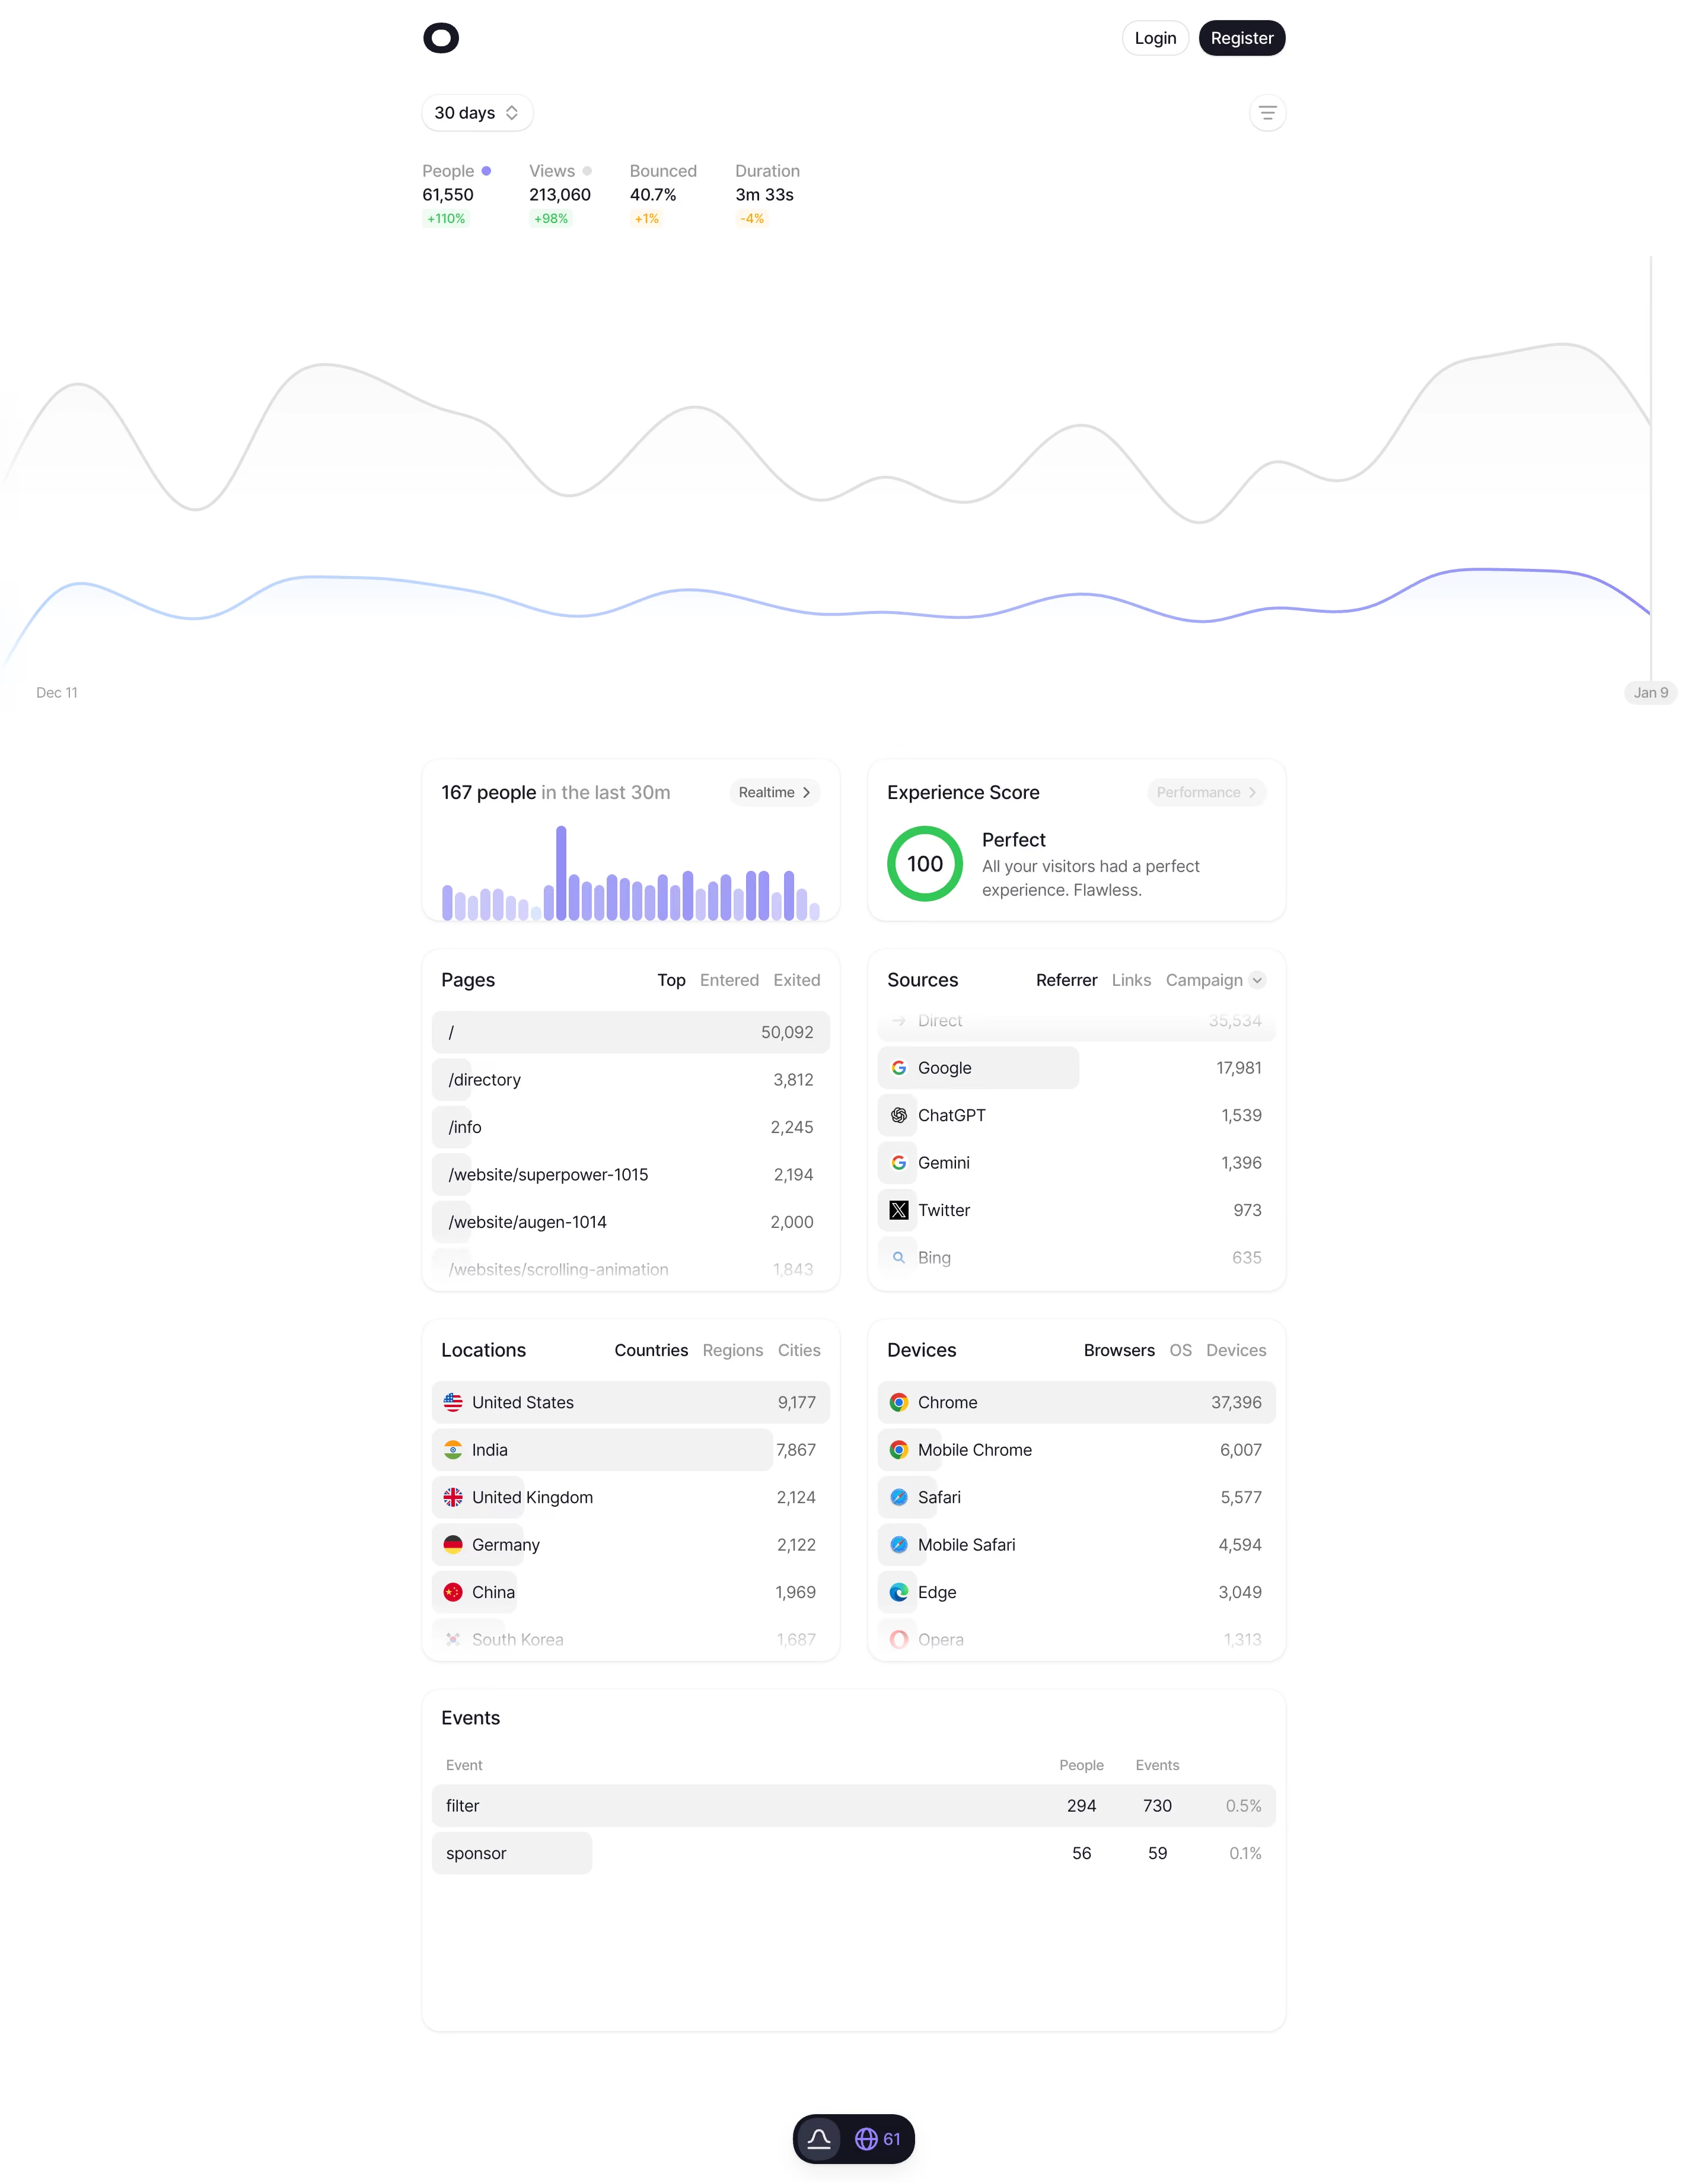
This is an analytics dashboard that actually breathes. The amount of white space here is generous, almost editorial, and it makes a dense data page feel completely approachable. Your eye lands on the big numbers first: 61,550 people, 213,060 views. The green and red percentage badges give you instant context without needing to think.
Layout That Just Works
Everything sits in a clear two-column grid below the main chart. Pages on the left, Sources on the right. Locations paired with Devices. It's predictable in the best way. The traffic graph up top uses soft purple and gray lines that feel almost ambient. Not fighting for attention, just providing shape. That perfect 100 Experience Score in green is a satisfying little moment of visual reward.
What Makes It Stand Out
The typography is clean and consistent. Numbers are bold, labels are light. No unnecessary icons cluttering things up. The realtime badge with 167 people and that tiny bar chart spark is a great detail. It feels like a tool built by someone who actually uses analytics daily.