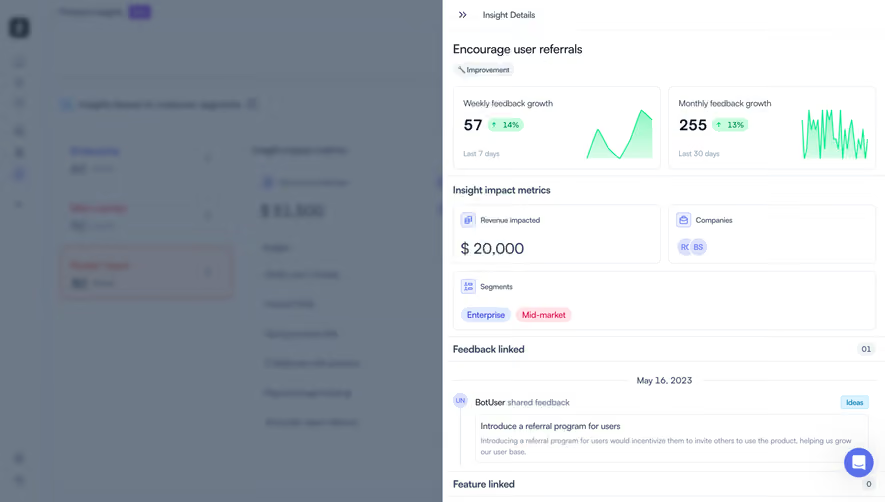
Design with AI
Generate a new design based on this screen using your own content.
# Design from Reference: Mixpanel Analytics
Create an original, high-fidelity visual design inspired by the reference. Prioritize composition, typography, colors, spacing, and component styling over technical implementation.
## Reference
- **Product:** Mixpanel
- **Category:** Analytics
- **Screenshot:** https://cdn.prod.website-files.com/5e9dc792e1210c5325f7ebbc/6acadd226cd44b3ad4d9d471_6acadc32a3626825714292f6_cms-63833007c5a2a563a70f6ff1.webp
Analyze the screenshot first. If inaccessible, request it rather than guessing.
## Content
{{content.instructions}}
{{content.data}}
Preserve essential messaging and factual accuracy. Adapt structure and copy length for visual balance; never invent product claims.
## Visual Design
### Overall aesthetic
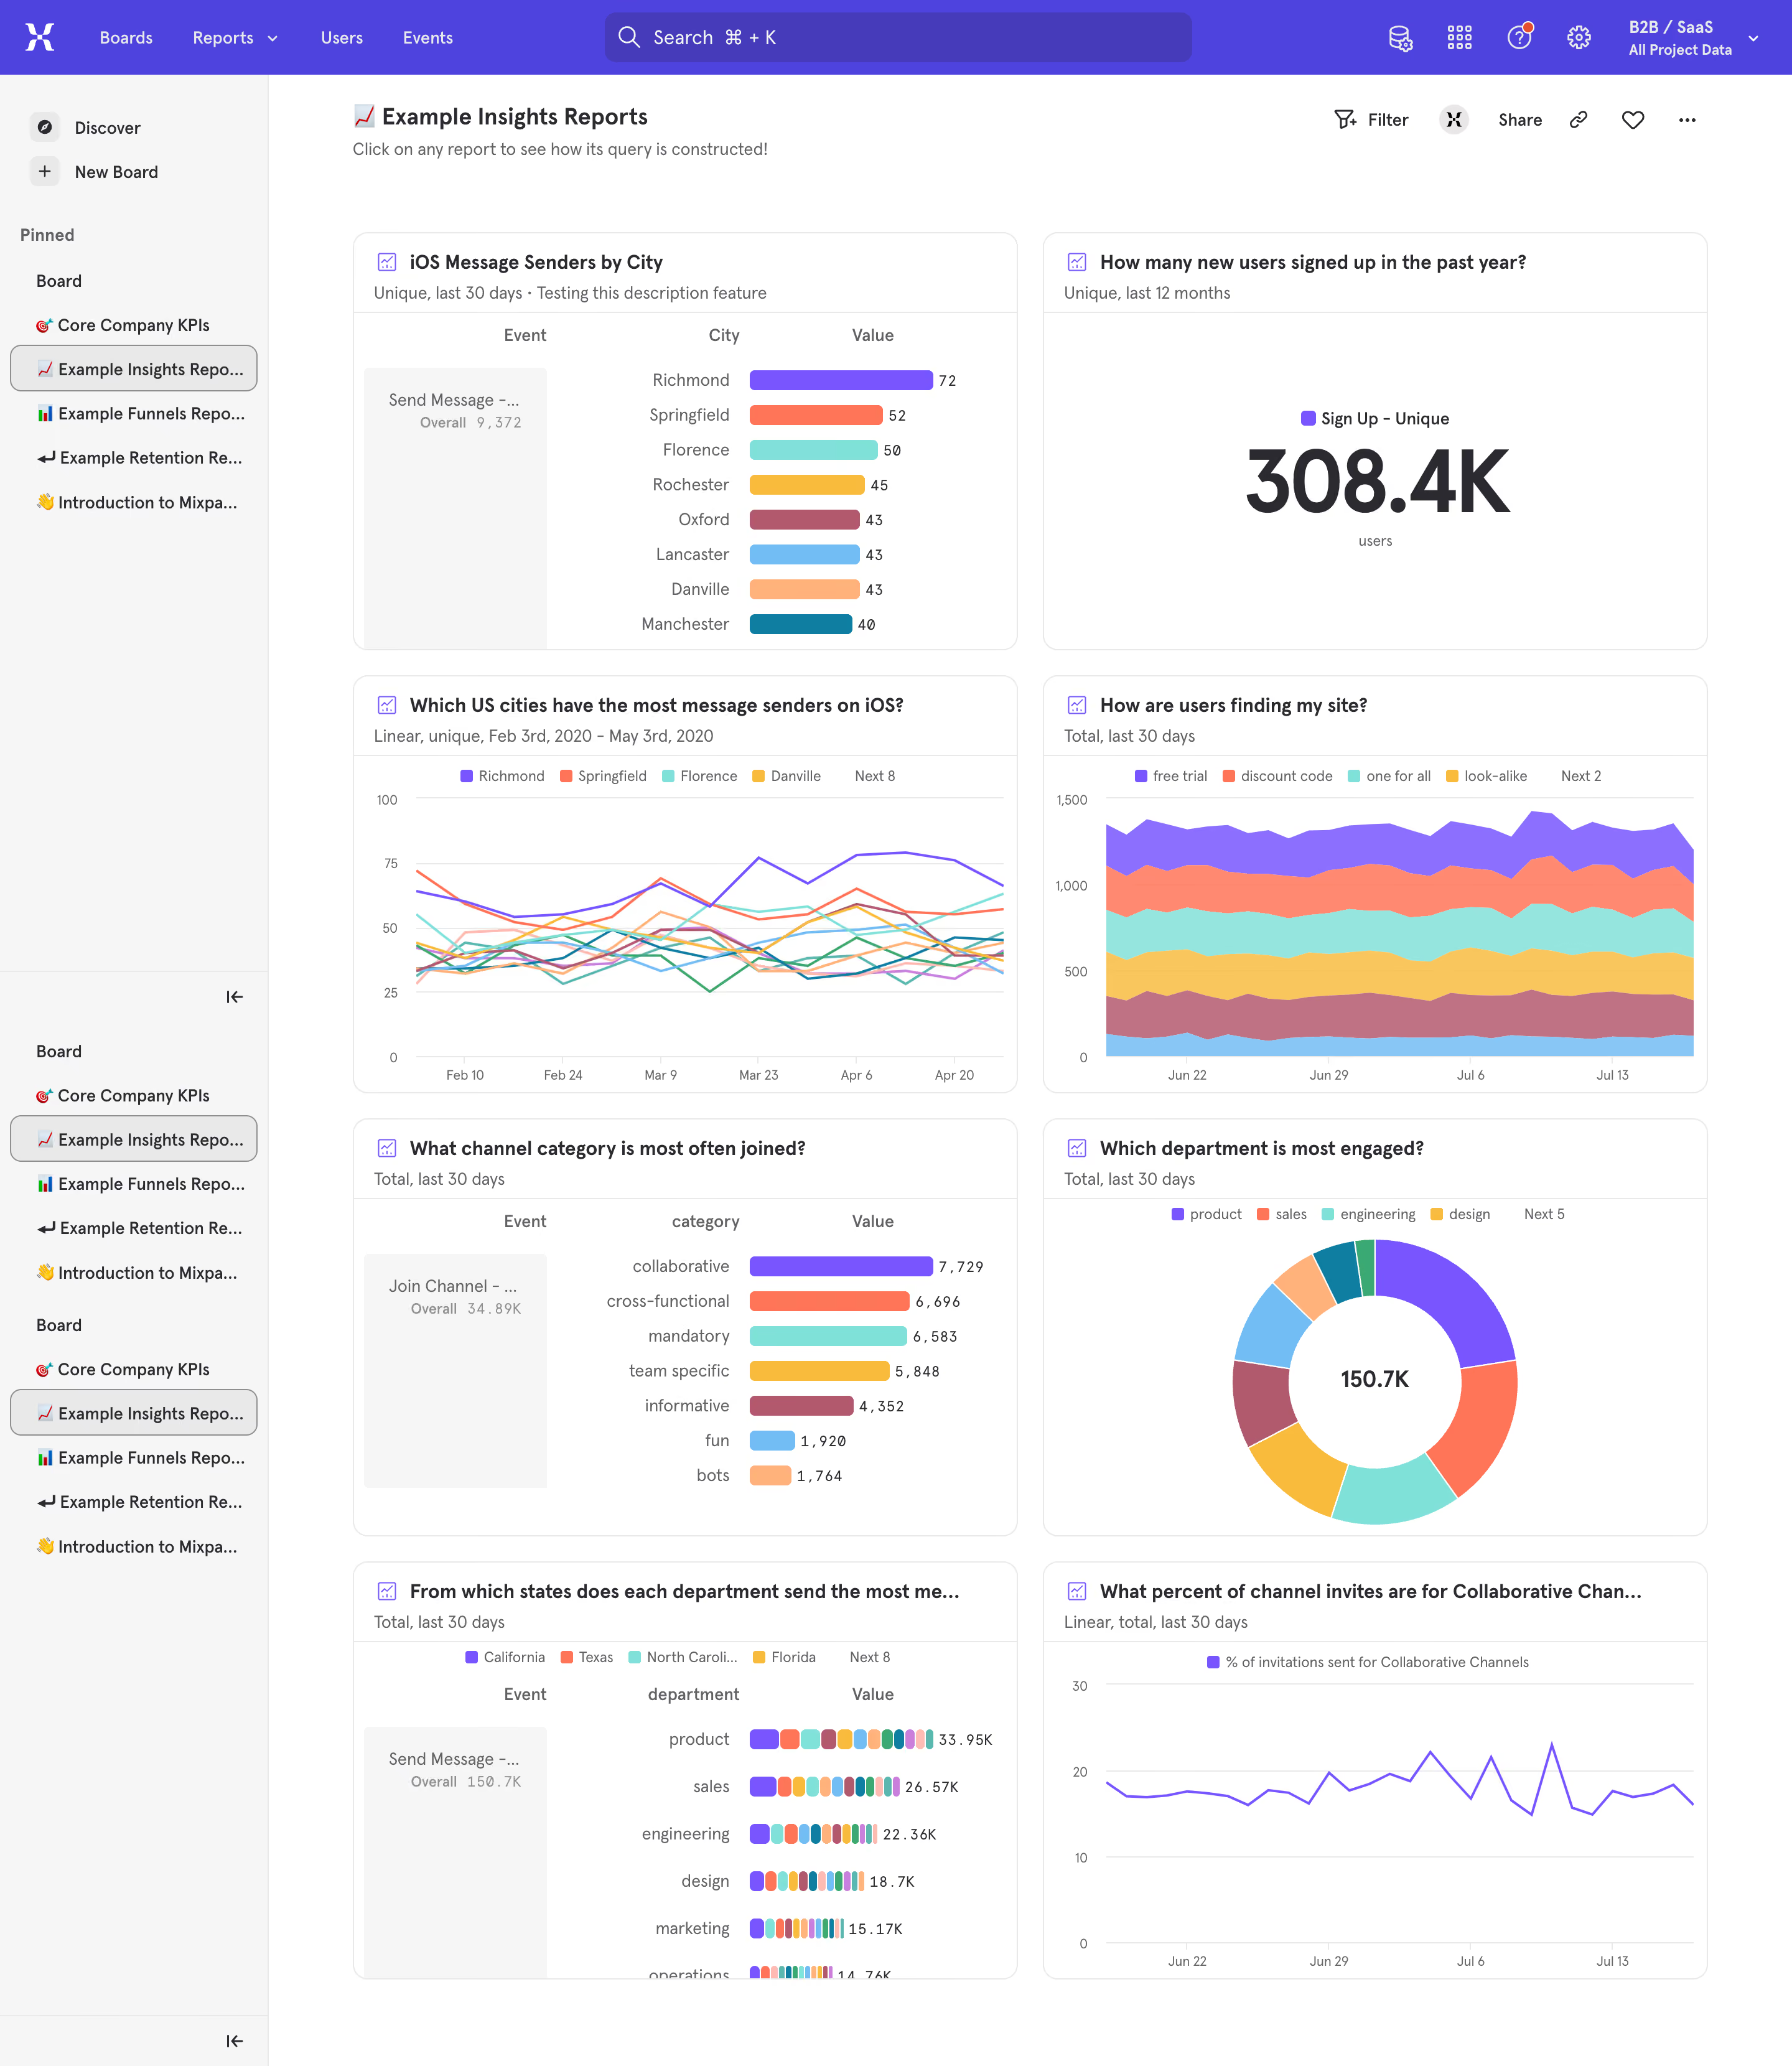
- **Character:** A dense analytics board with a purple global header, pale sidebar and repeated white chart cards using a bright categorical palette.
- **Evidence scale:** Original 2880 × 3320 pixels, inspected through both readable crops. CSS estimates assume an unverified 2× capture scale.
### Page composition
- **Top bar:** Purple navigation with logo, Boards/Reports/Users/Events links, wide search and icon utilities/project selector.
- **Sidebar:** Approximately 216 px pale rail with discovery/new-board controls and repeated board groups; current report is outlined.
- **Main header:** Board title and small instruction line left, filter/share/link/favorite/more utilities right.
- **Grid:** Two chart columns and four rows fill the main area. The final row ends near the screenshot bottom.
- **Chart types:** Ranked horizontal bars, single metric, multi-series lines, stacked area, another ranking, donut, stacked categorical bars and a purple line chart.
### Information hierarchy
- **Board identity:** Bold title identifies example insight reports.
- **Card headings:** Each chart has a bold question/title and smaller measure/time metadata.
- **Primary metric:** The large 308.4K numeral dominates its card.
- **Data:** Color-coded legends associate multiple series; axis labels and values remain small.
- **Selection:** Sidebar current board uses a pale outlined rounded row.
### Typography
- **Board title:** Unverified sans-serif, approximately 18–20 px semibold.
- **Chart titles:** Around 14–16 px semibold; metadata around 12–13 px regular.
- **Large metric:** Approximately 68–72 px bold with tight tracking.
- **Axes/legends:** Roughly 10–12 px regular.
- **Navigation/sidebar:** Approximately 12–14 px medium; some long labels truncate.
### Colors & surfaces
- **Base:** White #FFFFFF cards/main region.
- **Sidebar:** Pale #F6F6F6.
- **Header:** Purple #5142E9, with darker #483CC2 search surface.
- **Ink/structure:** Dark #2A2A30 headings and light #E9E9E9 borders.
- **Data palette:** Purple #926EFF family, cyan #79E8DF and additional coral, yellow, teal, pink and sky-blue categories.
### Components
- **Chart cards:** Approximately 534 × 336 px, 12 px radii, thin gray outlines and divided header bands.
- **Rankings:** Pale event-summary block left, centered category labels, rounded colored bars and right-aligned numbers.
- **Metric card:** Small legend above a huge centered numeral and tiny unit label.
- **Line/area plots:** Fine horizontal gridlines, sparse date ticks and small legends above.
- **Donut:** Multicolor ring with centered total and category legend above.
- **Toolbar:** Small outline icons, plain labels and ellipsis rather than large buttons.
- **Sidebar items:** Emoji/icons, truncated names and rounded selection outlines.
### Visual rhythm
- **Grid spacing:** Approximately 20 px gaps between cards, with aligned header baselines.
- **Header spacing:** Roughly 60 px separates board header and first chart row.
- **Consistency:** Stable card anatomy lets varied chart forms coexist.
- **Density:** Compact labels and broad plotting regions balance a large amount of information.
### Responsive
- **Observed limit:** Desktop board only; mobile charts are unverified.
- **Recommendation:** Collapse navigation and stack charts while preserving card headers and units.
- **Chart handling:** Reduce tick/legend density or enable horizontal scrolling without detaching labels from series.
### Adaptation guidance
- **Retain:** Use consistent card structure and a shared categorical palette across different analytical views.
- **Implement:** Reserve the saturated header for global navigation and let charts carry most local color.
- **Verify:** Confirm fonts, dimensions and data/query semantics separately; values are observed screenshot content, not live analytics.
Use this context to reproduce the reference's visual language: layout, typography, colors, spacing, borders, radii, and distinctive elements. The screenshot takes priority if descriptions conflict.
## Direction
{{preferences.fidelityInstructions}}
## Output
{{output.instructions}}
Deliver a polished, cohesive design with precise alignment, hierarchy, and spacing. Produce the requested visual artifact, not just a description. If unsupported, explain the limitation.