Found in 0 flow
No items found.

Upgrade to SaaSFrame Pro now to see similar examples.

Monthly

$14 /month

Billed $14 monthly
Browse all screens & flows
Filter and search screens & flows
Bookmark items
Access Figma files
Access mobile versions
Join now

Quarterly

$12 /month

Billed $36 quarterly
Browse all screens & flows
Filter and search screens & flows
Bookmark items
Access Figma files
Access mobile versions
Join now

Yearly

$10 /month

Billed $120 yearly
Browse all screens & flows
Filter and search screens & flows
Bookmark items
Access Figma files
Access mobile versions
Join now

Biggest SaaS library.

Browse website pages, product interfaces and emails from a growing library of hundreds of SaaS.

Desktop & mobile versions.

Switch from desktop to mobile versions to see how the best designers make websites responsive.

Access the Figma files.

You like a design? Download the Figma file of any website page you see on SaaSFrame.

Advanced filtering.

Use filters to find the design or copywriting inspiration that you need in seconds.
Thank you! Your submission has been received!
Oops! Something went wrong while submitting the form.

Let it flow.

Discover the user journey of the best SaaS with interfaces organized in flows.

Save design inspirations.

Bookmark screens and flows so you can find them any time you need it.
โŒ˜
B
BOOKMARK DESIGN
Start your design
research
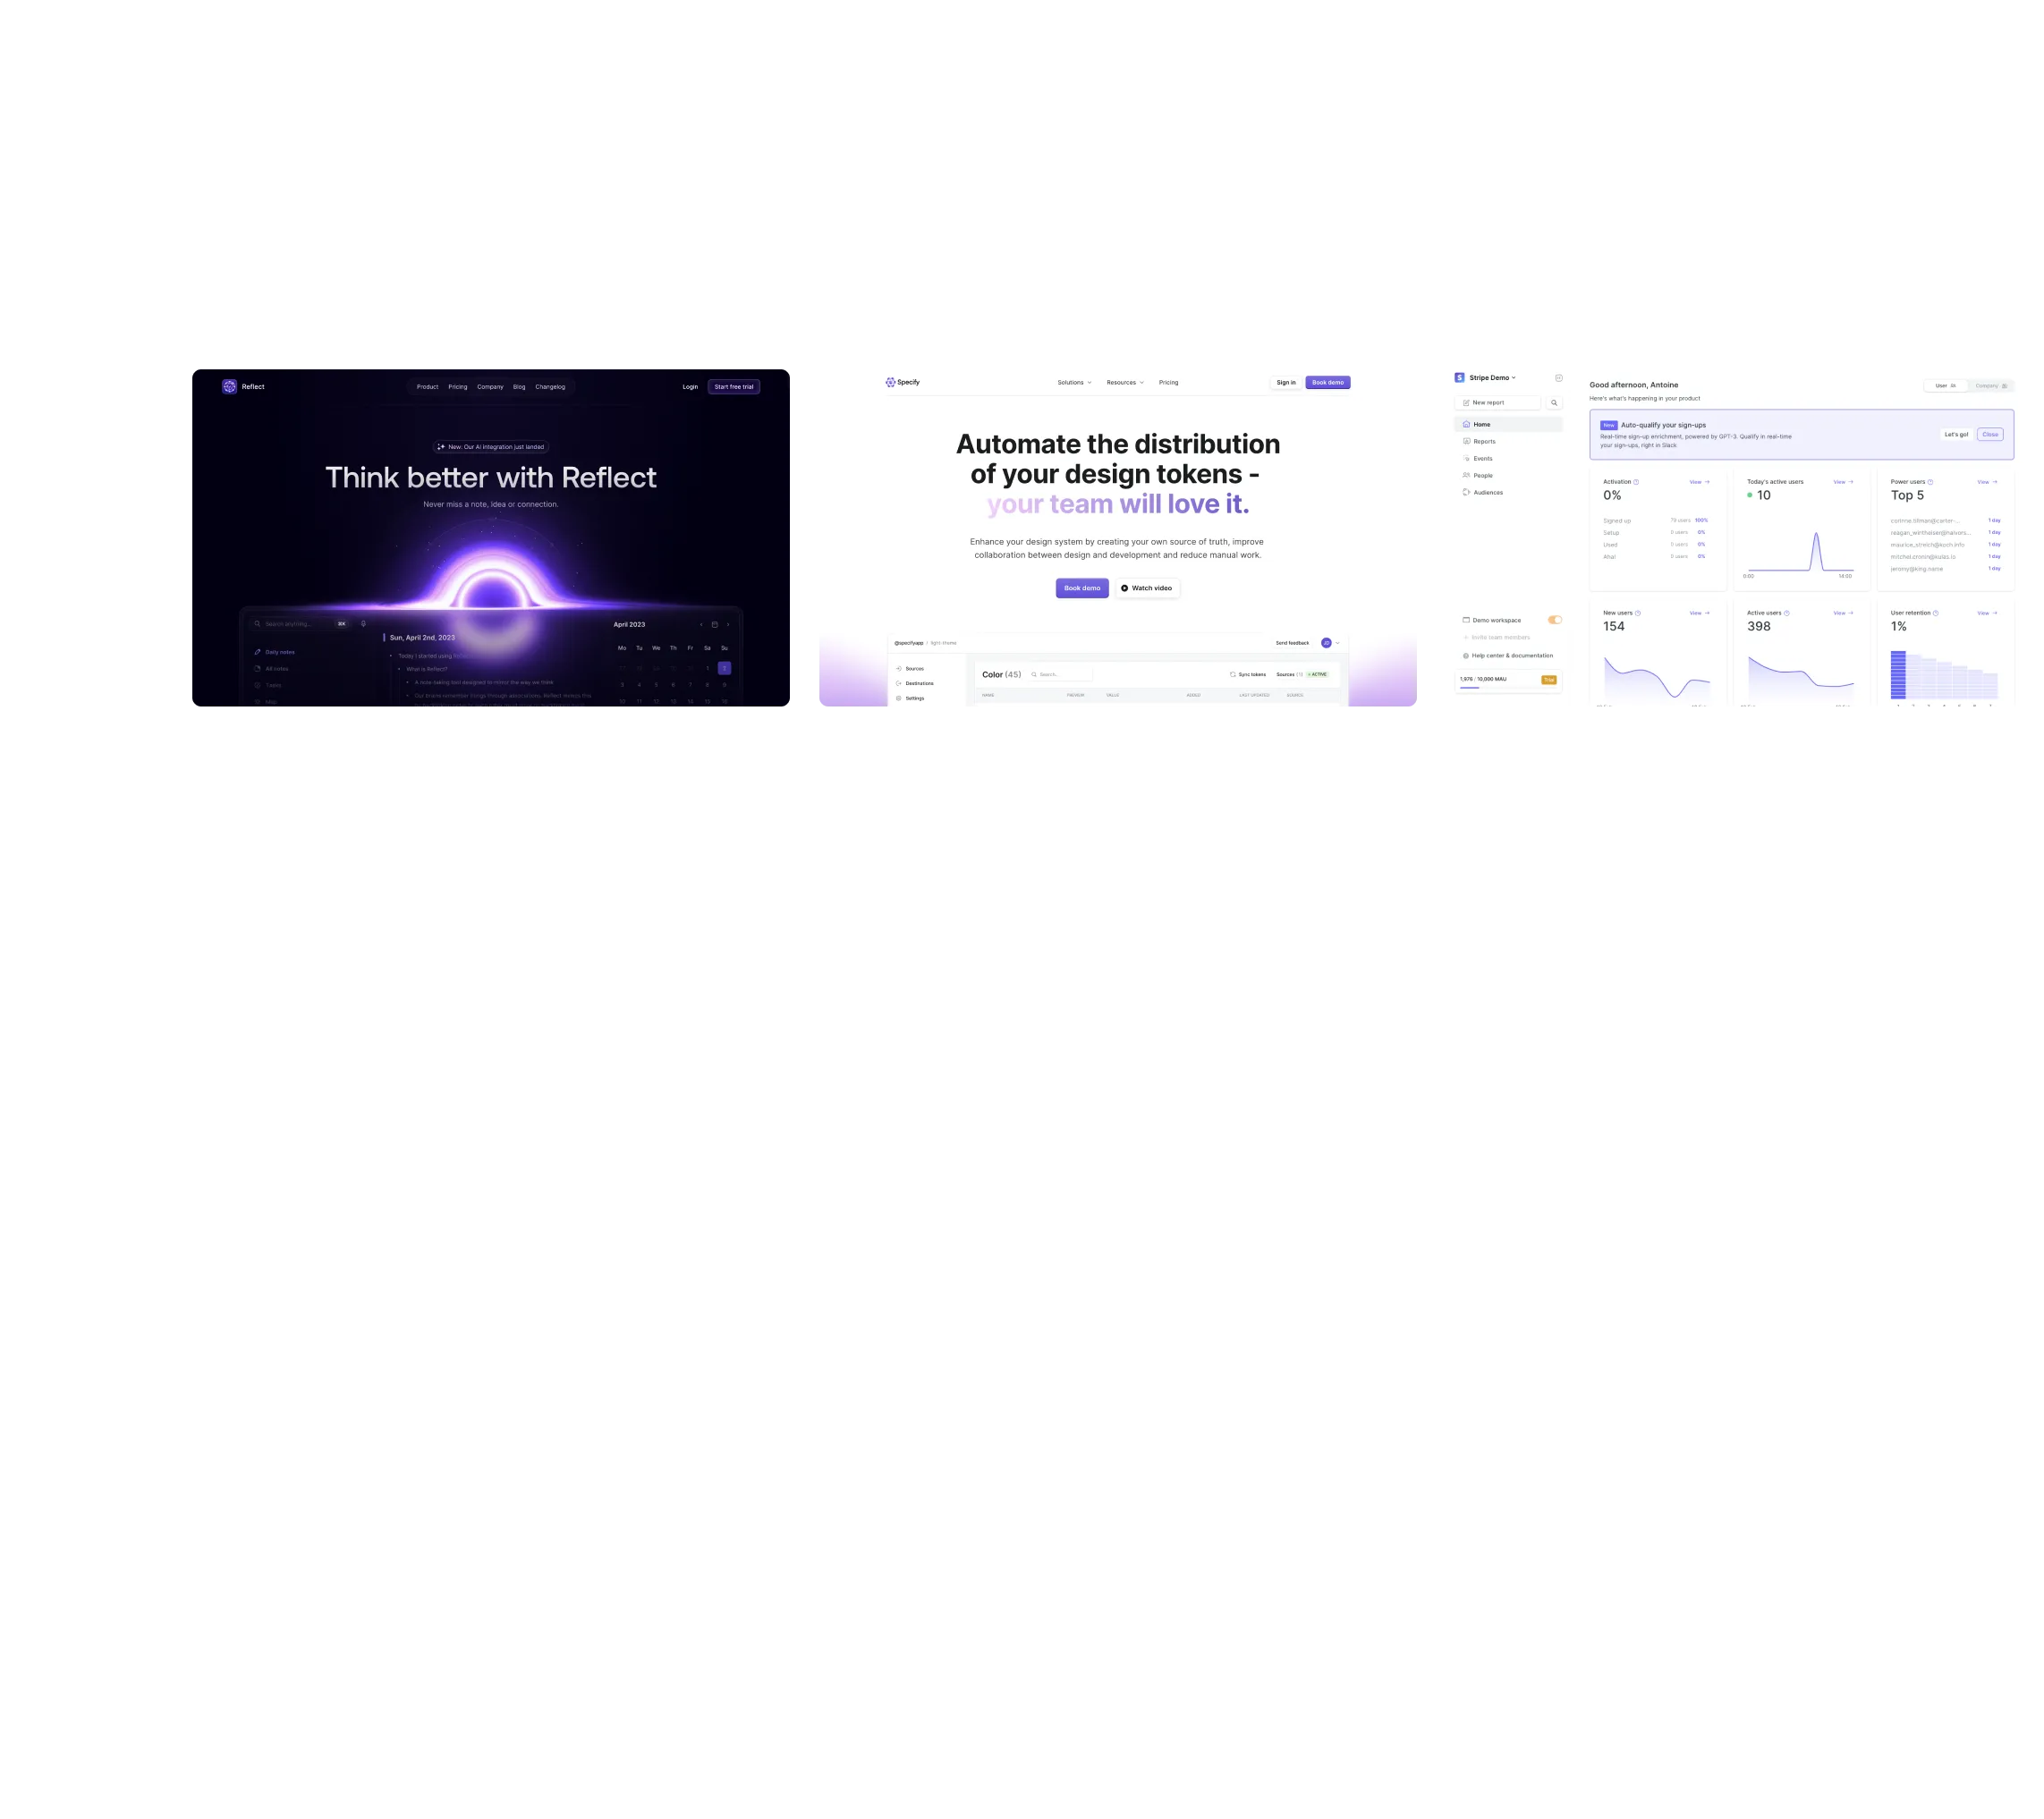
Three website screenshots showing a design tool and distribution dashboard for design tokens, promoting ease and automation.

How do you process payment?

SaaSFrame subscriptions are sold on Lemon Squeezy, a secured online selling platform for creators.

What about future updates and versions?

SaaSFrame gets updated all the time! Every new update and version will immediately be made available to all SaaSFrame users.

Can you send me an invoice?

You can generate an invoice on your Lemon Squeezy portal once you purchased SaaSFrame. You will find the link in the order confirmation email.

How can I cancel my membership subscription?

You can cancel your membership subscription at any moment on your profile page.โ€

Can I get a refund?

If you're not satisfied, you can ask for a refund within 7 days. Just send me an email at antoine[at]unmake[dot]io

I have another question.

You can send me an email at antoine[at]unmake[dot]io, I'll be happy to help with any questions.

No items found.

Mixpanel Report Takeaways Structure

Overall Style and Aesthetic

Mixpanelโ€™s โ€œState of Product Analytics in 2020โ€ page embodies a contemporary, minimalist sensibility, exuding professional confidence with playful undertones. The interface is visually tidy, utilizing generous white space that accentuates content and visual components while keeping the layout inviting and easy to scan.

Layout and Structure

The page flows like a well-composed story: a standout hero section draws attention with bold typography and a succinct synopsis. The main body uses logical divisions, including data-rich infographics, pull quotes, and summary sections that guide the eye smoothly down the page. Thereโ€™s a clear absence of aggressive sales CTAs, allowing the focus to remain on educational content.

Visual Elements

Dynamic, custom illustrations replace conventional photography, infusing the article with a modern, tech-forward flair. Subtle animations accentuate infographics, making data points engaging rather than static. Simple iconography supplements calls to action and navigational cues without distracting from the content.

Color Palette and Typography

A monochrome base is punctuated by Mixpanelโ€™s signature purples and blues, promoting brand consistency and emphasizing key stats. Sleek sans-serif fonts establish clarity and hierarchy, with bold headlines and medium-weight body text for optimal legibility. The design uses color blocks and lines to guide reading order intuitively.

User Experience Patterns & Unique Choices

Persistent top navigation and sticky reading progress indicators aid orientation. CTAs are contextually subtle, reflecting a user-centric, trust-building approach. Uniquely, infographics double as visual storytelling devicesโ€”encouraging dwell time and comprehension.

Tone and Feel

Throughout, the tone is authoritative but friendly, radiating innovation and reliabilityโ€”an inviting reference for SaaS teams seeking to make data approachable and actionable through design.