Generate a new design based on this screen, using your own content.
Preview the prompt
# Design from Reference: Buffer Analytics

Create an original, high-fidelity visual design inspired by the reference. Prioritize composition, typography, colors, spacing and component styling over technical implementation.

## Reference

- **Product:** Buffer
- **Category:** Analytics
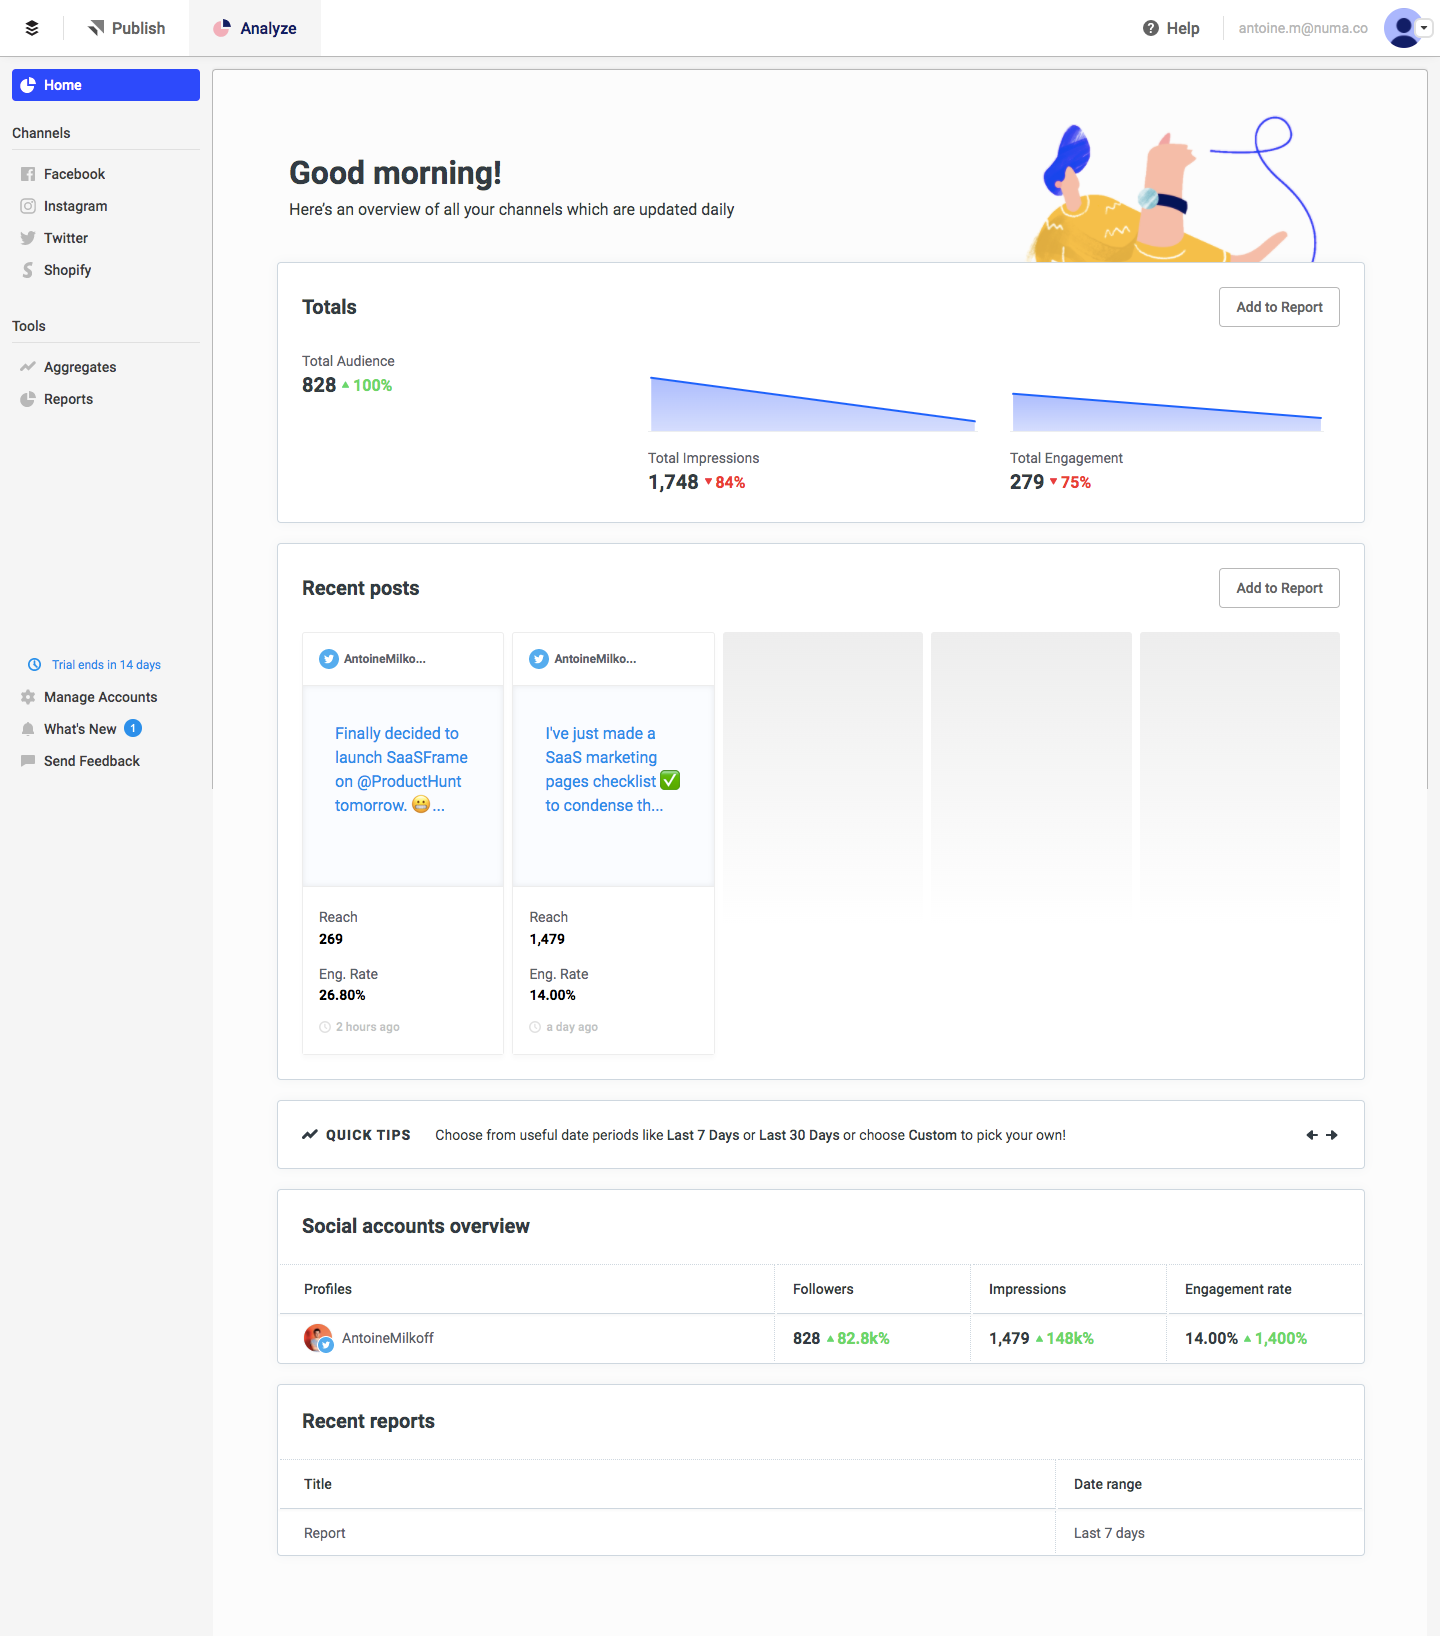
- **Screenshot:** https://media.saasframe.io/o/20169dd7a4f3d2b23464.webp

Analyze the screenshot first. If you can’t access it, ask me for it rather than guessing.

## Content

**Instructions:**

Generate realistic example content that fits the selected design reference.

Create appropriate headlines, descriptions, labels, buttons, and supporting copy based on the type of interface being designed.

If a product or business description is provided, use it to guide the content.

Otherwise, invent a plausible fictional SaaS product appropriate for the reference.

Keep the content concise, coherent, and visually balanced.

Do not present fictional statistics, customer names, or testimonials as verified facts.

Preserve essential messaging and factual accuracy. Adapt structure and copy length for visual balance; never invent product claims.

## Visual design

Use this context to reproduce the reference’s visual language: layout, typography, colors, spacing, borders, radii and distinctive elements. The screenshot takes priority if descriptions conflict.

### Overall aesthetic

- **Style:** A light, utilitarian social analytics dashboard with compact typography, quiet borders, and modest blue chart accents.
- **Density:** Several reporting modules share one workspace; white cards and generous internal padding keep the data approachable.

### Page composition

- **Capture and scale:** The image is 1440 × 1636 screenshot pixels. Approximate sizes refer to screenshot pixels; the original CSS scale is unknown.
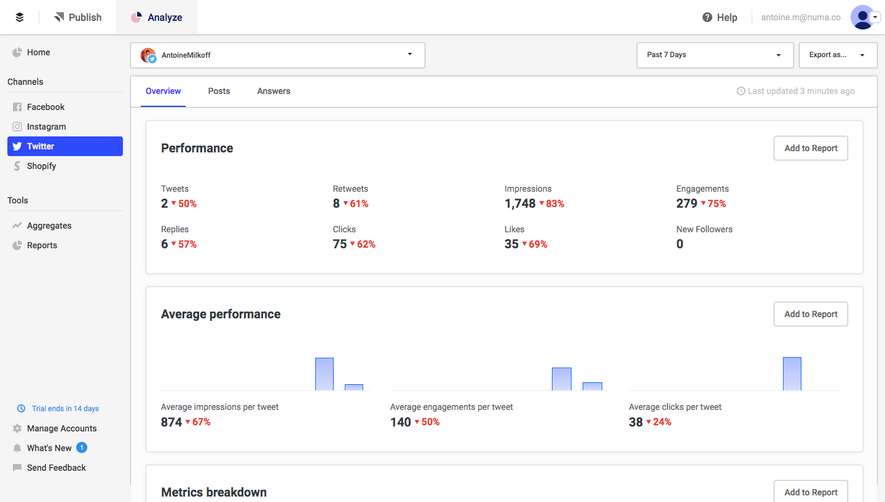
- **Application shell:** A shallow white top bar contains the brand, Publish/Analyze navigation, help, and account controls. A roughly 210 px pale sidebar contains Home, channel links, tools, and lower account/help utilities.
- **Workspace:** The main region begins with a greeting and short explanatory line, with a small character illustration at the upper right. Below sit Totals, Recent posts, a Quick Tips strip, social-account metrics, and a short recent-reports list.
- **Alignment:** Cards share a broad left and right edge, occupying approximately 1090 px inside the workspace, with roughly 20 px vertical gaps.

### Information hierarchy

- **Overview:** The greeting introduces the workspace; the three-column totals module supplies the strongest numeric emphasis.
- **Content and detail:** The recent-post preview supports the aggregate metrics with individual content. The account table and report list form lower-priority detail.
- **Actions:** Small Add to Report controls sit at the top right of reporting cards, visually subordinate to headings and values.

### Typography

- **Family:** The interface uses a narrow, neutral sans serif; an exact family cannot be confirmed from pixels.
- **Role sizes:** Estimate the greeting at 30–32 px bold, card headings around 20 px bold, and ordinary interface text at 14–16 px.
- **Data hierarchy:** Large numeric totals contrast with small metric labels and percentage changes. Post metadata and timestamps are approximately 12 px.
- **Line-height:** Use compact 1.2–1.3 line-height for headings and figures, and approximately 1.4–1.5 for post copy and supporting sentences.

### Colors & surfaces

- **Surfaces:** Sampled sRGB surfaces include #FFFFFF, #FCFCFC, #F5F5F5, #FAFCFF, #FBFBFB, #F9F9F9, and #FAFAFA. The subtle differences support shell, cards, and placeholders.
- **Dividers:** A sampled blue-gray #CED7DF provides a suitable reference for the fine card and table boundaries.
- **Semantic accents:** Blue marks selected navigation and area charts; green indicates increases and red decreases. Exact chart and semantic accent hex values are not verified.
- **Text:** Dark charcoal headings and muted gray secondary labels maintain a restrained contrast hierarchy.

### Components

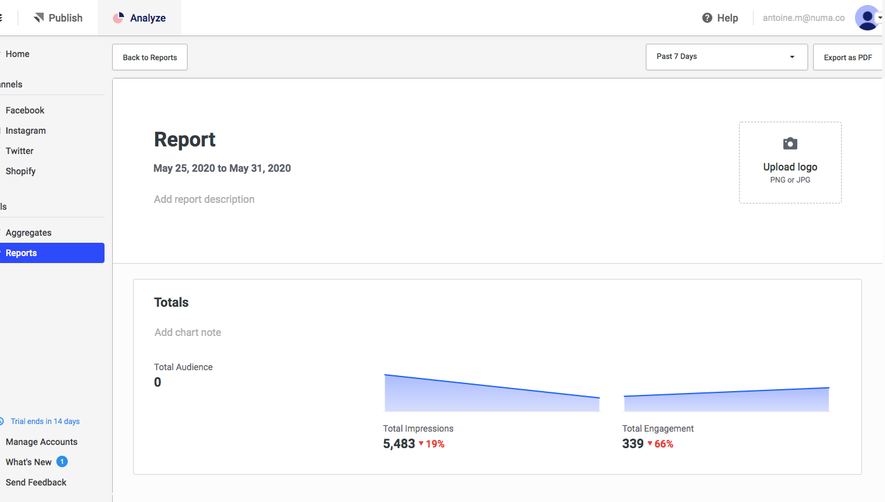
- **Totals:** Three side-by-side metrics show audience, impressions, and engagement. Thin blue area sparklines appear with the latter metrics; percentages sit close to the totals.
- **Post previews:** Five narrow columns are visible: two populated Twitter-style post cards and three pale placeholder panels. Populated cards include avatar/name, post text, reach and engagement metrics, and timestamps.
- **Cards:** Use thin borders, approximately 3–4 px radii, and around 24 px internal padding. Avoid pronounced drop shadows.
- **Supporting modules:** The tips strip combines a small icon, label, sentence, emphasized period, and directional controls. The social table aligns one account row beneath metric columns; reports use a simpler title/date-range layout.

### Visual rhythm

- **Spacing:** Use a repeatable 20–24 px module spacing and 24 px card padding, with tighter 8–12 px gaps between labels and related data.
- **Data alignment:** Keep baseline and column alignment consistent across totals, post metrics, and the account table.
- **Visual balance:** The small colored illustration softens the top region while the remainder relies on typography, charts, and subtle boundaries.

### Responsive

- **Observed state:** Only the desktop dashboard is visible.
- **Recommended reflow:** Collapse the sidebar to a drawer, stack total metrics at narrow widths, and turn post previews into a horizontal scroller or a single-column list.
- **Tables and controls:** Preserve metric labels when account columns reflow. Keep report controls accessible without squeezing them into chart or heading space.

### Adaptation guidance

- **Preserve:** Keep the shell/sidebar/content relationship, the overview-to-detail order, fine borders, compact data typography, and consistent reporting actions.
- **Adapt data:** Replace social channels, metrics, posts, and reports with the new product's actual information. Use meaningful empty states where data is missing.
- **Chart discipline:** Maintain a consistent chart scale and semantic change colors. Do not recreate the reference's values or use its placeholder panels as fabricated content.

## Direction

**Instructions:**

Use the reference screenshot as the main source of visual inspiration rather than a strict layout template.

Preserve its most distinctive design characteristics, such as typography, visual rhythm, color relationships, component treatments, and overall aesthetic.

Feel free to modify section arrangements, proportions, spacing, and individual components to better suit my content.

Introduce original design decisions where they improve usability, composition, or brand consistency.

The result should clearly reflect the reference's visual language without looking like a direct reproduction.

## Output

**Instructions:**

Generate a high-fidelity visual mockup of the requested interface.

Present the design as a polished, realistic website or product UI screenshot.

Prioritize visual composition, typography, spacing, colors, alignment, and component details.

Use the available image-generation or visual-design capabilities.

Do not replace the mockup with source code, a written design specification, or a textual description.

If direct visual generation is unavailable, clearly explain the limitation.

Deliver a polished, cohesive design with precise alignment, hierarchy and spacing. Produce the requested visual artifact, not just a description. If unsupported, explain the limitation.
 SaaSFrame