 SaaSFrame
Part of Cirra Analytics Page Creation
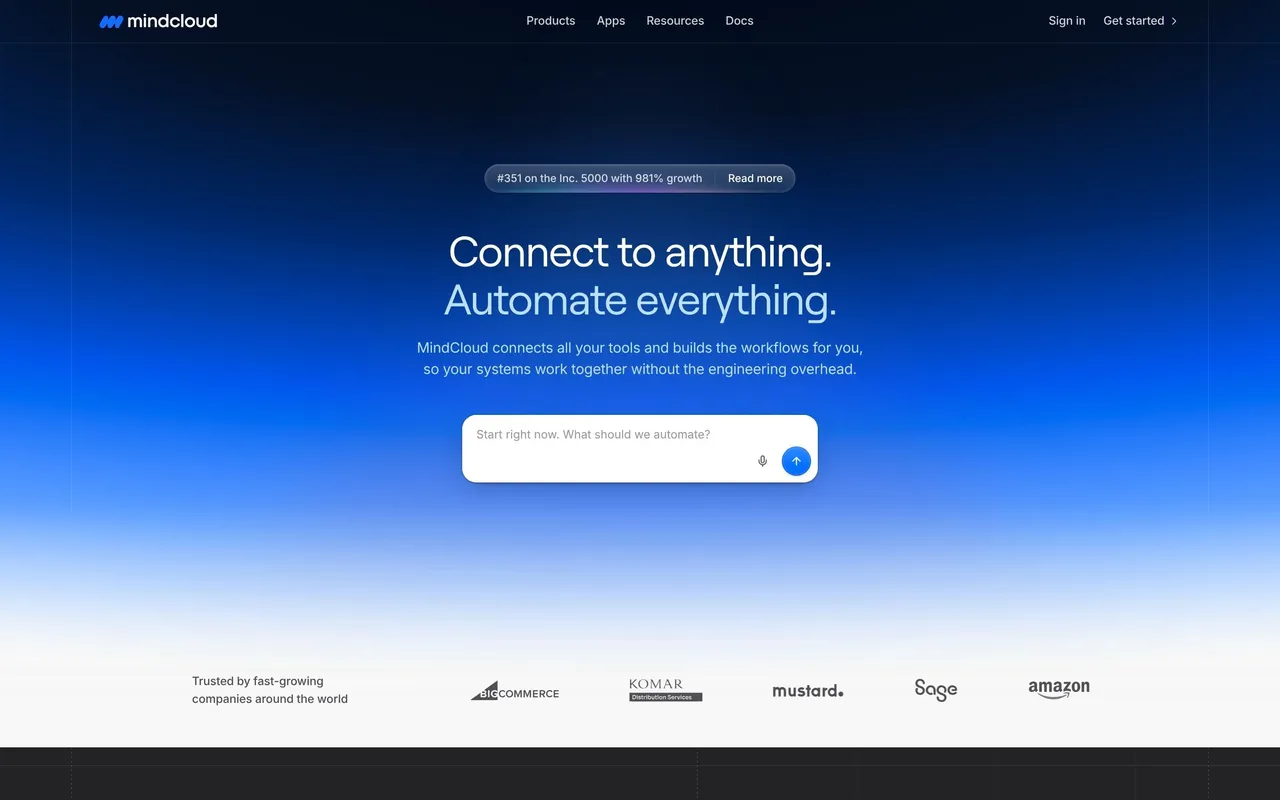
MindCloud Cirra Analytics Page
 MindCloudIntegrations and workflow automation
About this screen
Sales overview page
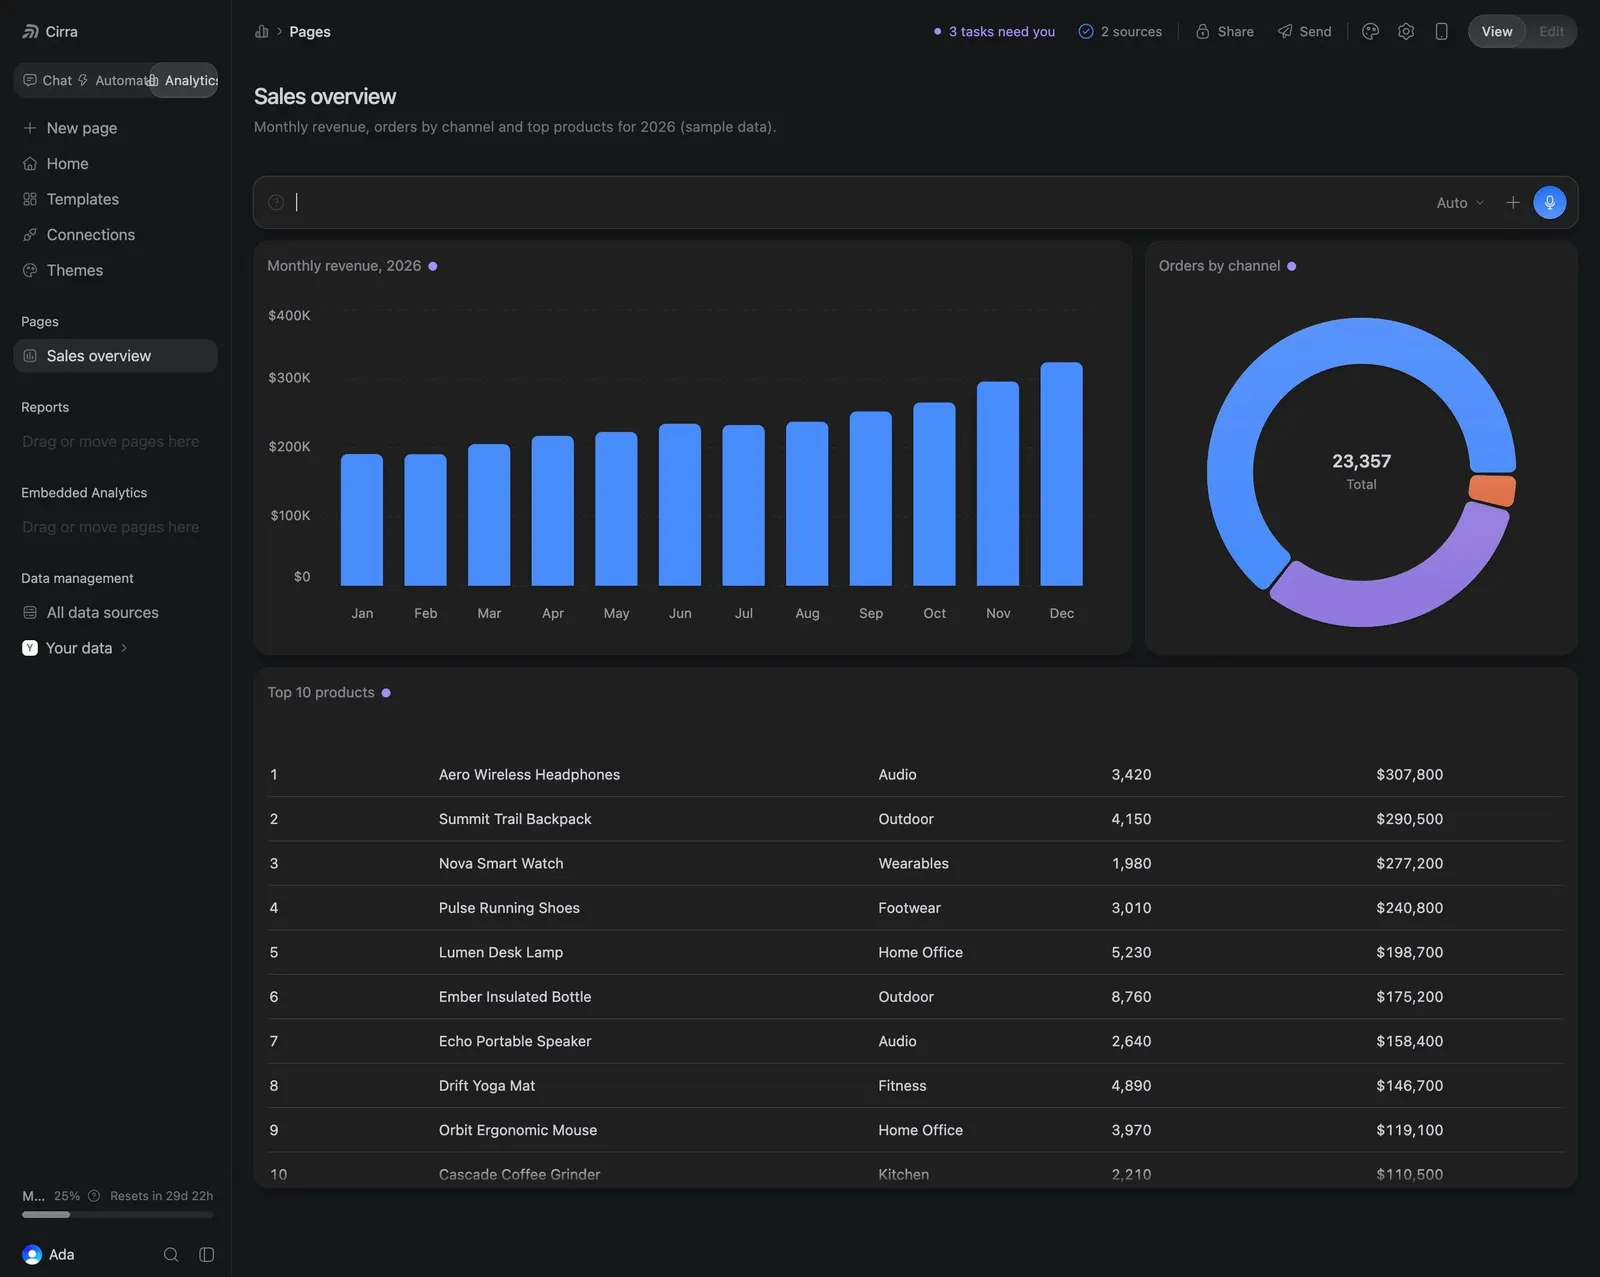
The analytics page "Sales overview" describes monthly revenue, orders by channel and top products for 2026 (sample data), with a prompt bar to edit it by chat.
Charts
A blue bar chart "Monthly revenue, 2026" runs Jan to Dec beside an "Orders by channel" donut showing 23,357 in total.
Top products table
"Top 10 products" ranks items such as "Aero Wireless Headphones" with category, units and revenue; the top bar holds "3 tasks need you", "2 sources", Share, Send and a View / Edit toggle.