Prompt 616 words Copy
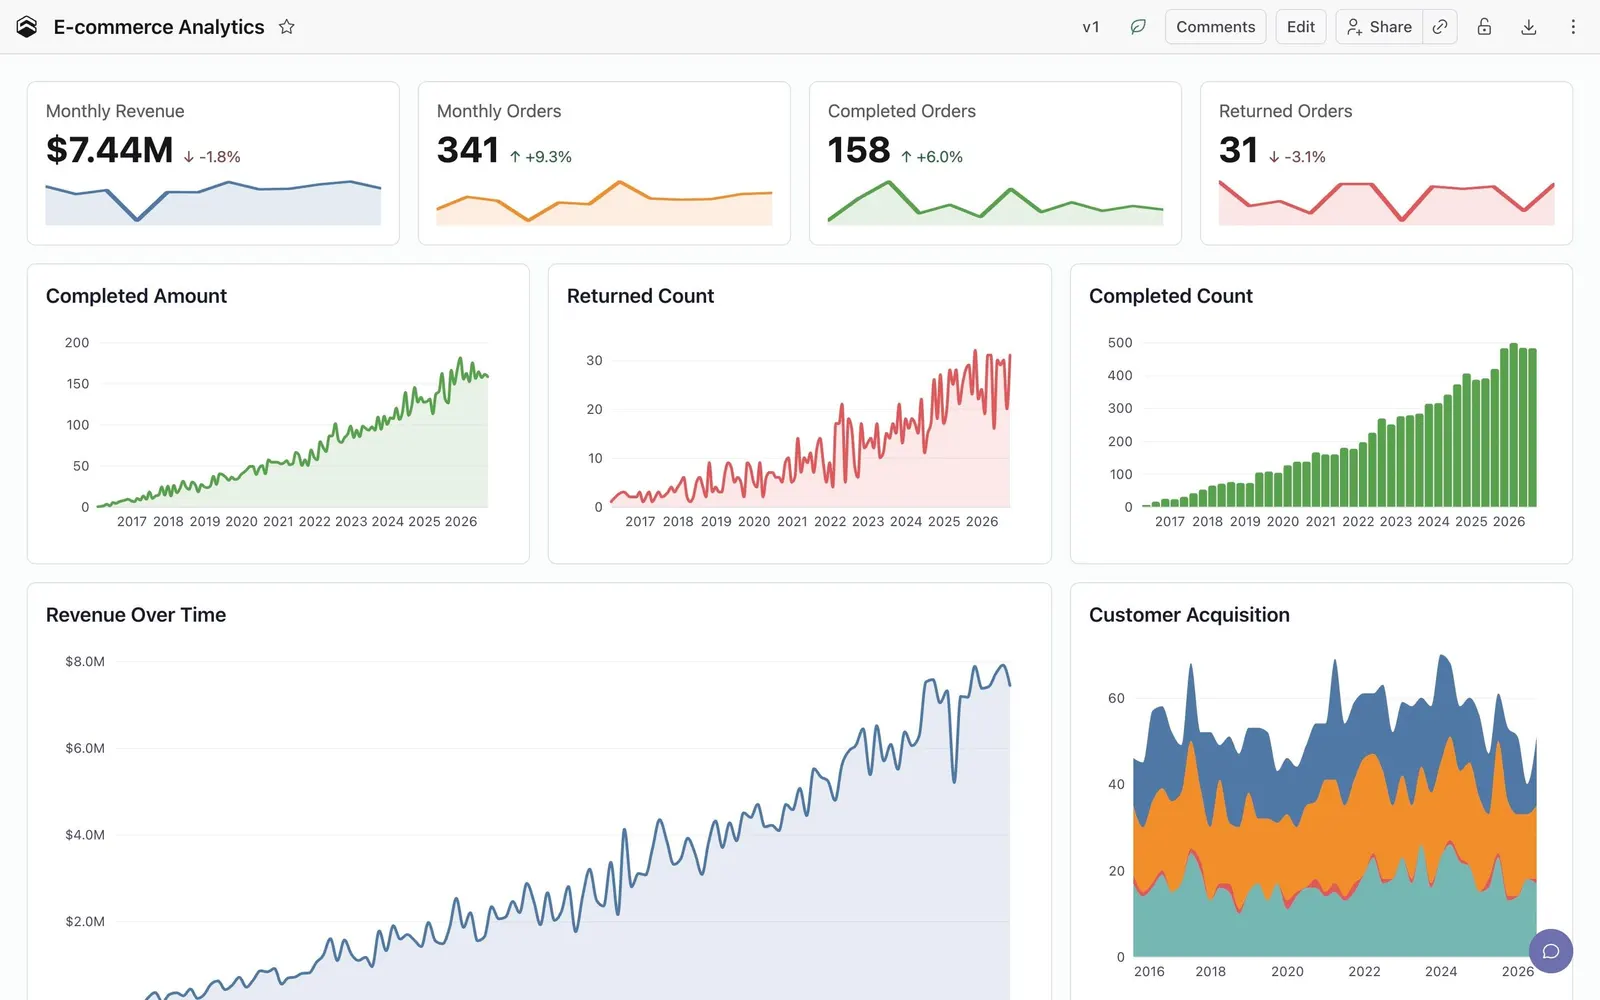
# Design from Reference: Cube E-commerce Analytics Dashboard

Create an original, high-fidelity visual design inspired by the reference. Prioritize composition, typography, colors, spacing, and component styling over technical implementation.

## Reference

- **Product:** Cube
- **Category:** Analytics
- **Screenshot:** attached to this message (also available at https://media.saasframe.io/v/7bd94be003c7bbd6890a-1600.webp)
- **Source:** https://saasframe.cubecloud.dev/d/1/dashboard/RRSfLofLiLXd

Analyze the attached screenshot first. If no image is attached, open the screenshot link; if neither is accessible, ask for it rather than guessing.

## Visual Design Context

### Brand
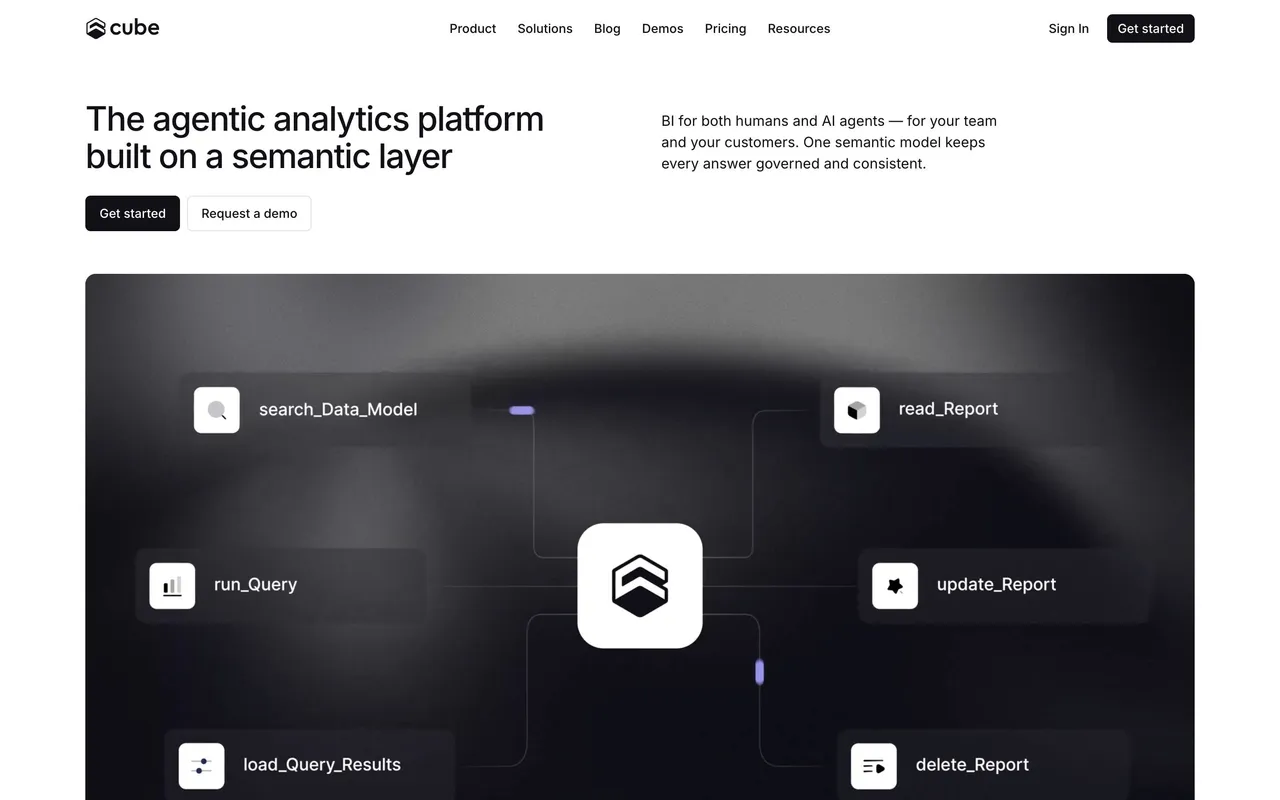
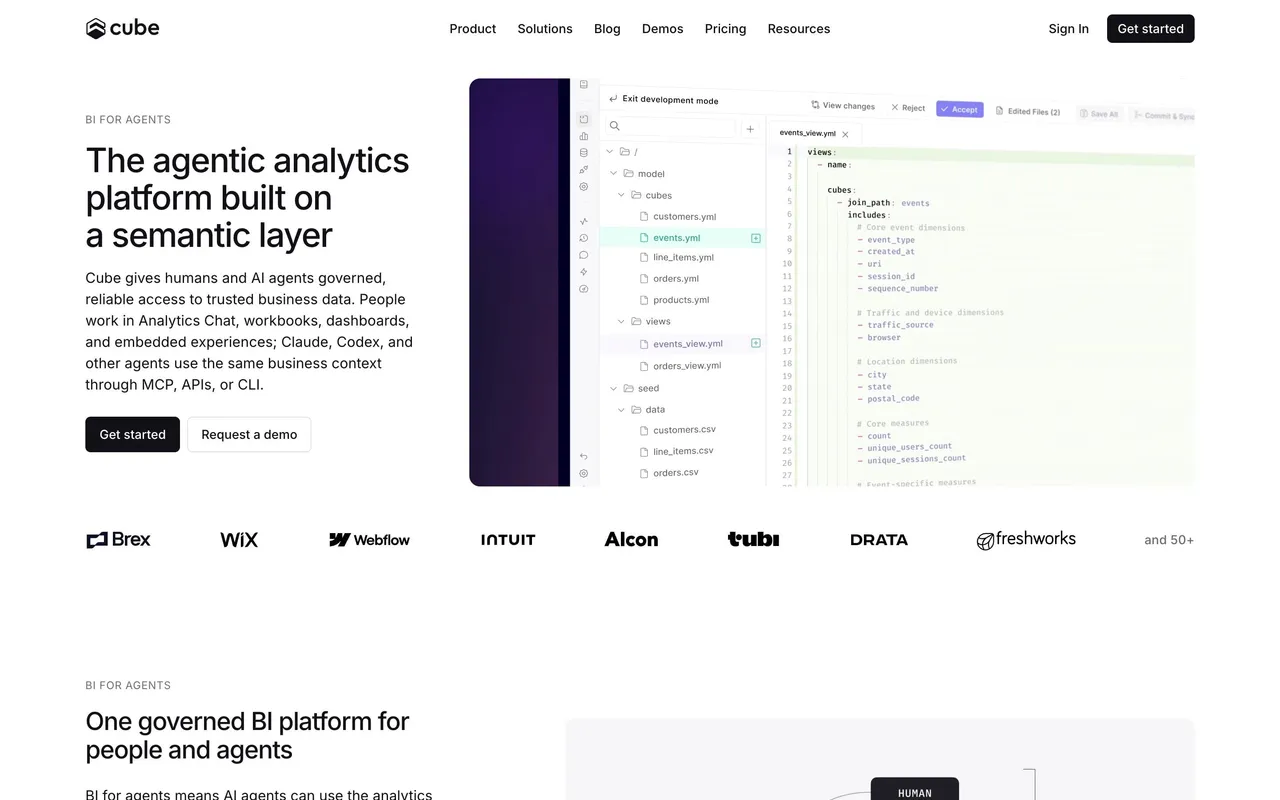
Cube is the agentic analytics platform built on a semantic layer: one governed model serves dashboards, embedded analytics and AI agents (MCP, APIs, CLI). Technical, calm, enterprise-ready.

### Website
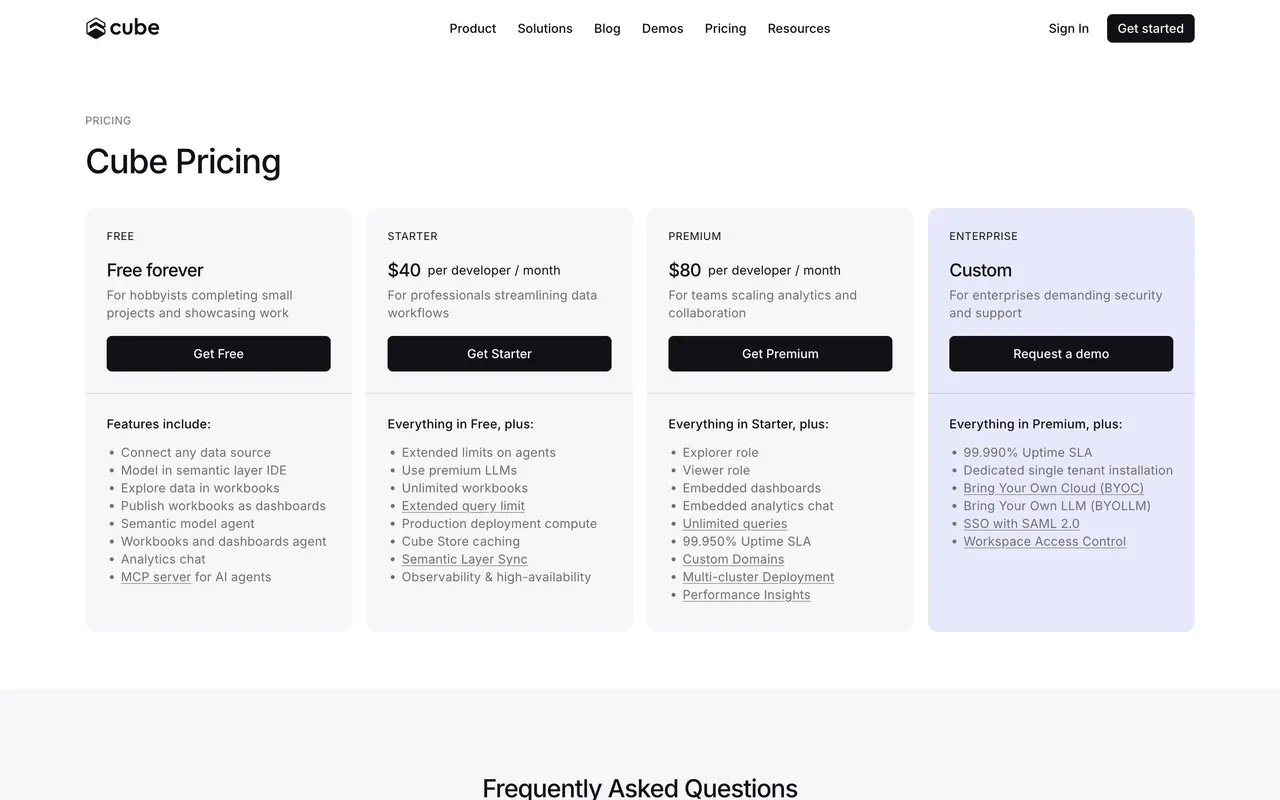
White pages with near-black panels and soft lavender (#E9E8FF) bands for testimonials and the mission. Semibold sans headlines around 32 to 40px, small uppercase eyebrows (PRICING, INDUSTRIES / FINANCIAL SERVICES), 14px grey body, monospace in code panels. Heroes pair a short headline with a large dark product panel (connector directory, code editor, charts); feature rows alternate screenshots, node diagrams and dark illustrations with purple and blue glows. Black primary and white outline buttons, thin borders, 8 to 12px radii, logo strips of data teams, dark logo cards for case studies, and a near-black "Get started with Cube" banner before every footer.

### Tone
Short, confident sentences about trust, governance and speed; "humans and AI agents" as a recurring pair.

### Overall aesthetic
Dense, colorful BI dashboard on white.

### Page composition
Header, row of 4 KPI cards, rows of chart cards in a grid.

### Typography
Large KPI numbers, small card titles, tiny axis labels.

### Colors & surfaces
White cards with thin borders; blue, green, orange and red series.

### Components
KPI card with sparkline and delta, line, bar and stacked area charts, share and comments buttons.

### Responsive
Grid reflows to fewer columns.

### Adaptation guidance
Give each measure its own color and keep a sparkline in every KPI card.

## Content

**Instructions:**

Generate realistic example content that fits the selected design reference.

Create appropriate headlines, descriptions, labels, buttons, and supporting copy based on the type of interface being designed.

If a product or business description is provided, use it to guide the content.

Otherwise, invent a plausible fictional SaaS product appropriate for the reference.

Keep the content concise, coherent, and visually balanced.

Do not present fictional statistics, customer names, or testimonials as verified facts.

## Design Direction

**Instructions:**

Use the reference screenshot as the main source of visual inspiration rather than a strict layout template.

Preserve its most distinctive design characteristics, such as typography, visual rhythm, color relationships, component treatments, and overall aesthetic.

Feel free to modify section arrangements, proportions, spacing, and individual components to better suit my content.

Introduce original design decisions where they improve usability, composition, or brand consistency.

The result should clearly reflect the reference's visual language without looking like a direct reproduction.

Follow the visual identity of the reference design.

Use its typography, color palette, component styling, and overall aesthetic as the primary design direction.

Do not introduce an unrelated visual identity.

## Output

**Instructions:**

Generate a high-fidelity visual mockup of the requested interface.

Present the design as a polished, realistic website or product UI screenshot.

Prioritize visual composition, typography, spacing, colors, alignment, and component details.

Use the available image-generation or visual-design capabilities.

Do not replace the mockup with source code, a written design specification, or a textual description.

If direct visual generation is unavailable, clearly explain the limitation.

## Constraints

- Use the actual screenshot as the primary visual reference.
- Preserve essential messaging and factual accuracy.
- Prioritize visual quality and consistency.
- Do not invent unsupported product claims.
- Adapt structure and copy length for visual balance.
Reference image Attach it to your message: assistants can’t open image links. Open in ChatGPT ↗ Open in Claude ↗
Build it in Lovable ↗ v0 ↗ Figma Make ↗
Opening a tool copies the screenshot so you can paste it with your prompt.
 SaaSFrame