 SaaSFrame
Narrative BI Analytics
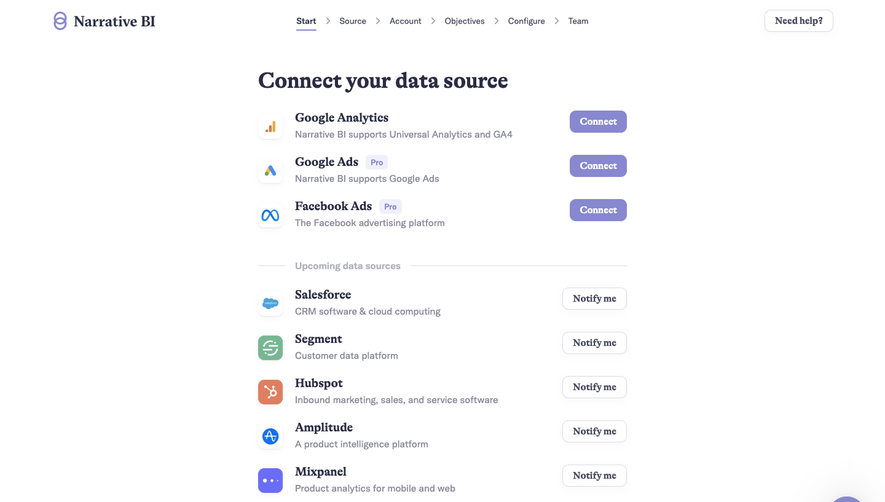
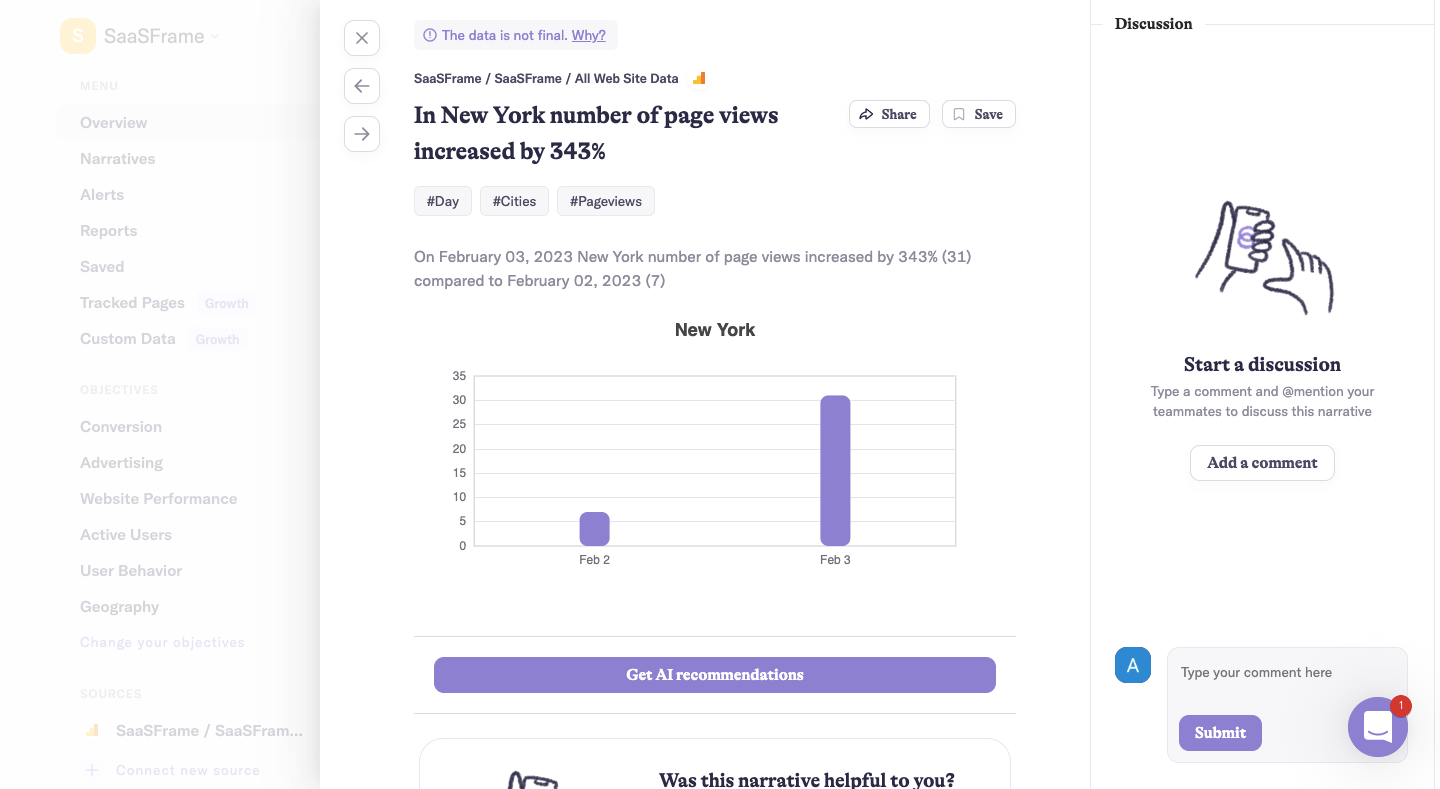
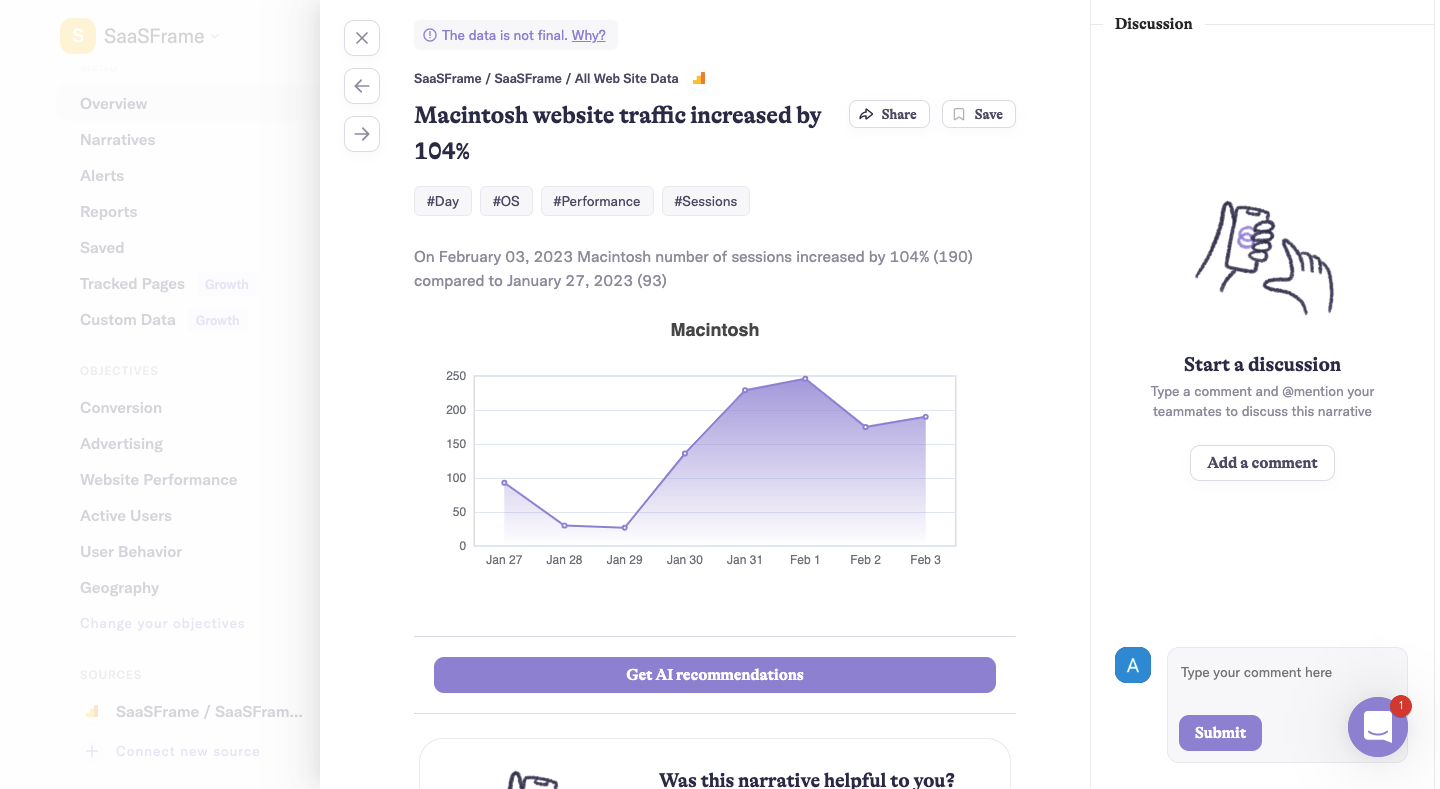
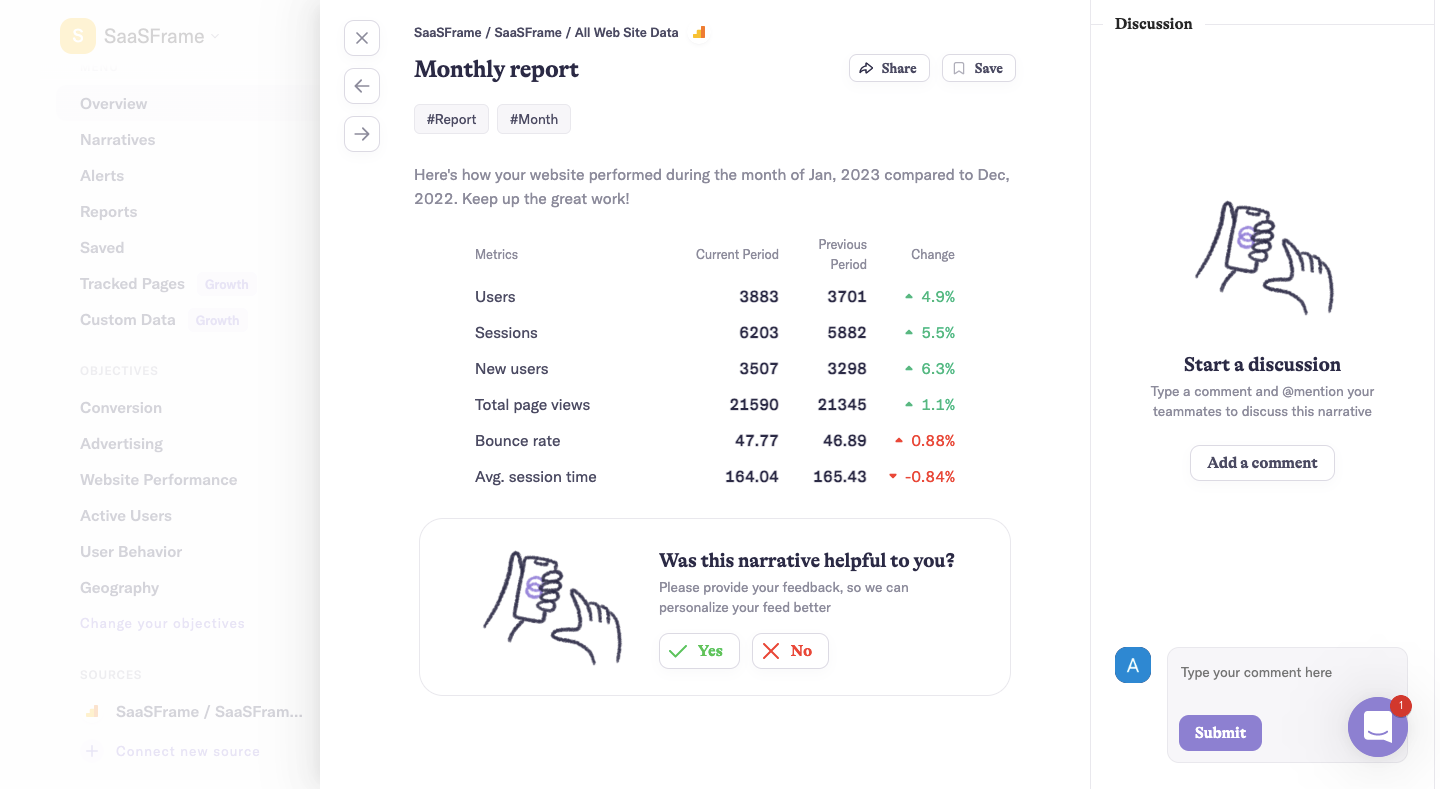
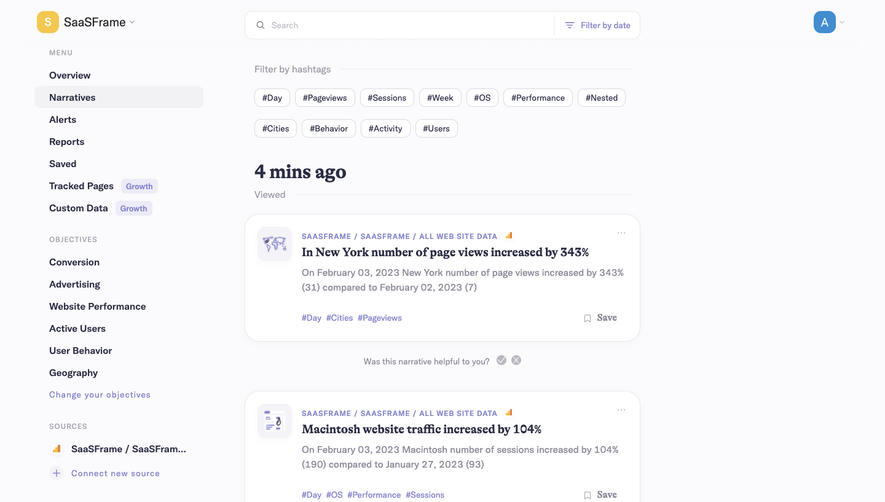
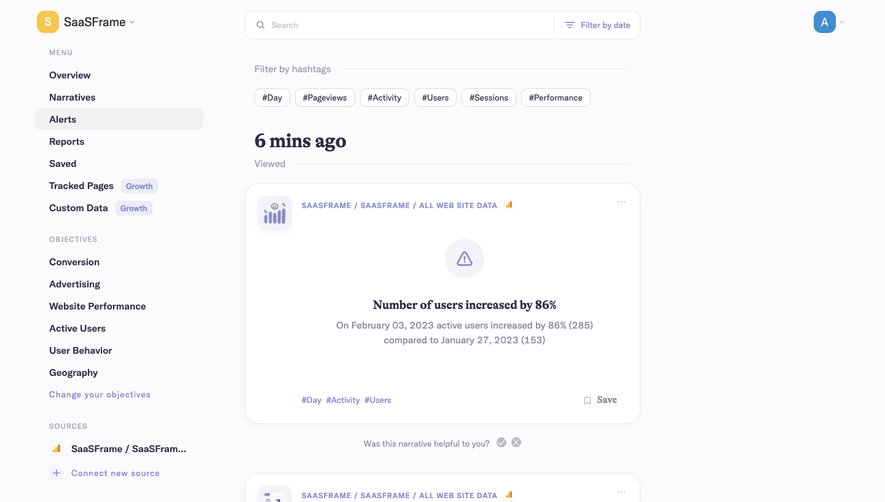
Narrative BI's analytics flow opens individual narratives and a monthly report in three screens with a discussion panel on the right. Each narrative pairs a serif headline with a single lavender bar or area chart and tags, while the monthly report uses a compact table with green and red change values. A hand-drawn illustration invites comments, and a yes/no card asks if the narrative helped.
Follow Narrative BI’s analytics flow step by step: 3 real screens captured from the live product, from analytics: page views narrative to analytics: monthly report. Use ← → to move between steps, and open any screen to see it in full.
Steps in this flow
More flows from Narrative BI
All Narrative BI Narrative BI Settings
3 screens
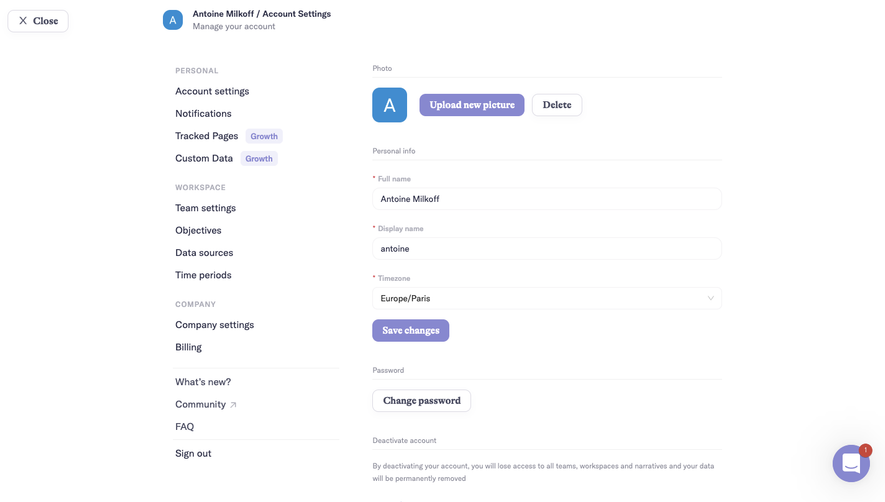
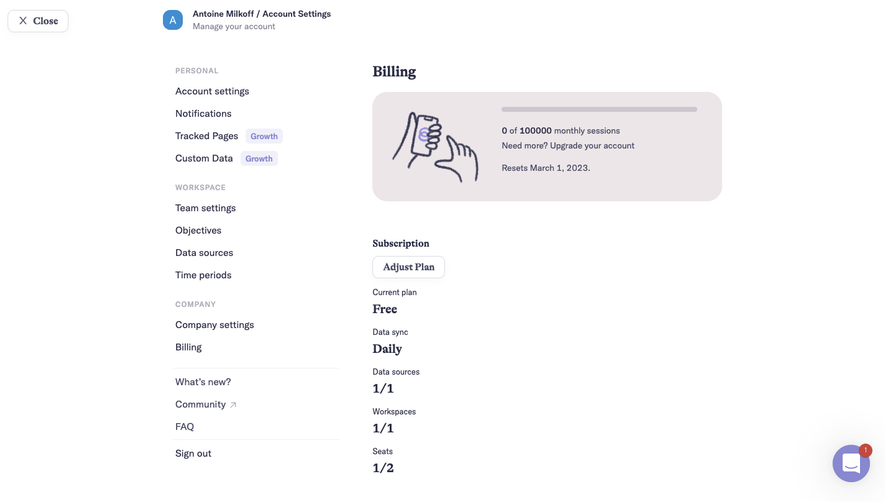
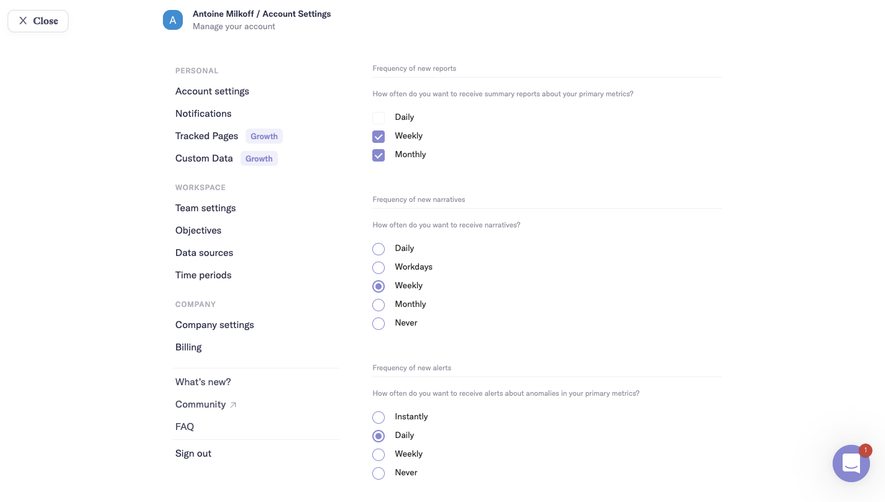
Narrative BI Dashboard
6 screens
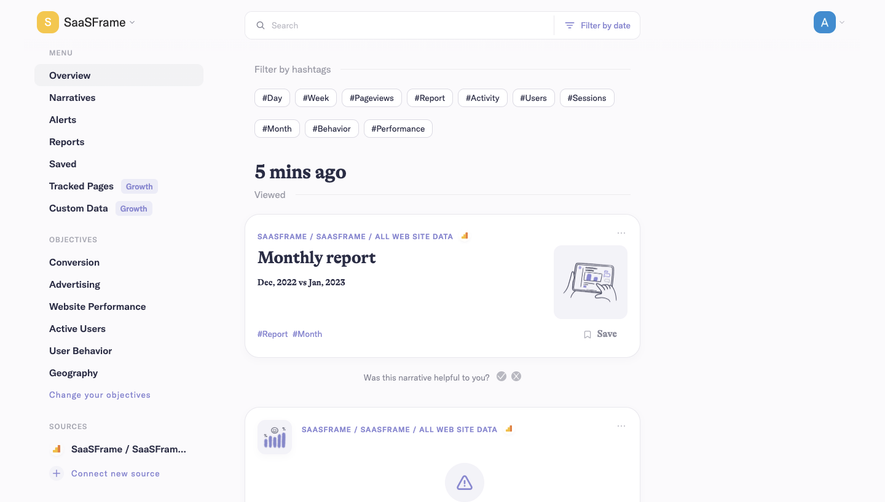
Narrative BI Onboarding
9 screens