Prompt 848 words Copy
# Design from Reference: Respan LLM Leaderboard

Create an original, high-fidelity visual design inspired by the reference. Prioritize composition, typography, colors, spacing, and component styling over technical implementation.

## Reference

- **Product:** Respan
- **Category:** Free Side Product
- **Screenshot:** attached to this message (also available at https://media.saasframe.io/v/adc11c3bcba2408cdd9e-1600.webp)
- **Source:** https://www.respan.ai/ai-gateway/leaderboard

Analyze the attached screenshot first. If no image is attached, open the screenshot link; if neither is accessible, ask for it rather than guessing.

## Visual Design Context

## Respan — shared visual language

- **Theme**: dark, developer-first marketing site. Near-black page (#000000 / #1E1E23 surfaces, #2E2E33 hairline borders) with a thin announcement bar ("Launching the open-source gateway") in letter-spaced type above a slim top nav (logo "[ . ] Respan", Product, Models, Docs, Pricing, Resources; GitHub stars, "Book a demo", white "Dashboard").
- **Typography**: Inter everywhere. Hero H1 72px/600 with very tight tracking (-3.24px); page H1 64px/600 (-1.6px); content-page H1 40px/500 (-1px). Body 14–16px in light greys (#F9FAFC, #B1B3BC). Roboto Mono for code samples, numbers and small labels.
- **Colors**: monochrome greys with saturated accents used inside product mocks and customer cards: blue #2679F3 / #1B3FE0, green #0D7C5C, purple #8F74E0, pink and red for charts; periwinkle #6483F0 for highlighted plans.
- **Components**: 36px buttons with 6px radius (white primary, #1E1E23 secondary); 12px-radius cards on #1E1E23; live code blocks with a "Copy" button and syntax colors; logo strips; testimonial cards with photos on bright color fills; a giant pixelated "[ . ] Respan" wordmark above a dense multi-column footer.
- **Layout**: centered ~1200px content, left-aligned heroes on product pages, long scrolling pages alternating code, product mocks and metric callouts ("Up to 70% off tokens", "1,000+ models").
- **Tone**: technical and blunt, numbers first ("The fastest OSS AI gateway", "Built for AI agents. Break less. Ship more.").

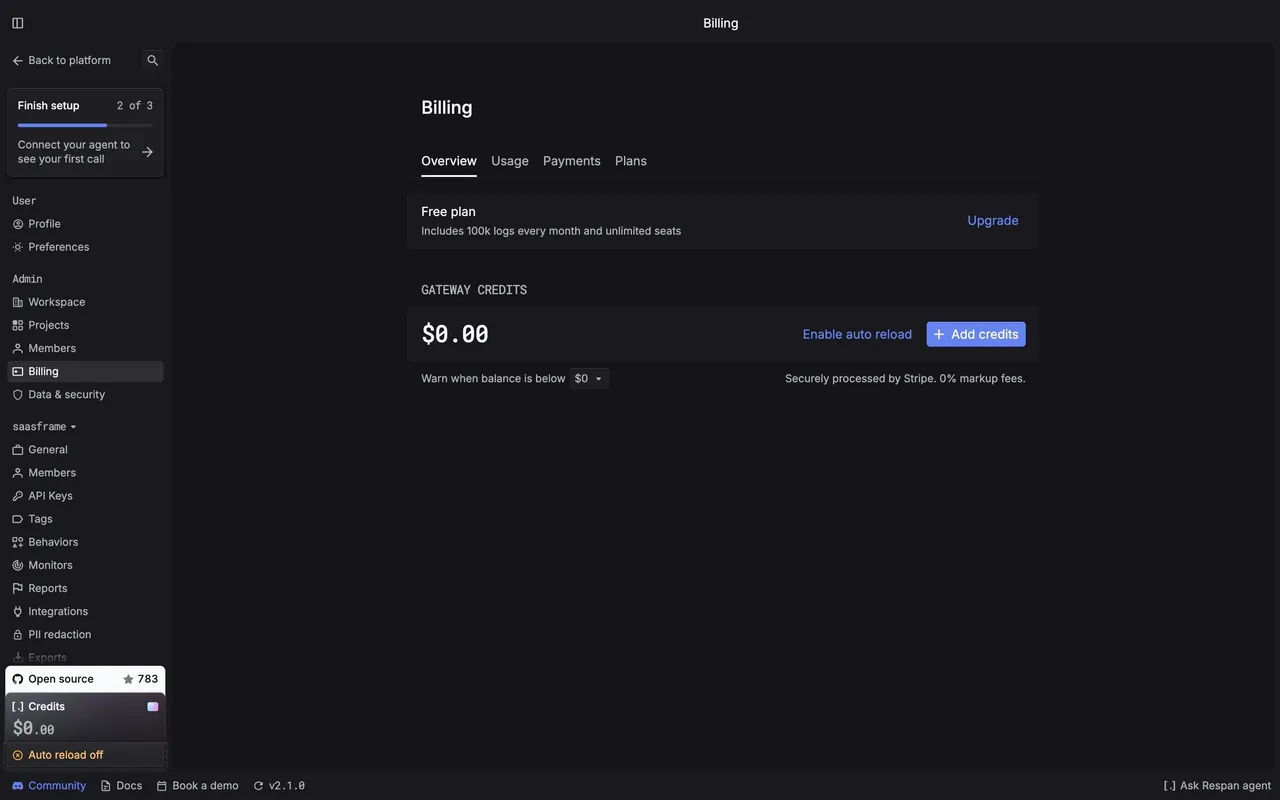
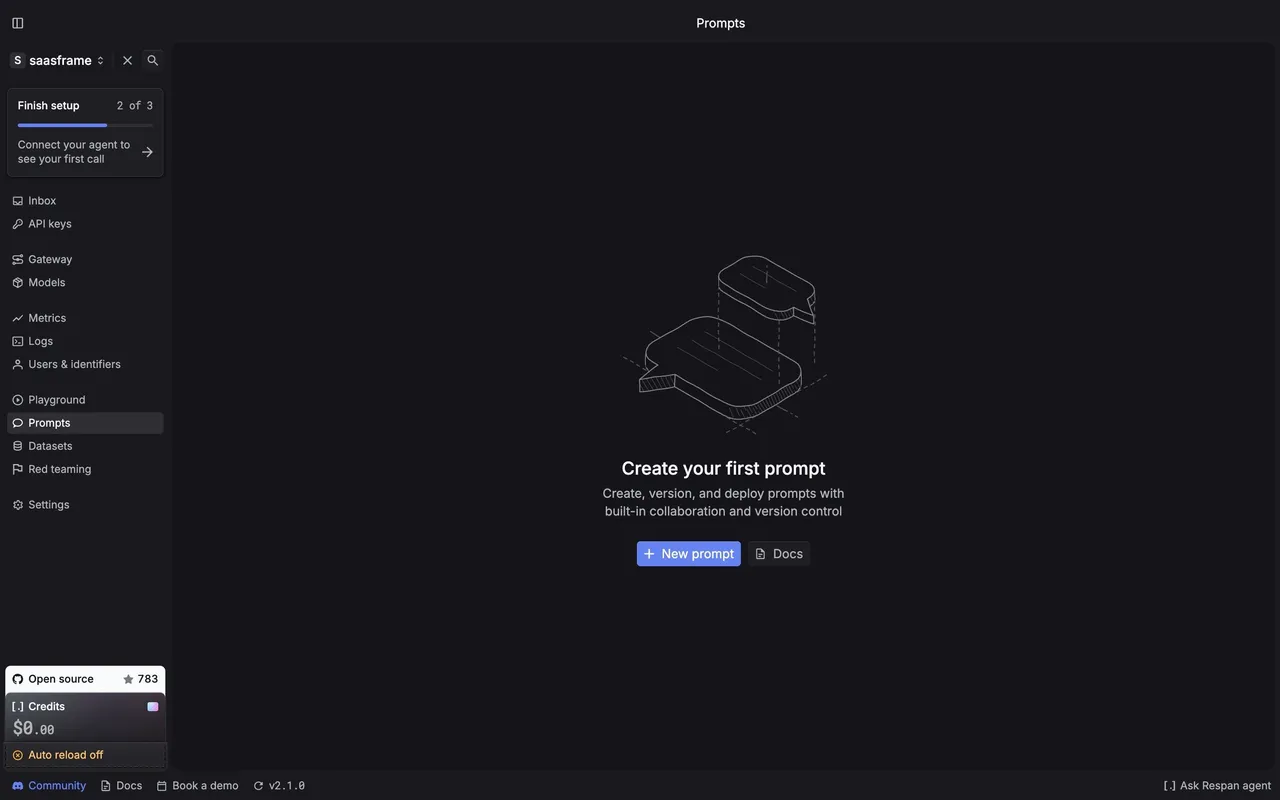
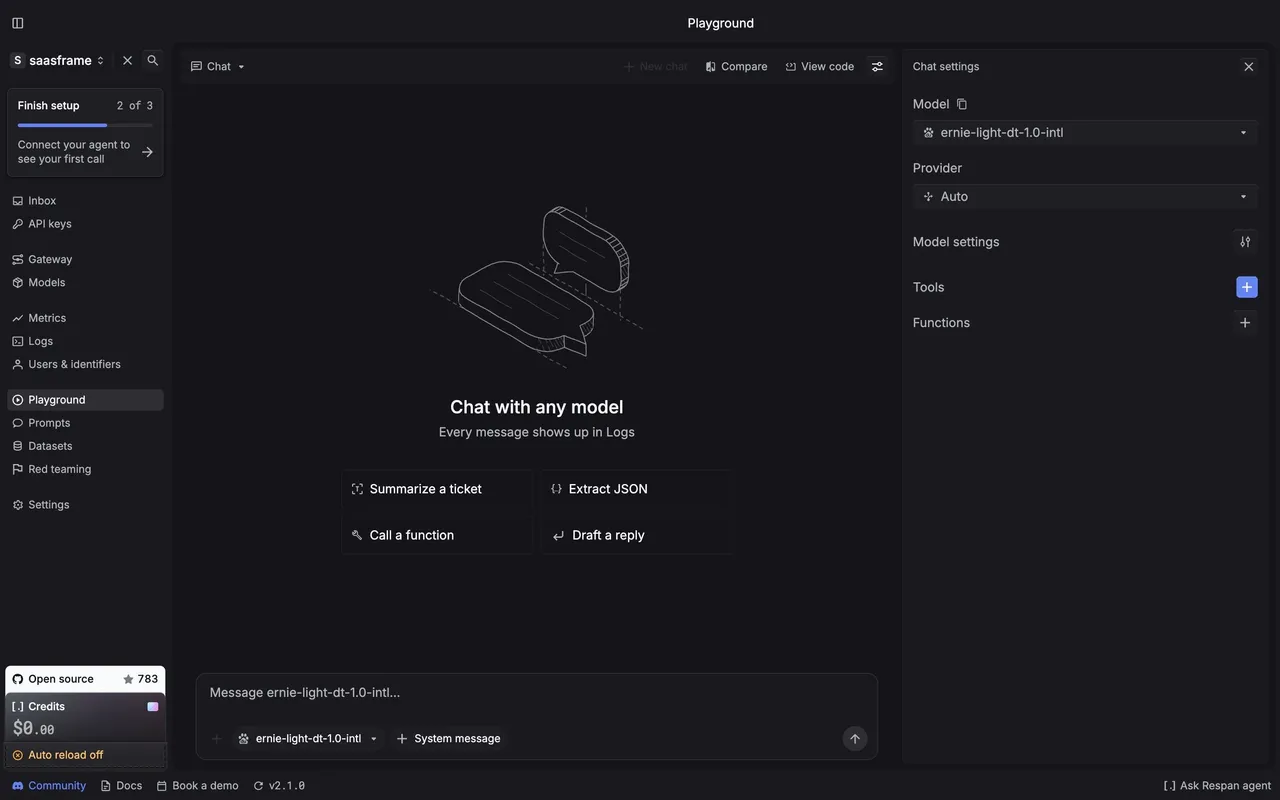
## Respan app (platform.respan.ai) — product UI

- **Theme**: dark app, page #151519, panels #1E1E23, raised #26262B, borders #2E2E33; text #F9FAFC and #B1B3BC; accent periwinkle #6483F0.
- **Typography**: Inter for UI (13–14px), "Respan Mono" for numbers, model ids and code.
- **Sidebar**: project switcher ("saasframe"), a "Finish setup 2 of 3" checklist card, then Inbox, API keys, Gateway, Models, Metrics, Logs, Users & identifiers, Playground, Prompts, Datasets, Red teaming, Settings; an "Open source" GitHub card and a "Credits" card ($0.00, "Auto reload off") at the bottom; a status bar with Community, Docs, Book a demo, version and "Ask Respan agent".
- **Components**: 28px compact buttons with 4px radius, filter chips, isometric line illustrations for empty states, data tables with tiny mono numbers.

### Overall aesthetic
- **Style:** data-heavy dark page; saturated colors limited to chart series.

### Page composition
- **Header:** H1 56px, lead, CTA, sticky tab bar.
- **Body:** chart sections each with title, caption, range toggle; tables for providers and scores; scatter for quality vs cost; footer.

### Typography
- **H1:** Inter 56px/58.8px w500. **H2:** 40px/44px w500, -1px. **H3:** 18px w600.
- **Data:** Fira Code for numbers.

### Colors & surfaces
- **Series:** #F55656, #FF6482, #FFB340, #31DE4B, #66D4CF on #1E1E23 panels.

### Components
- **Range toggle:** segmented 3M/6M/1Y pills (20–24px radius).
- **Table:** provider, tokens, change with arrow.

### Responsive
- **Mobile:** charts full width, tabs scroll, legends wrap under charts.

### Adaptation guidance
- **Lesson:** a product that sees aggregate traffic can publish it as a free tool that ranks for model queries.

## Content

**Instructions:**

Generate realistic example content that fits the selected design reference.

Create appropriate headlines, descriptions, labels, buttons, and supporting copy based on the type of interface being designed.

If a product or business description is provided, use it to guide the content.

Otherwise, invent a plausible fictional SaaS product appropriate for the reference.

Keep the content concise, coherent, and visually balanced.

Do not present fictional statistics, customer names, or testimonials as verified facts.

## Design Direction

**Instructions:**

Use the reference screenshot as the main source of visual inspiration rather than a strict layout template.

Preserve its most distinctive design characteristics, such as typography, visual rhythm, color relationships, component treatments, and overall aesthetic.

Feel free to modify section arrangements, proportions, spacing, and individual components to better suit my content.

Introduce original design decisions where they improve usability, composition, or brand consistency.

The result should clearly reflect the reference's visual language without looking like a direct reproduction.

Follow the visual identity of the reference design.

Use its typography, color palette, component styling, and overall aesthetic as the primary design direction.

Do not introduce an unrelated visual identity.

## Output

**Instructions:**

Generate a high-fidelity visual mockup of the requested interface.

Present the design as a polished, realistic website or product UI screenshot.

Prioritize visual composition, typography, spacing, colors, alignment, and component details.

Use the available image-generation or visual-design capabilities.

Do not replace the mockup with source code, a written design specification, or a textual description.

If direct visual generation is unavailable, clearly explain the limitation.

## Constraints

- Use the actual screenshot as the primary visual reference.
- Preserve essential messaging and factual accuracy.
- Prioritize visual quality and consistency.
- Do not invent unsupported product claims.
- Adapt structure and copy length for visual balance.
Reference image Attach it to your message: assistants can’t open image links. Open in ChatGPT ↗ Open in Claude ↗
Build it in Lovable ↗ v0 ↗ Figma Make ↗
Opening a tool copies the screenshot so you can paste it with your prompt.
 SaaSFrame