Prompt 751 words Copy
# Design from Reference: Rox Usage

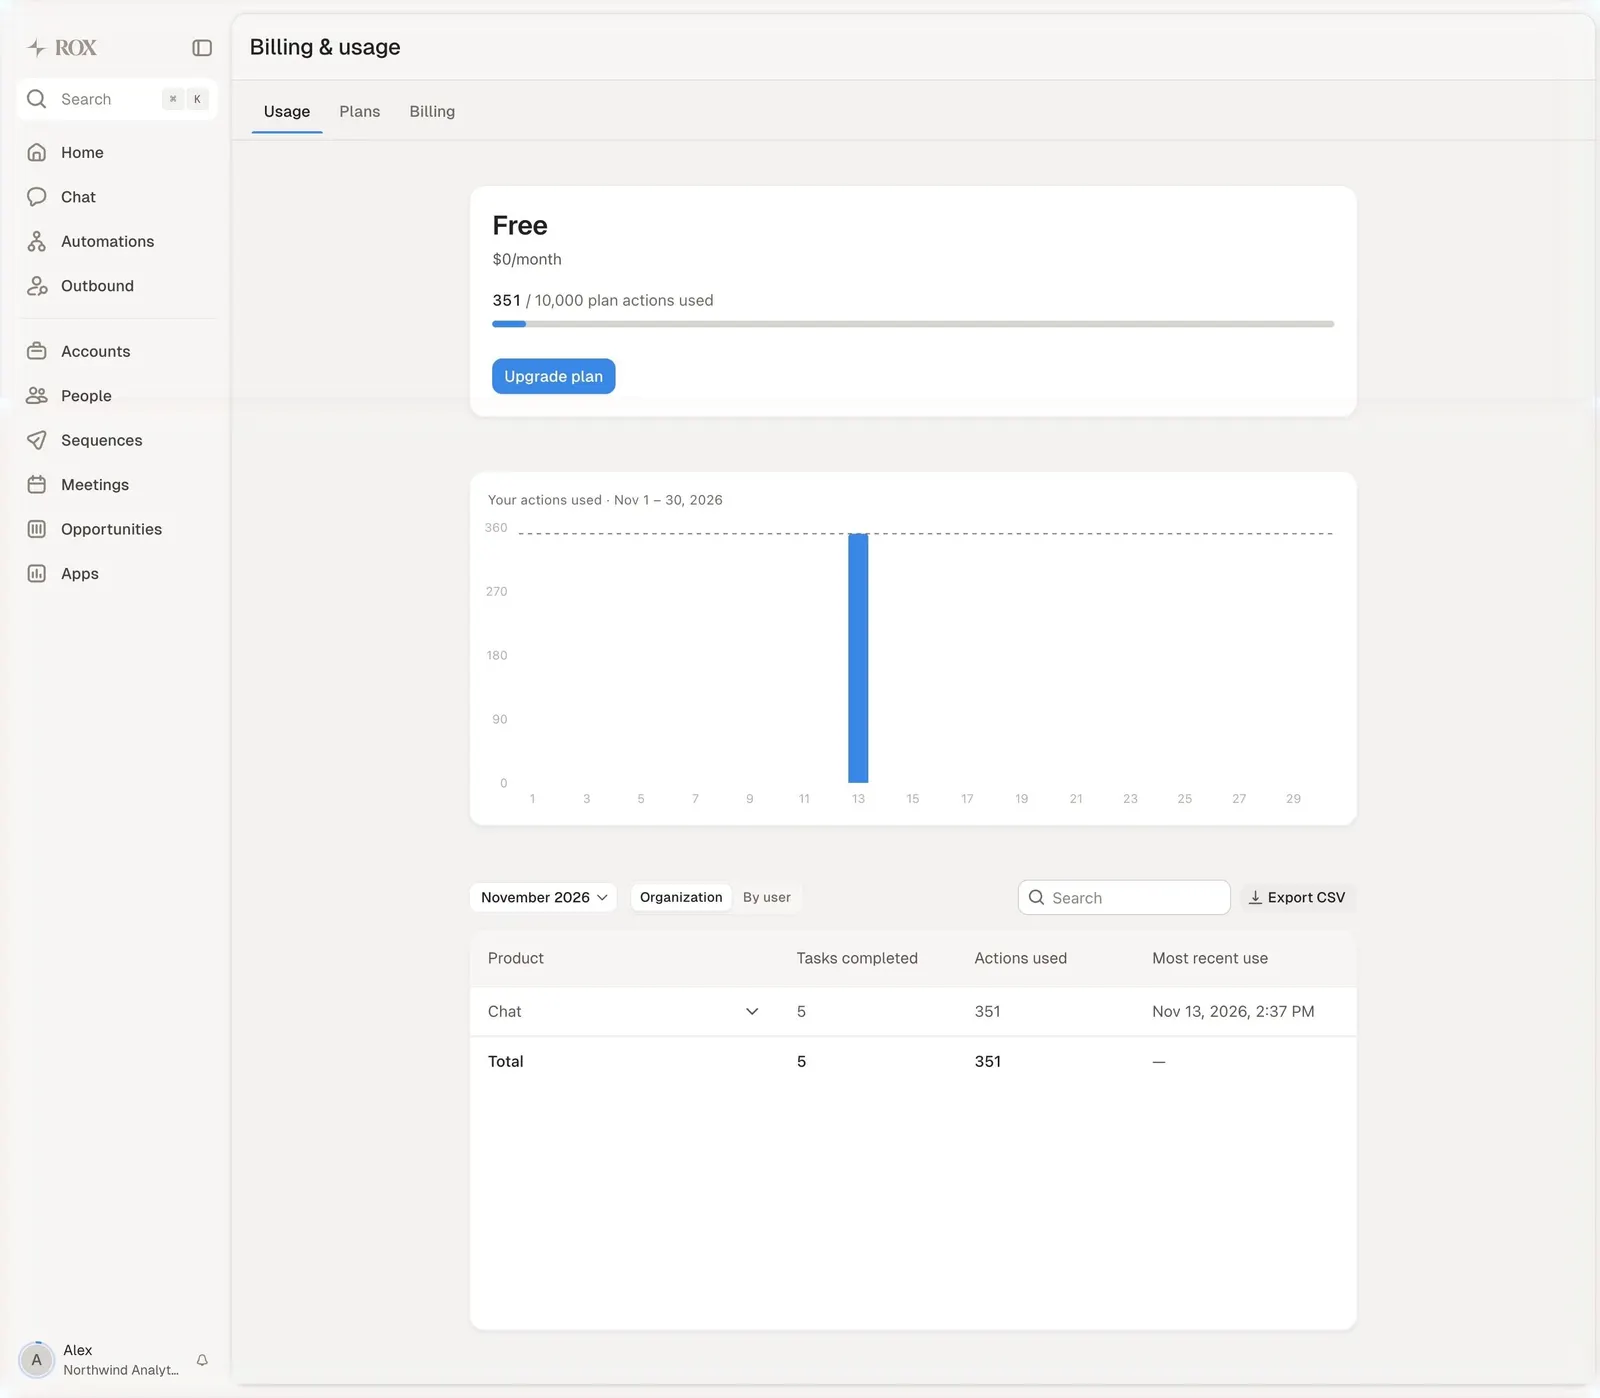
Create an original, high-fidelity visual design inspired by the reference. Prioritize composition, typography, colors, spacing, and component styling over technical implementation.

## Reference

- **Product:** Rox
- **Category:** Billing
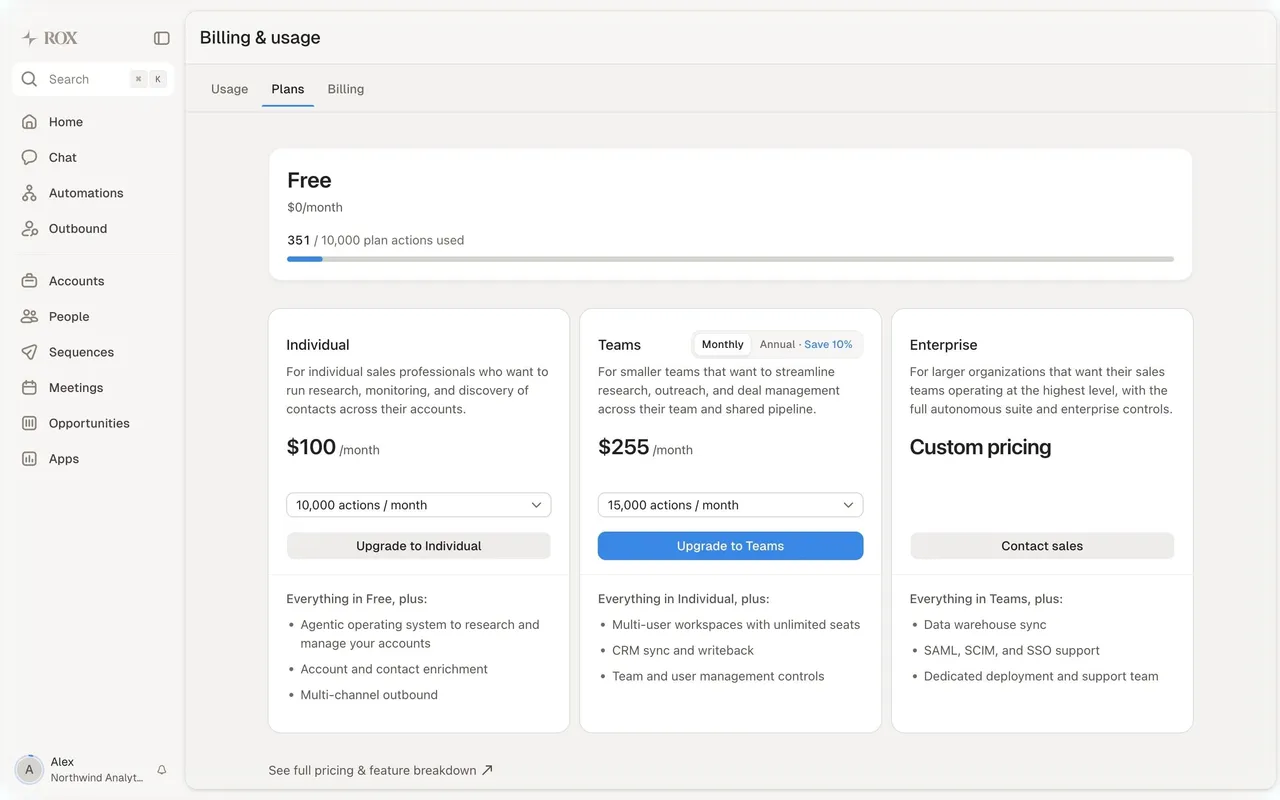
- **Screenshot:** attached to this message (also available at https://media.saasframe.io/v/d8ee5b26e092798daba9-1600.webp)
- **Source:** https://run.rox.com/billing

Analyze the attached screenshot first. If no image is attached, open the screenshot link; if neither is accessible, ask for it rather than guessing.

## Visual Design Context

## Rox — shared visual language
- **Theme:** Warm, editorial and quiet. The website sits on a stone off-white (#F7F6F4, #F0EEEA) with full-bleed dark bands (#000000, #292524) for video testimonials; the app uses the same warm greys (#F7F6F5 canvas, #FFFFFF panels, #EDECEA and #D6D3D0 borders) with almost no color.
- **Typography:** Website headlines in a light serif display face (Season Mix, about 30–48px, weight ~420, tight tracking -0.6px), often in two tones with the second line in warm grey (#87827D / #A6A09B); body and UI text in Geist / system sans at 12–16px. In the app, GeistSans 20px w500 for page titles, 14px for UI text, GeistMono for numbers.
- **Colors:** Ink #0C0A09 on the site and #23211F in the app; secondary warm greys #57534D, #5C5651, #716A63. The only accent in the app is a mid blue #3787E8 for primary buttons, toggles and selected states; small colored category labels (teal #069488, pink #D33A78, blue #2A6DCF) tag automation templates.
- **Components:** Site: black pill-free buttons (small, square-ish) paired with a light "Start now" button, analyst badges and logo walls, a dark video carousel "Rox increases pipeline and grows revenue", a "Get started today" CTA panel and a large footer with a faded ROX wordmark. App: a 200px left sidebar (Home, Chat, Automations, Outbound, Accounts, People, Sequences, Meetings, Opportunities, Apps), a central work panel with 14px radius floating on the grey canvas, and a persistent chat panel on the right with saved prompts; buttons 38px tall with 10px radius; tables with light row dividers; modals with blurred backdrops.
- **Layout:** Site content up to 1050–1200px, generous whitespace, text left and product visuals right; app panels split 2:1 between work area and chat.
- **Tone:** Short, confident enterprise copy ("The Revenue Agent for the Global 2000"); in the app, conversational assistant prompts and plain labels.

### Overall aesthetic
- **Mood:** Clean usage report.
### Page composition
- **Layout:** Tabs; plan card; chart card; table card; centered ~840px column.
### Typography
- **Axis:** GeistMono 11px; table 13px.
### Colors & surfaces
- **Base:** White cards; blue #3787E8 bars.
### Components
- **Chart:** Daily bars with a dashed threshold.
### Responsive
- **Mobile:** Not captured.
### Adaptation guidance
- **Lesson:** Pair a usage chart with a per-feature table so users know what consumed their quota.

## Content

**Instructions:**

Generate realistic example content that fits the selected design reference.

Create appropriate headlines, descriptions, labels, buttons, and supporting copy based on the type of interface being designed.

If a product or business description is provided, use it to guide the content.

Otherwise, invent a plausible fictional SaaS product appropriate for the reference.

Keep the content concise, coherent, and visually balanced.

Do not present fictional statistics, customer names, or testimonials as verified facts.

## Design Direction

**Instructions:**

Use the reference screenshot as the main source of visual inspiration rather than a strict layout template.

Preserve its most distinctive design characteristics, such as typography, visual rhythm, color relationships, component treatments, and overall aesthetic.

Feel free to modify section arrangements, proportions, spacing, and individual components to better suit my content.

Introduce original design decisions where they improve usability, composition, or brand consistency.

The result should clearly reflect the reference's visual language without looking like a direct reproduction.

Follow the visual identity of the reference design.

Use its typography, color palette, component styling, and overall aesthetic as the primary design direction.

Do not introduce an unrelated visual identity.

## Output

**Instructions:**

Generate a high-fidelity visual mockup of the requested interface.

Present the design as a polished, realistic website or product UI screenshot.

Prioritize visual composition, typography, spacing, colors, alignment, and component details.

Use the available image-generation or visual-design capabilities.

Do not replace the mockup with source code, a written design specification, or a textual description.

If direct visual generation is unavailable, clearly explain the limitation.

## Constraints

- Use the actual screenshot as the primary visual reference.
- Preserve essential messaging and factual accuracy.
- Prioritize visual quality and consistency.
- Do not invent unsupported product claims.
- Adapt structure and copy length for visual balance.
Reference image Attach it to your message: assistants can’t open image links. Open in ChatGPT ↗ Open in Claude ↗
Build it in Lovable ↗ v0 ↗ Figma Make ↗
Opening a tool copies the screenshot so you can paste it with your prompt.
 SaaSFrame