Prompt 828 words Copy
# Design from Reference: Privy Users Analytics

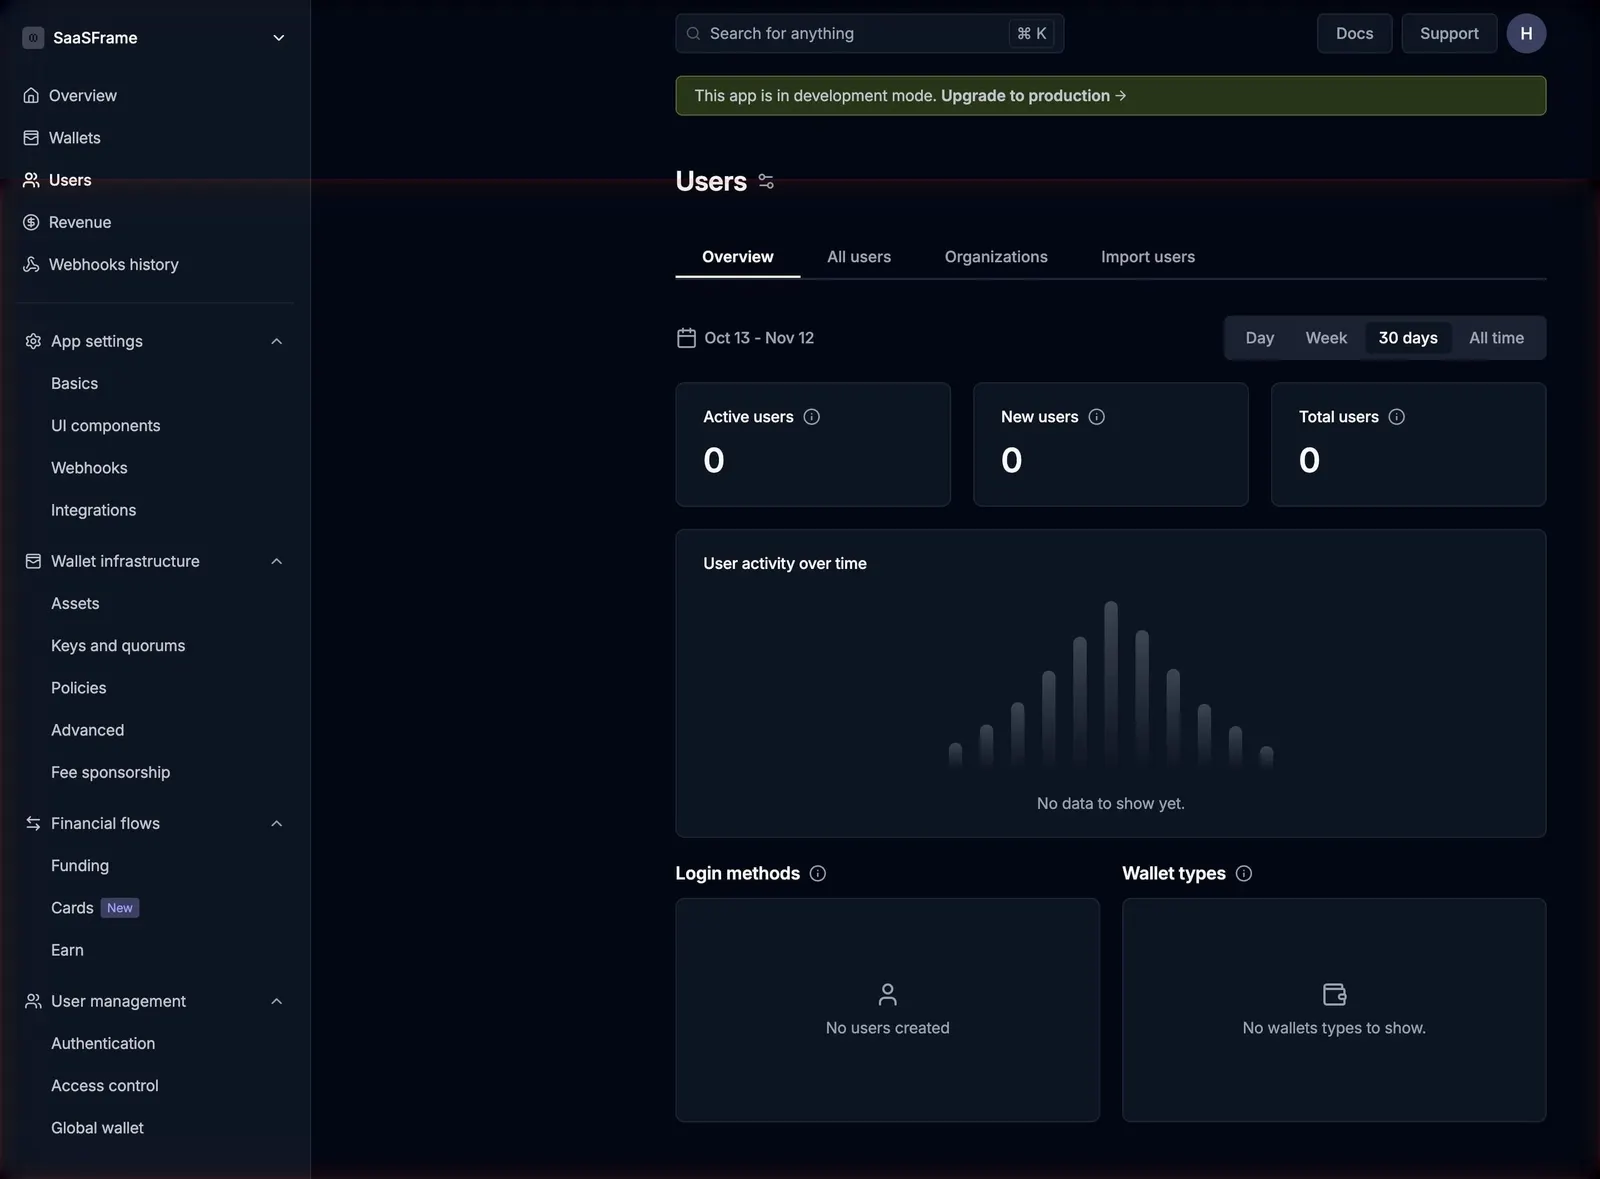
Create an original, high-fidelity visual design inspired by the reference. Prioritize composition, typography, colors, spacing, and component styling over technical implementation.

## Reference

- **Product:** Privy
- **Category:** Analytics
- **Screenshot:** attached to this message (also available at https://media.saasframe.io/v/fbe01bdf16b9d3bbb2c9-1600.webp)
- **Source:** https://dashboard.privy.io/apps/users

Analyze the attached screenshot first. If no image is attached, open the screenshot link; if neither is accessible, ask for it rather than guessing.

## Visual Design Context

## Privy — shared visual language

- **Theme**: crisp light fintech site with soft lilac-to-violet gradient imagery, alternating with near-black (#010110 / #111117) sections for performance and security. A small "privy | a stripe company" lockup in the top bar.
- **Typography**: geometric grotesk display faces at weight 400: FFF Acid Grotesk for product pages (H1 58px/64px, -1.74px; H2 42px/48px, -1.26px) and ABC Favorit for campaign pages (H1 78px/78px, -4.68px; H2 56px/58px). Inter for UI and body (14–20px), small uppercase eyebrows in Inter 12px w600 with 1.2px tracking, #70707D.
- **Colors**: near-black #010110 text and primary buttons, white and #F8F9FC surfaces, grey #70707D secondary text; lilac/periwinkle gradients (#C4D4F6, violet, pink) inside product shots; coral as the brand accent in logo usage; customer cards in each customer's colour.
- **Components**: pill buttons 36px with 100px radius (black "Get started", outlined "Talk to sales"); product mockups (wallet balances, treasury dashboards, approvals) floating on gradient panels; metric rows ("200M+", "$25B+", "99.99%"); case-study cards with "Challenge / Solution"; FAQ lists; a five-column footer signed "Technical decisions are moral decisions."
- **Layout**: centred 1200px content; heroes either split (copy left, gradient visual right) or centred over a gradient product shot; feature rows alternate image and copy.
- **Tone**: calm and confident, infrastructure language ("Build products that hold, move, and grow digital assets").

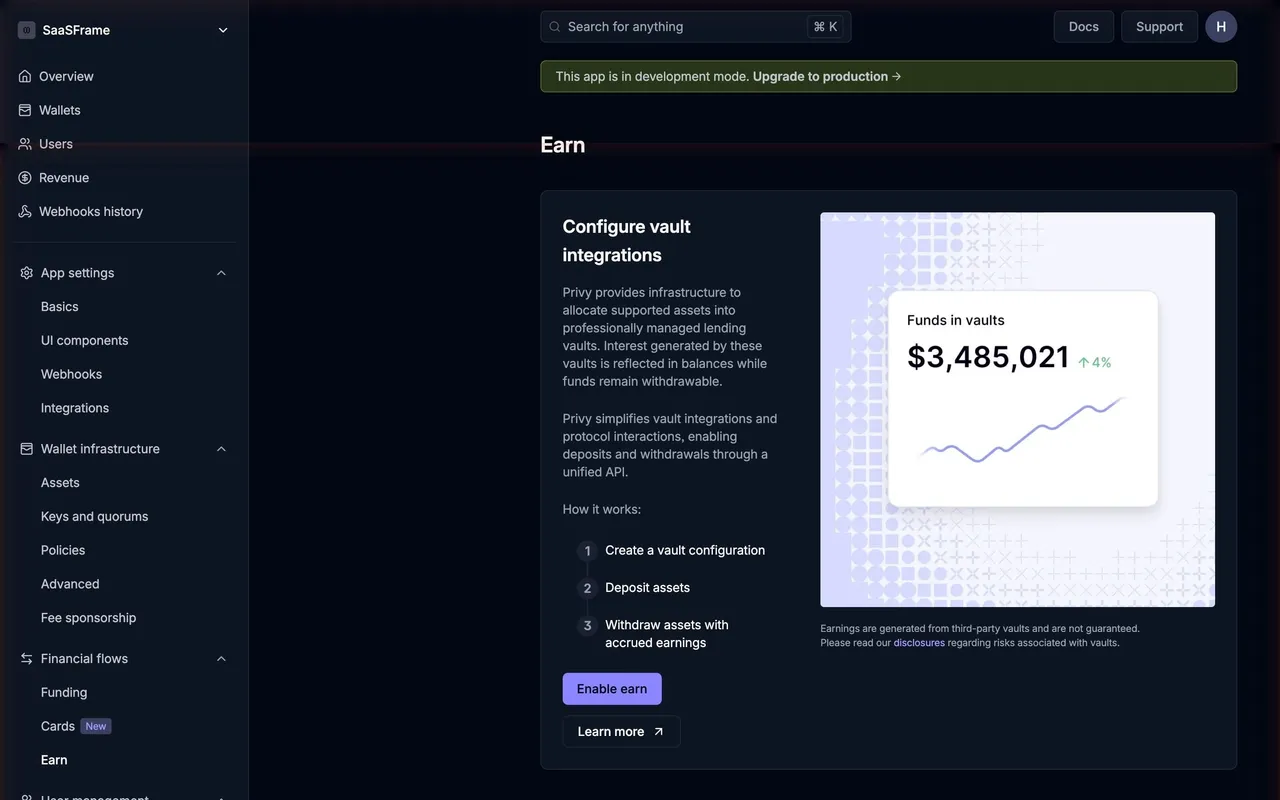
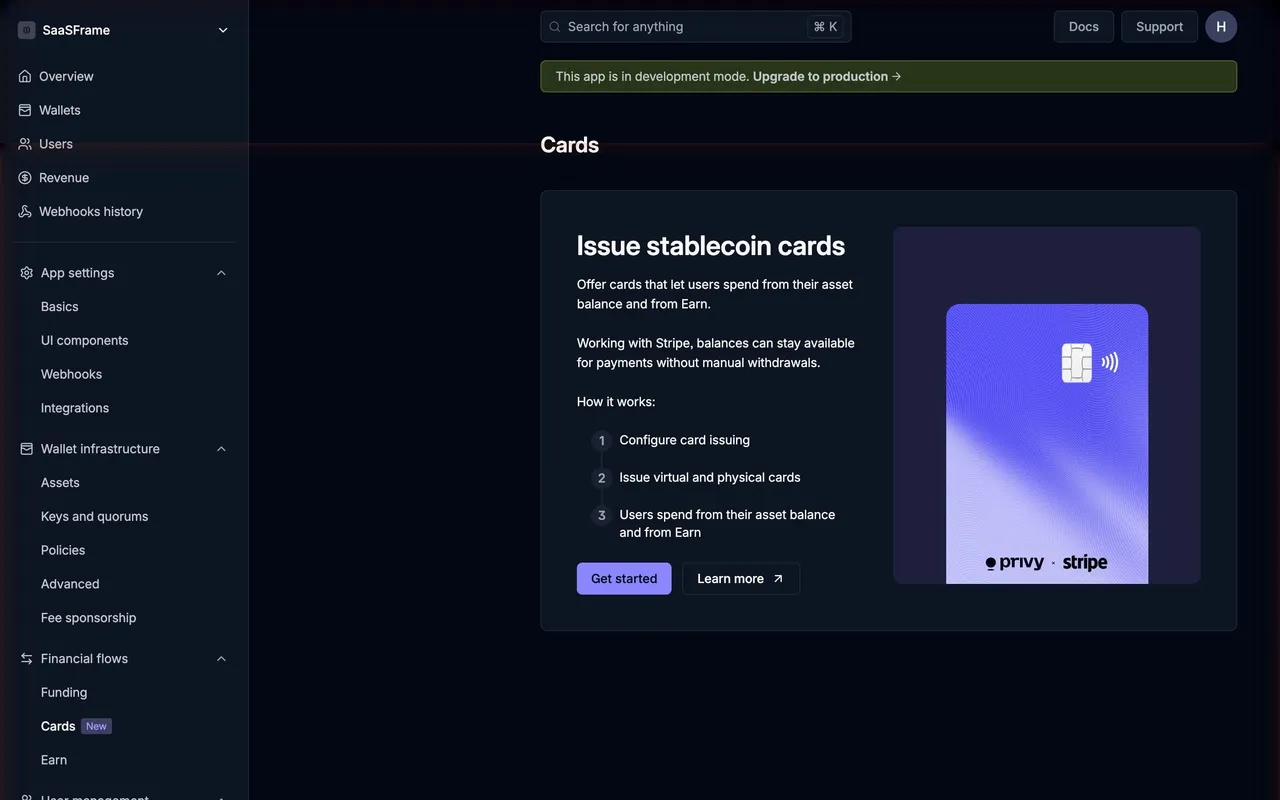
## Privy dashboard (dashboard.privy.io) — product UI

- **Auth and onboarding**: white cards on a grainy lilac gradient (#FEF4FF to #E2E3F0), Inter 30px/42px w600 titles in #040217, 44px black pill buttons (#020713, 9999px radius), inputs with inline "Required" tags, violet links #5B4FFF.
- **Dashboard theme**: dark navy, page #020713, cards #0E1522 with #384060 / #1A2230 borders, text #F8F8F8 / #C0C4CC / #9BA2AE, violet accent #8B86FF for primary buttons and #A29EFF for links; green development-mode banner (#273517).
- **Shell**: ~280px sidebar with app switcher and collapsible groups (App settings, Wallet infrastructure, Financial flows, User management); top bar with "Search for anything ⌘K", Docs, Support and avatar; content column ~896px.
- **Components**: Inter 24px w600 page titles, underline tabs, toggle rows for settings, 6px-radius cards, promo panels with numbered "How it works" steps and an illustration on the right.

### Overall aesthetic
- **Style:** dark analytics page in an empty state.

### Page composition
- **Main:** title, tabs, range row, three metric cards, chart card, two breakdown cards.

### Typography
- **Title:** Inter 24px/38px w600. **Metric values:** 30px w600. **Labels:** 14px #C0C4CC.

### Colors & surfaces
- **Cards:** #0E1522 with #1A2230 borders; placeholder bars in grey gradient; selected segment #384060.

### Components
- **Segmented control:** four options.
- **Placeholder chart:** symmetrical grey bars with caption.

### Responsive
- **Desktop only:** captured at 1440px.

### Adaptation guidance
- **Lesson:** draw a ghost chart in empty states so users understand what will appear.

## Content

**Instructions:**

Generate realistic example content that fits the selected design reference.

Create appropriate headlines, descriptions, labels, buttons, and supporting copy based on the type of interface being designed.

If a product or business description is provided, use it to guide the content.

Otherwise, invent a plausible fictional SaaS product appropriate for the reference.

Keep the content concise, coherent, and visually balanced.

Do not present fictional statistics, customer names, or testimonials as verified facts.

## Design Direction

**Instructions:**

Use the reference screenshot as the main source of visual inspiration rather than a strict layout template.

Preserve its most distinctive design characteristics, such as typography, visual rhythm, color relationships, component treatments, and overall aesthetic.

Feel free to modify section arrangements, proportions, spacing, and individual components to better suit my content.

Introduce original design decisions where they improve usability, composition, or brand consistency.

The result should clearly reflect the reference's visual language without looking like a direct reproduction.

Follow the visual identity of the reference design.

Use its typography, color palette, component styling, and overall aesthetic as the primary design direction.

Do not introduce an unrelated visual identity.

## Output

**Instructions:**

Generate a high-fidelity visual mockup of the requested interface.

Present the design as a polished, realistic website or product UI screenshot.

Prioritize visual composition, typography, spacing, colors, alignment, and component details.

Use the available image-generation or visual-design capabilities.

Do not replace the mockup with source code, a written design specification, or a textual description.

If direct visual generation is unavailable, clearly explain the limitation.

## Constraints

- Use the actual screenshot as the primary visual reference.
- Preserve essential messaging and factual accuracy.
- Prioritize visual quality and consistency.
- Do not invent unsupported product claims.
- Adapt structure and copy length for visual balance.
Reference image Attach it to your message: assistants can’t open image links. Open in ChatGPT ↗ Open in Claude ↗
Build it in Lovable ↗ v0 ↗ Figma Make ↗
Opening a tool copies the screenshot so you can paste it with your prompt.
 SaaSFrame