 SaaSFrame

About this screen
Four layers of filters
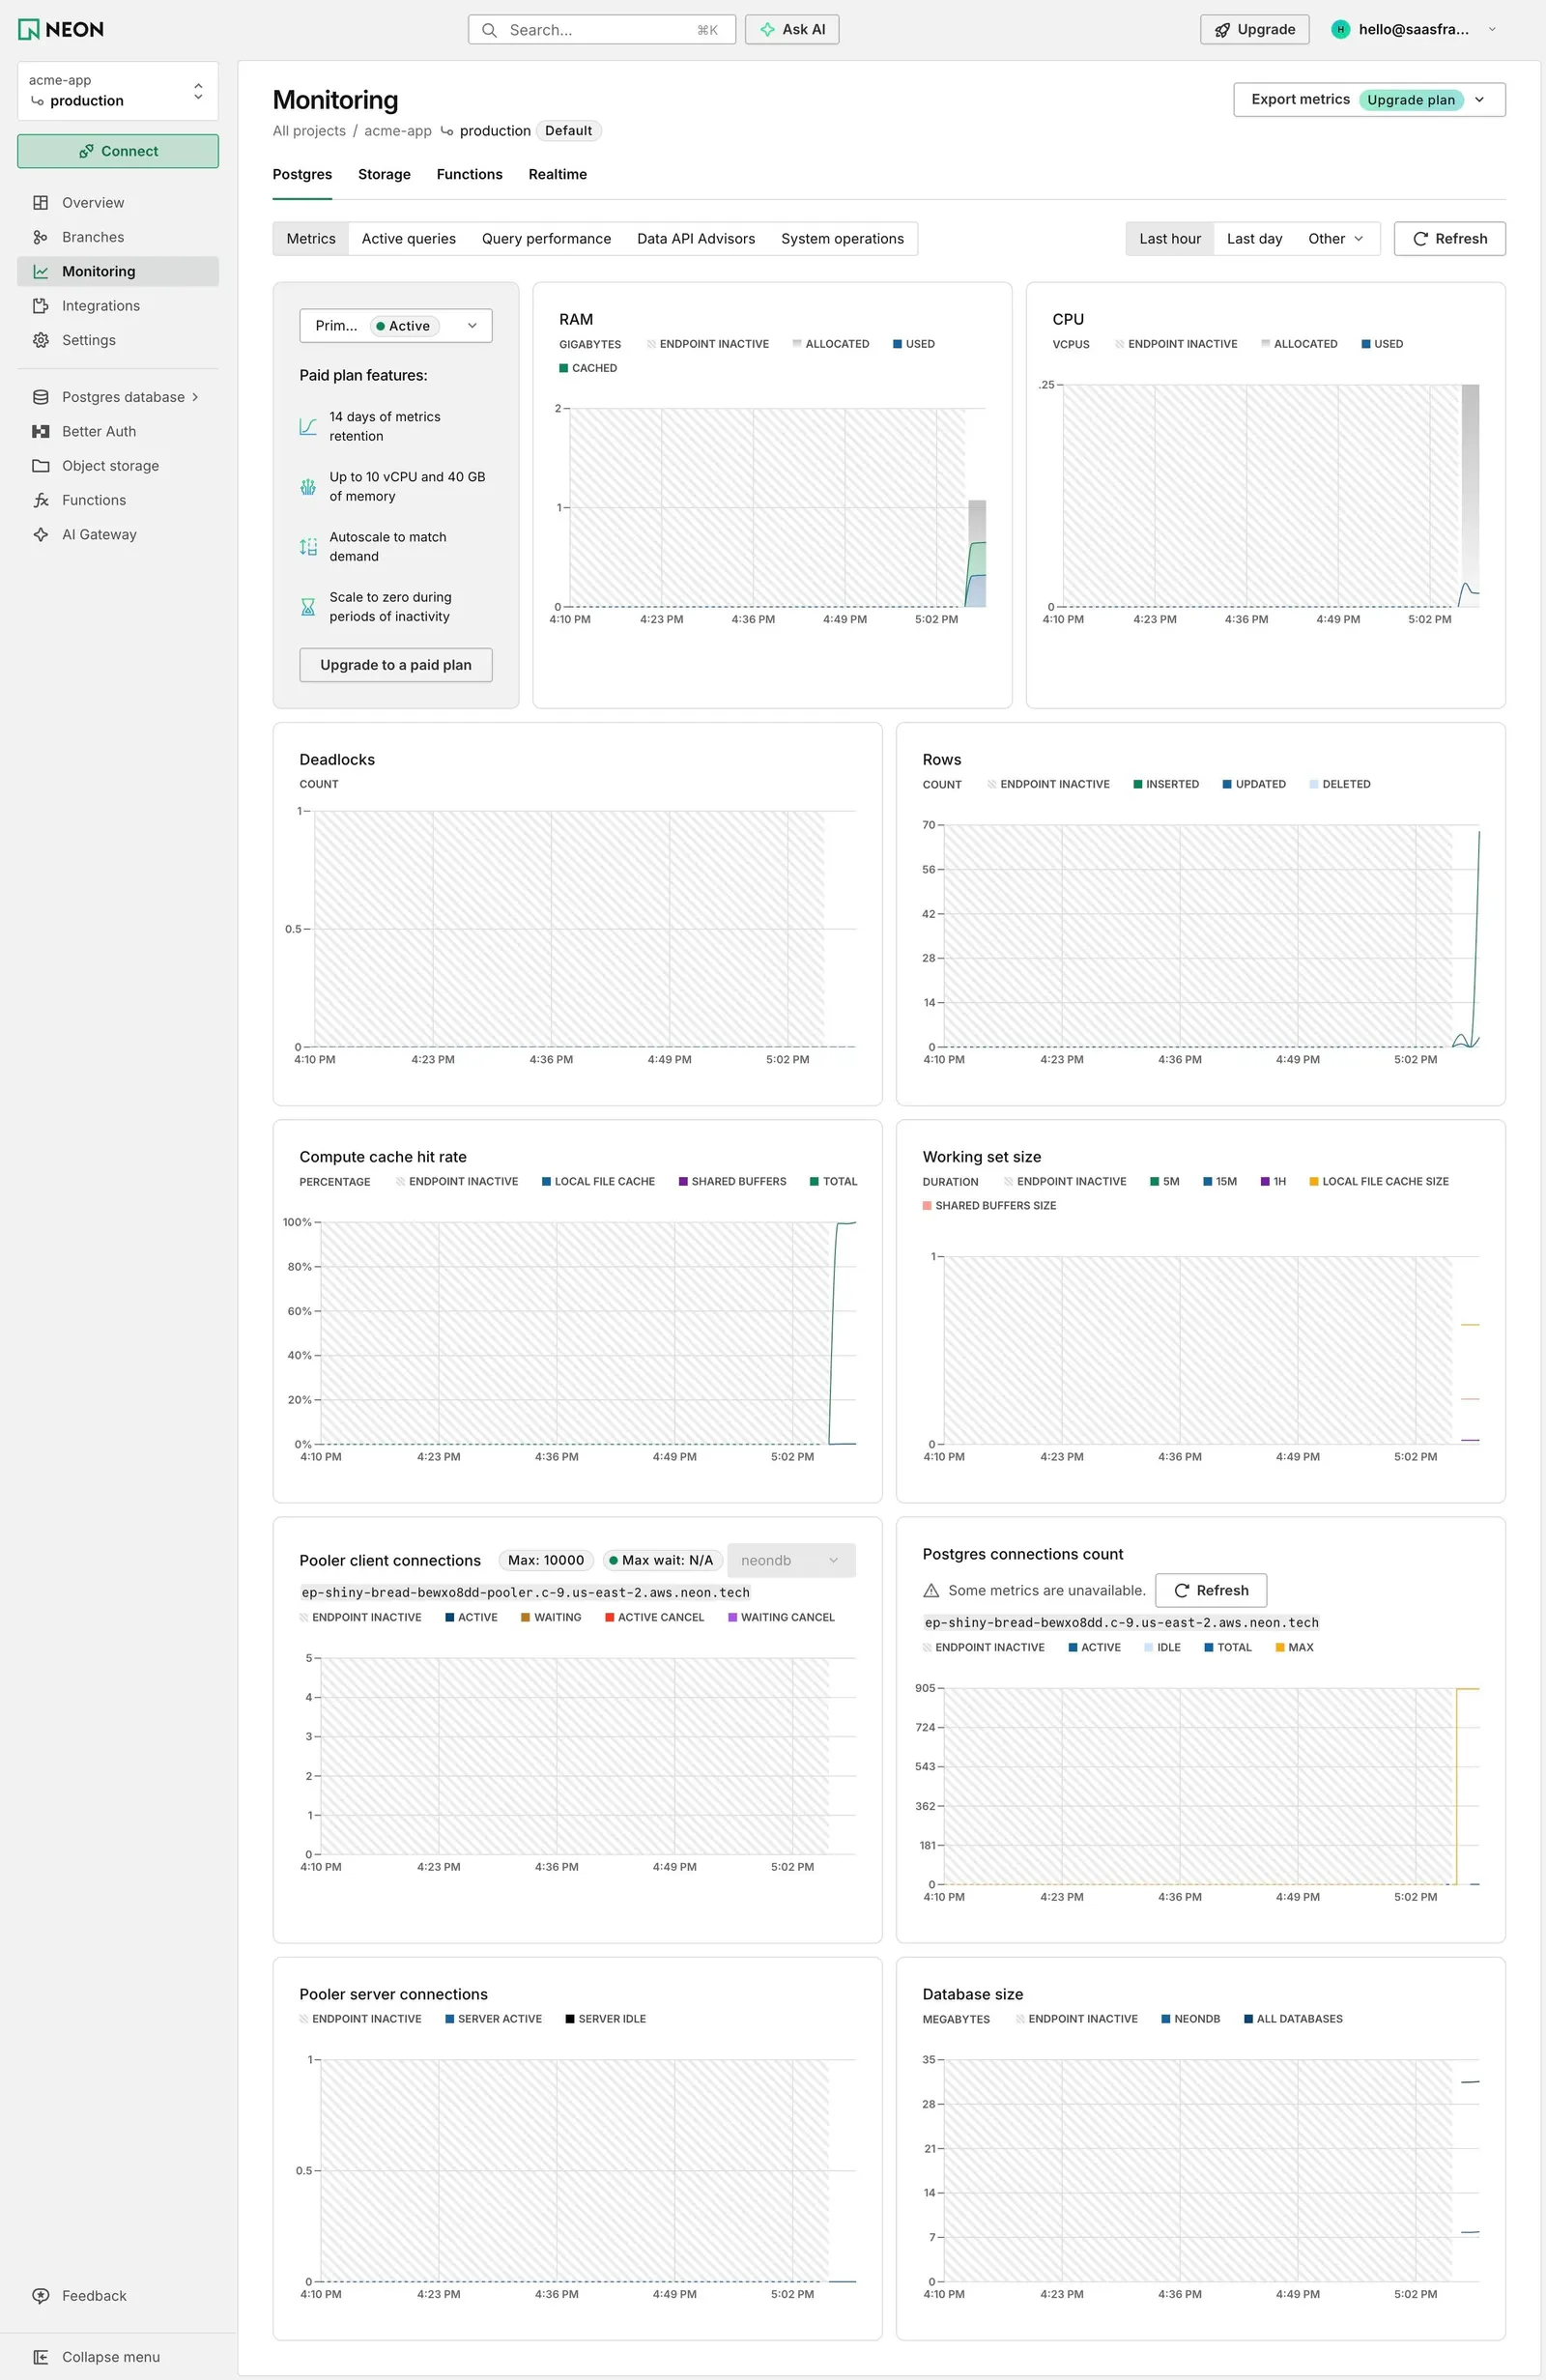
Neon's Monitoring page for the production branch stacks tabs for Postgres, Storage, Functions and Realtime, a segmented control for Metrics, Active queries, Query performance, Data API Advisors and System operations, and a time range of "Last hour", "Last day" or "Other" with "Refresh".
Inactivity drawn as hatching
A grid of chart cards covers RAM, CPU, Deadlocks, Rows, Compute cache hit rate, Working set size, Pooler client connections, Postgres connections count, Pooler server connections and Database size. Periods when the endpoint was inactive are filled with diagonal grey hatching, and each chart has an uppercase legend.
The upsell sits among the charts
The first card is a grey panel listing paid plan features (14 days of metrics retention, up to 10 vCPU and 40 GB of memory, autoscaling, scale to zero) with "Upgrade to a paid plan". "Export metrics" in the header carries a mint "Upgrade plan" tag.