 SaaSFrame
About this section
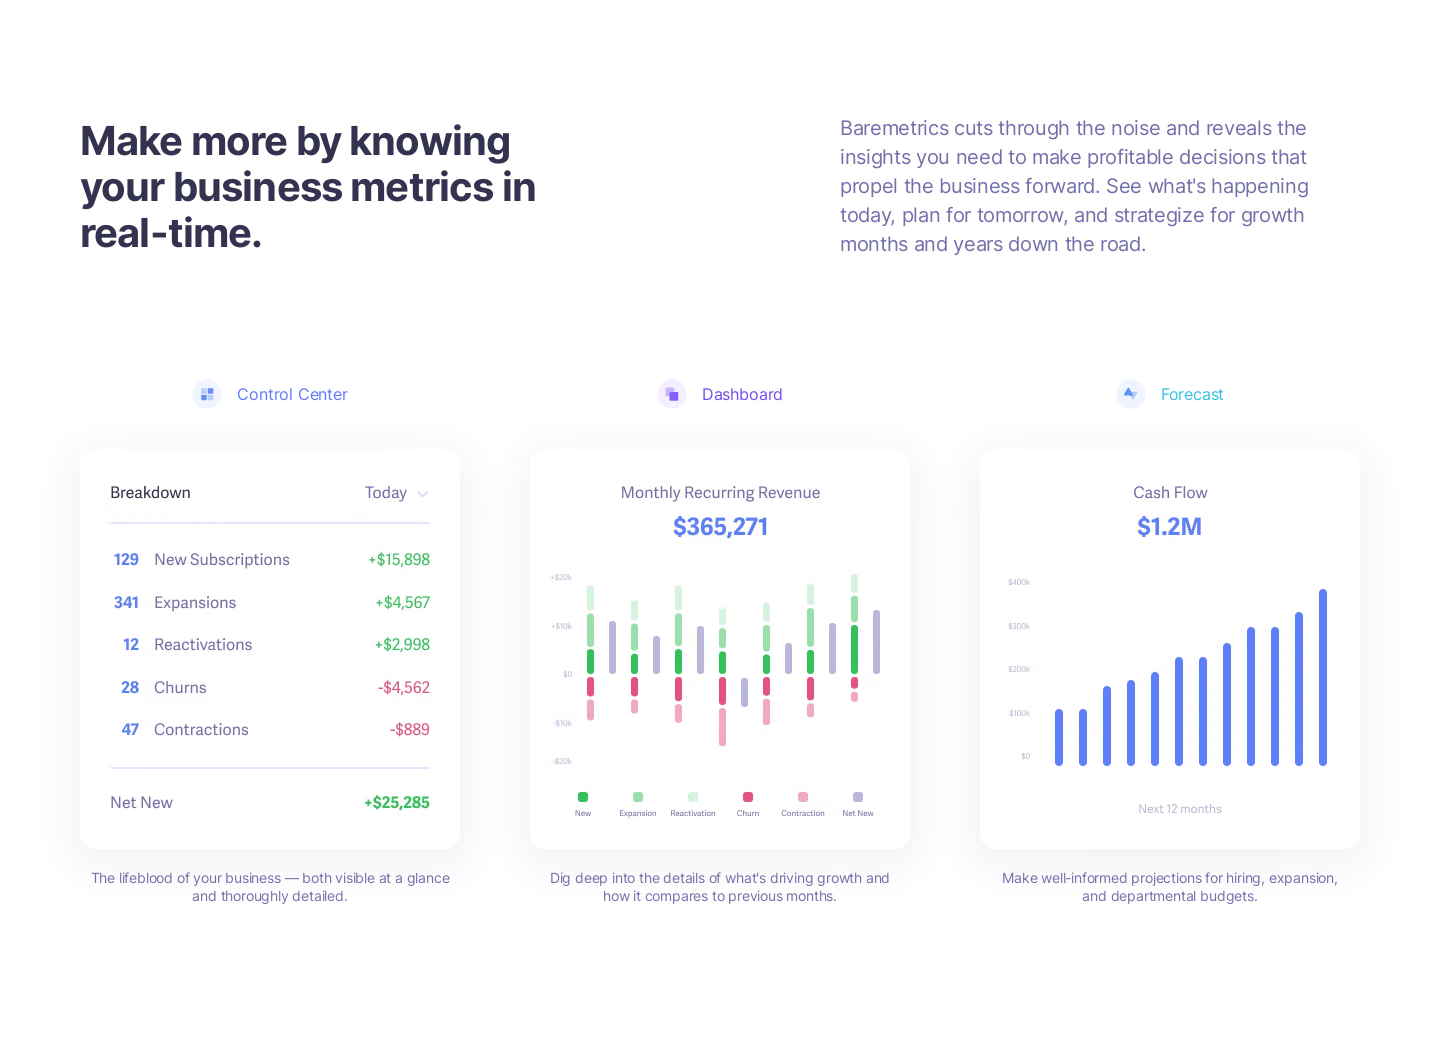
Baremetrics' charts section splits a navy headline and a muted paragraph across two columns above three dashboard cards. The cards show a breakdown list of subscription movements, a monthly recurring revenue chart with green and red bars, and a cash flow forecast in blue columns. Each card has a small icon label above it and a two-line caption below.