 SaaSFrame
About this section
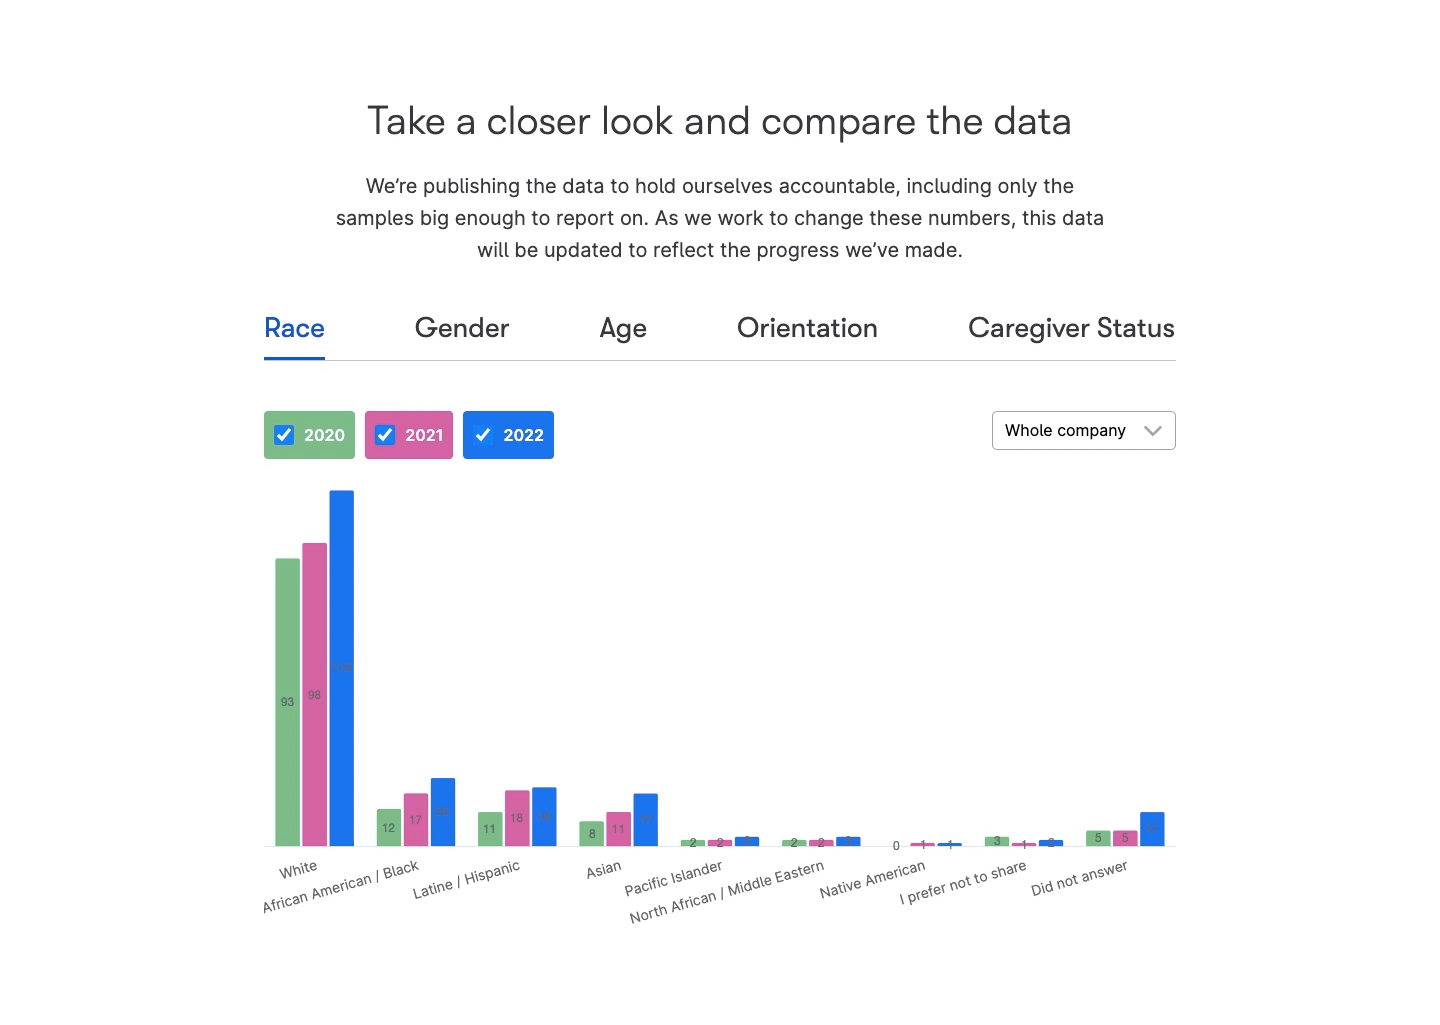
Wistia's charts section centers a thin headline and a paragraph on publishing diversity data, above underlined category tabs and a grouped bar chart. Tabs cover race, gender, age, orientation and caregiver status, and the chart compares three years with green, pink and blue bars, toggled by colored checkbox chips. A dropdown filters by team, keeping the data front and center.