 SaaSFrame
SaaSFrame Pro
4 more steps in this flow
Free accounts see the first 3 steps of each flow. Pro unlocks every step of every flow, plus every screen, section and Copy in Figma.

Kinsta Analytics
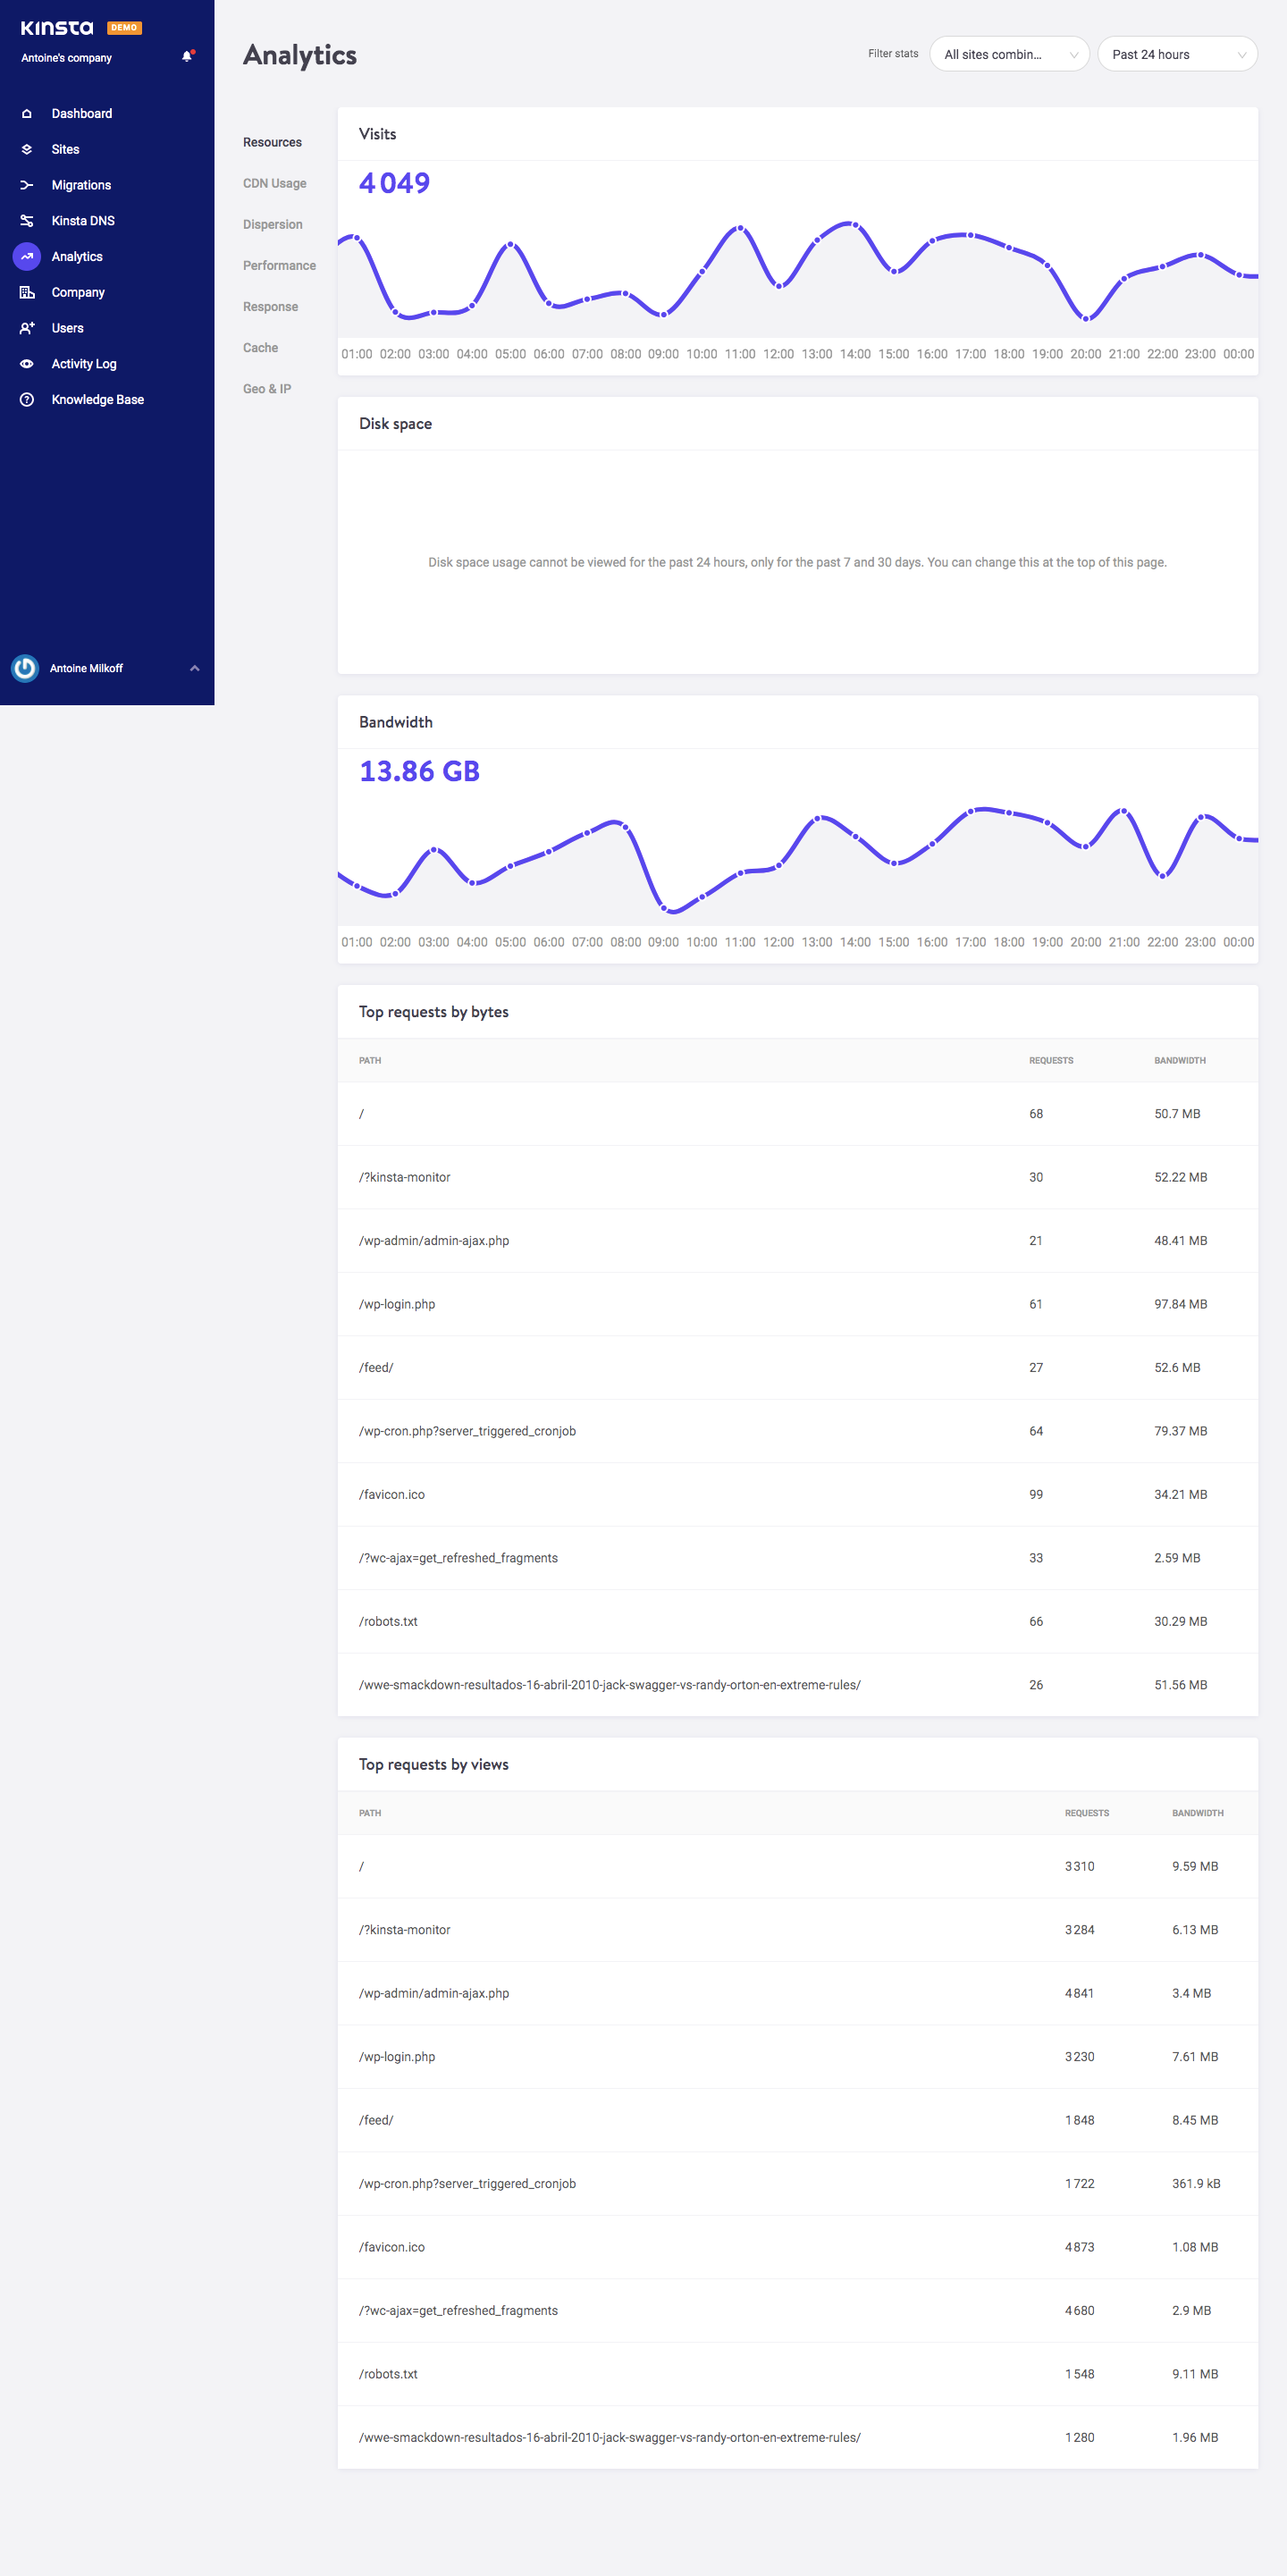
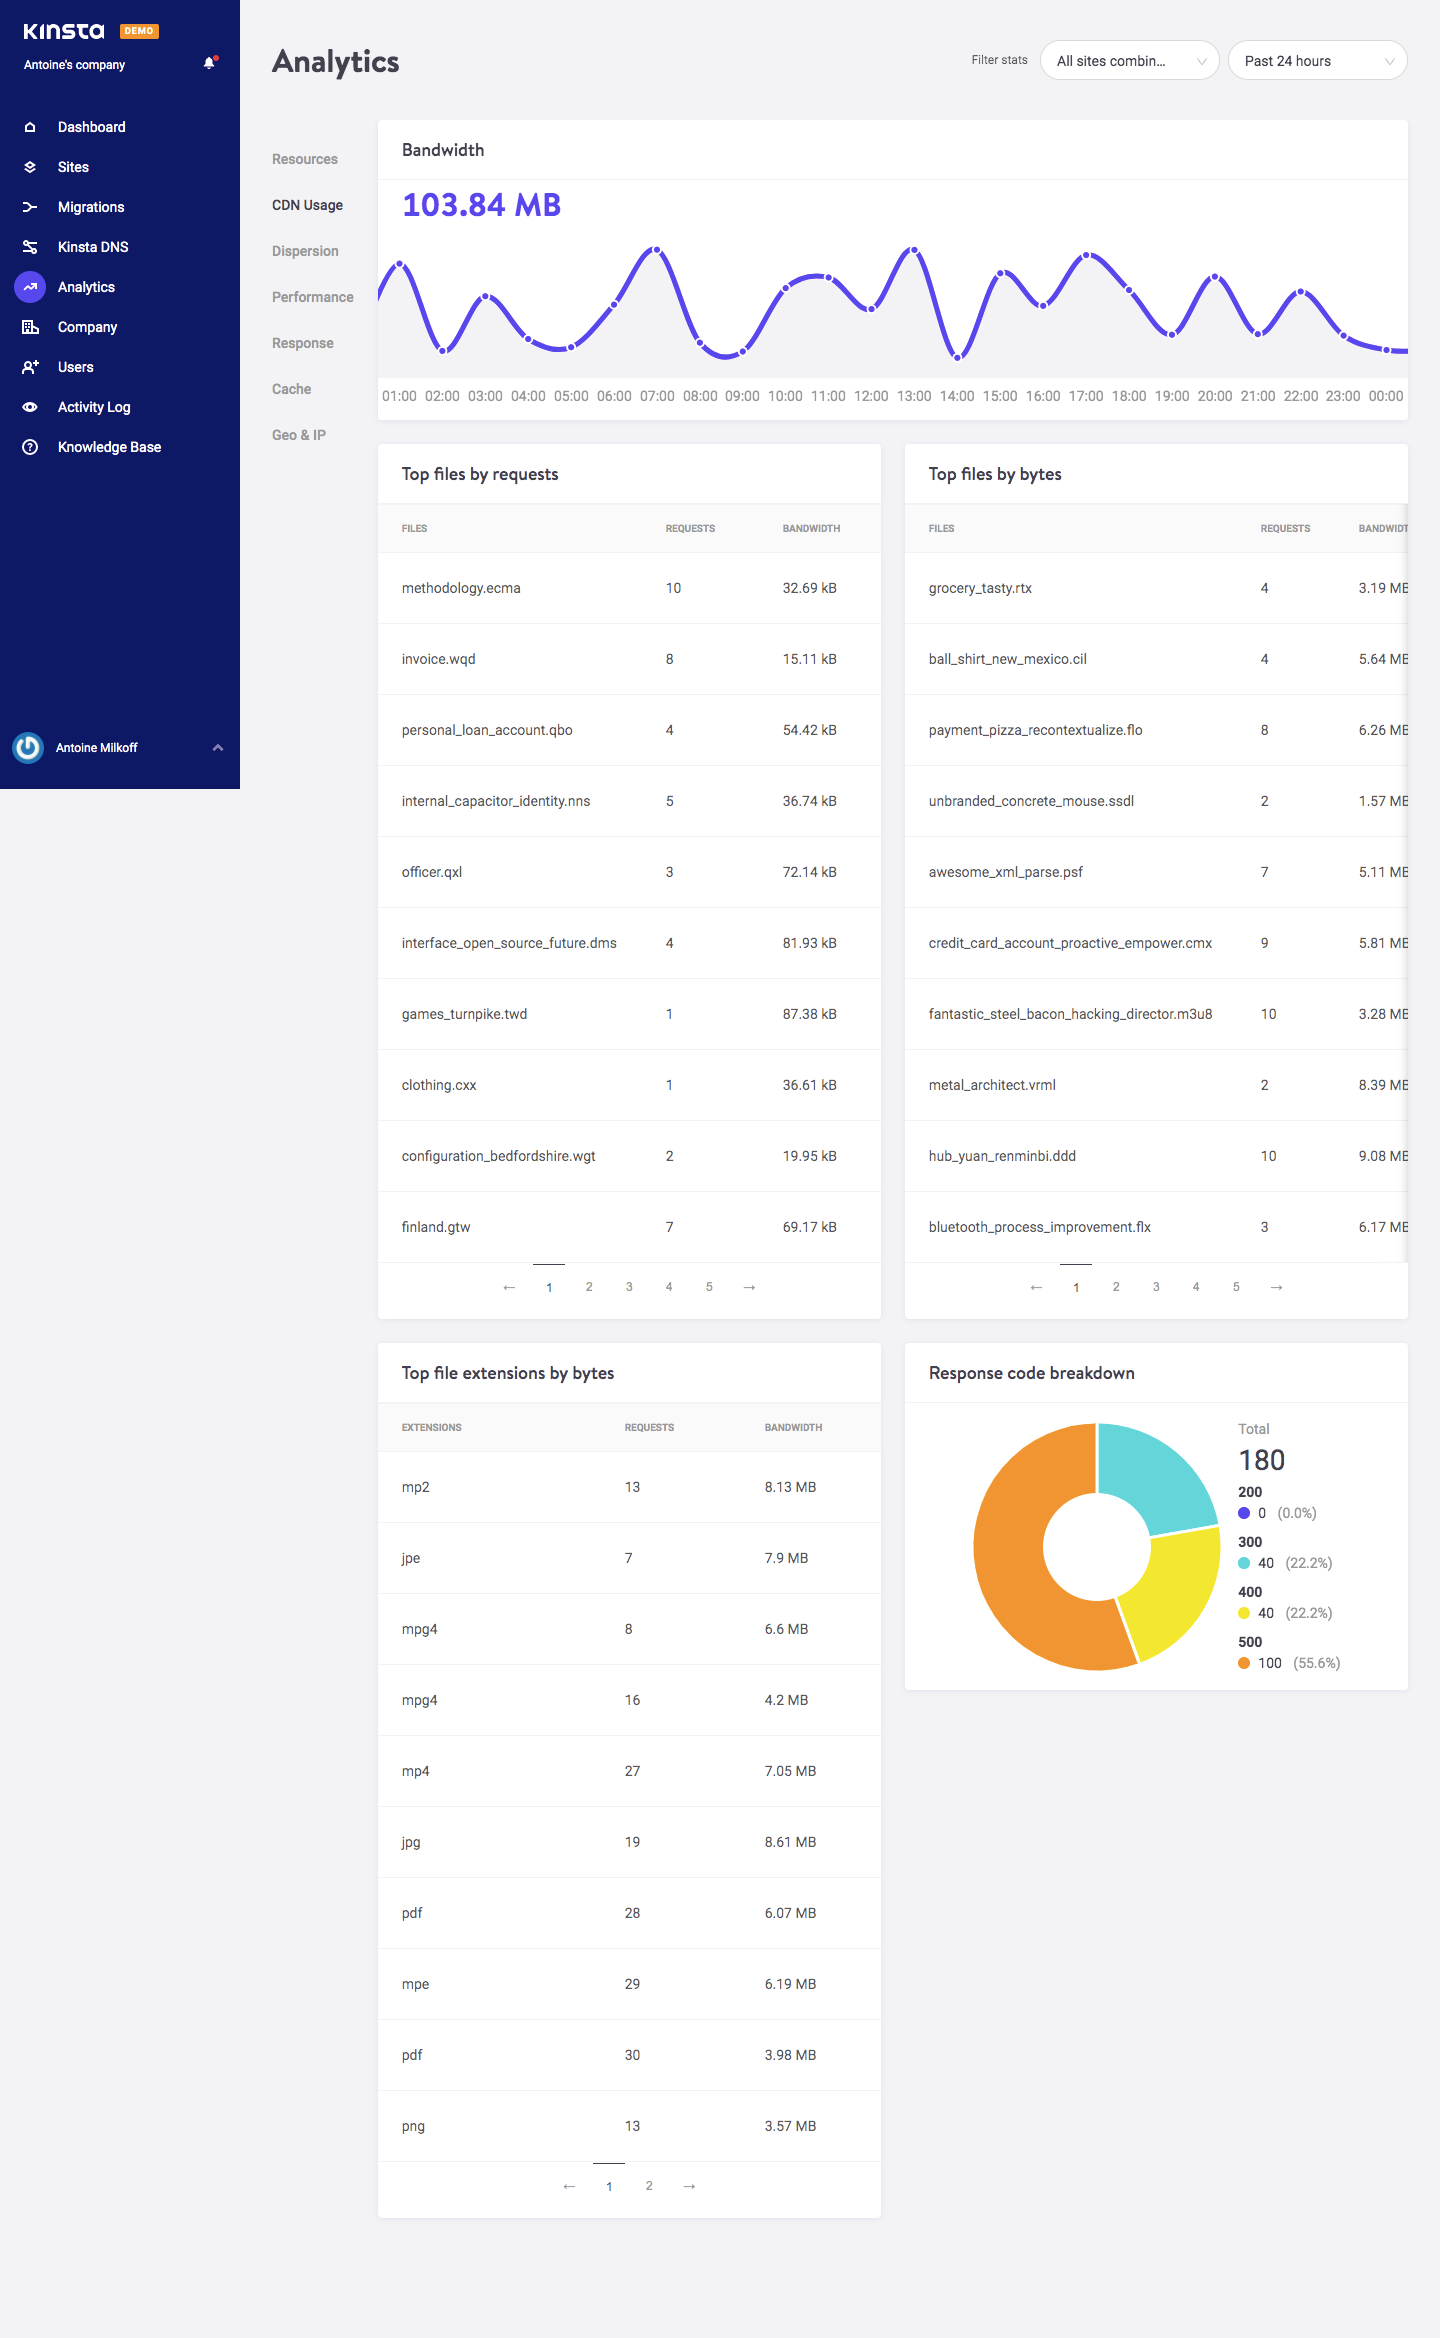
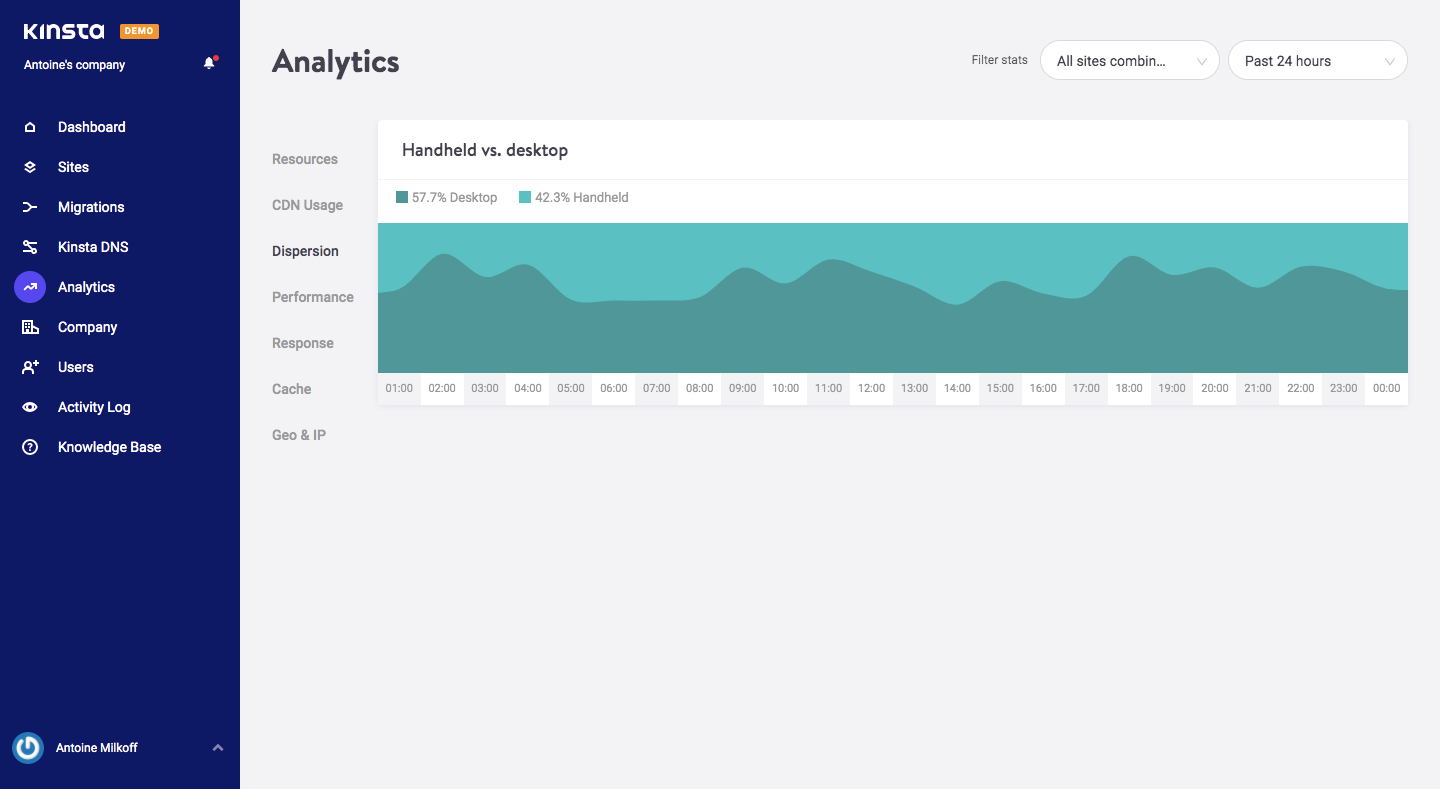
Kinsta's analytics section splits hosting data into seven tabbed reports, from resources and CDN usage to cache and geo traffic, beside a navy sidebar. Every screen shares the same frame: a secondary tab list on the left, filters at the top right and white cards on a light grey canvas. Purple line charts dominate early tabs, while response and cache reports add donuts, stacked bars and ranked tables.
Follow Kinsta’s analytics flow step by step: 7 real screens captured from the live product, from analytics: resources to analytics: geo and ip. Use ← → to move between steps, and open any screen to see it in full.