 SaaSFrame
1 more step in this flow
Free accounts see the first 3 steps of each flow. Pro unlocks every step of every flow, plus every screen, section and Copy in Figma.

Buffer Analytics
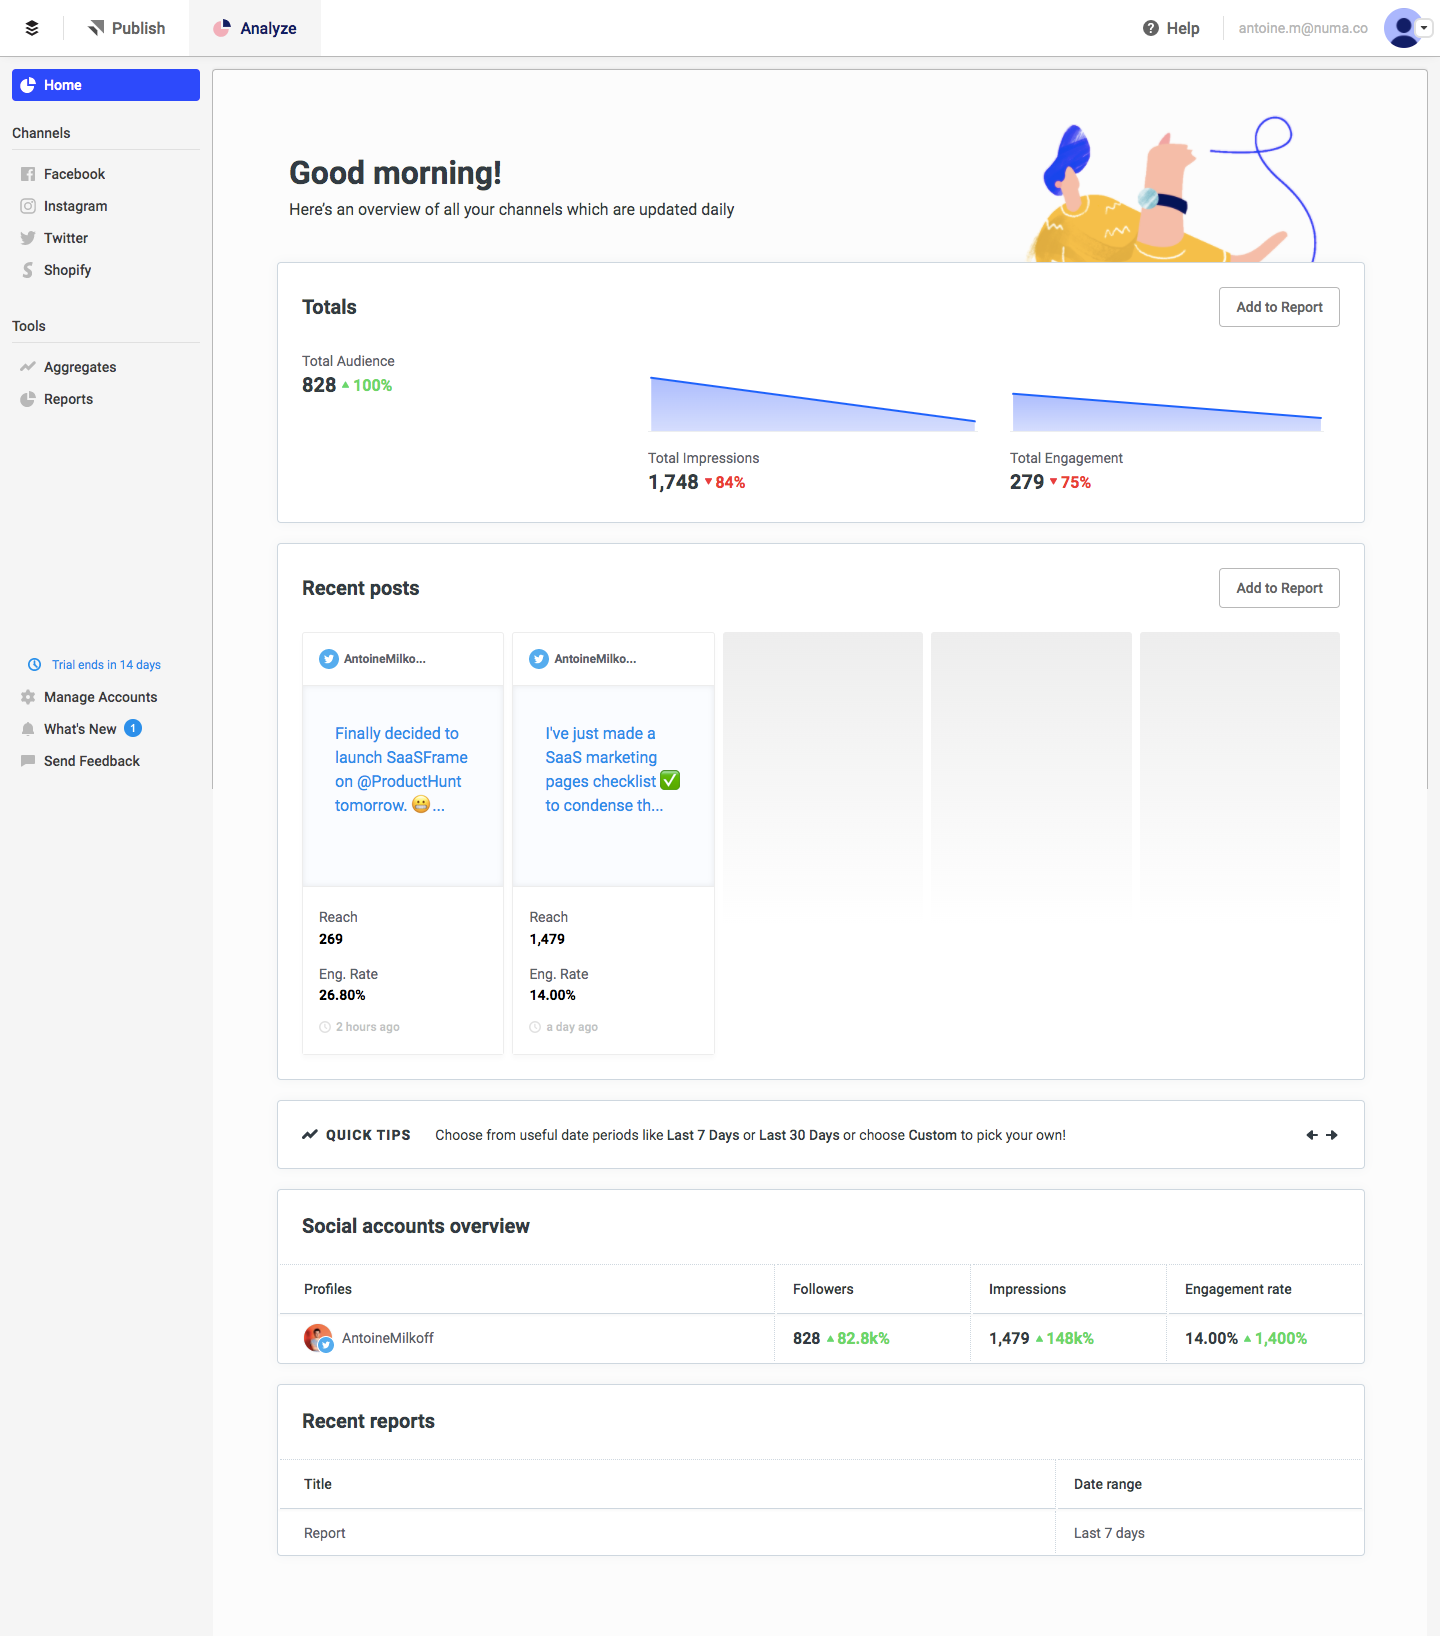
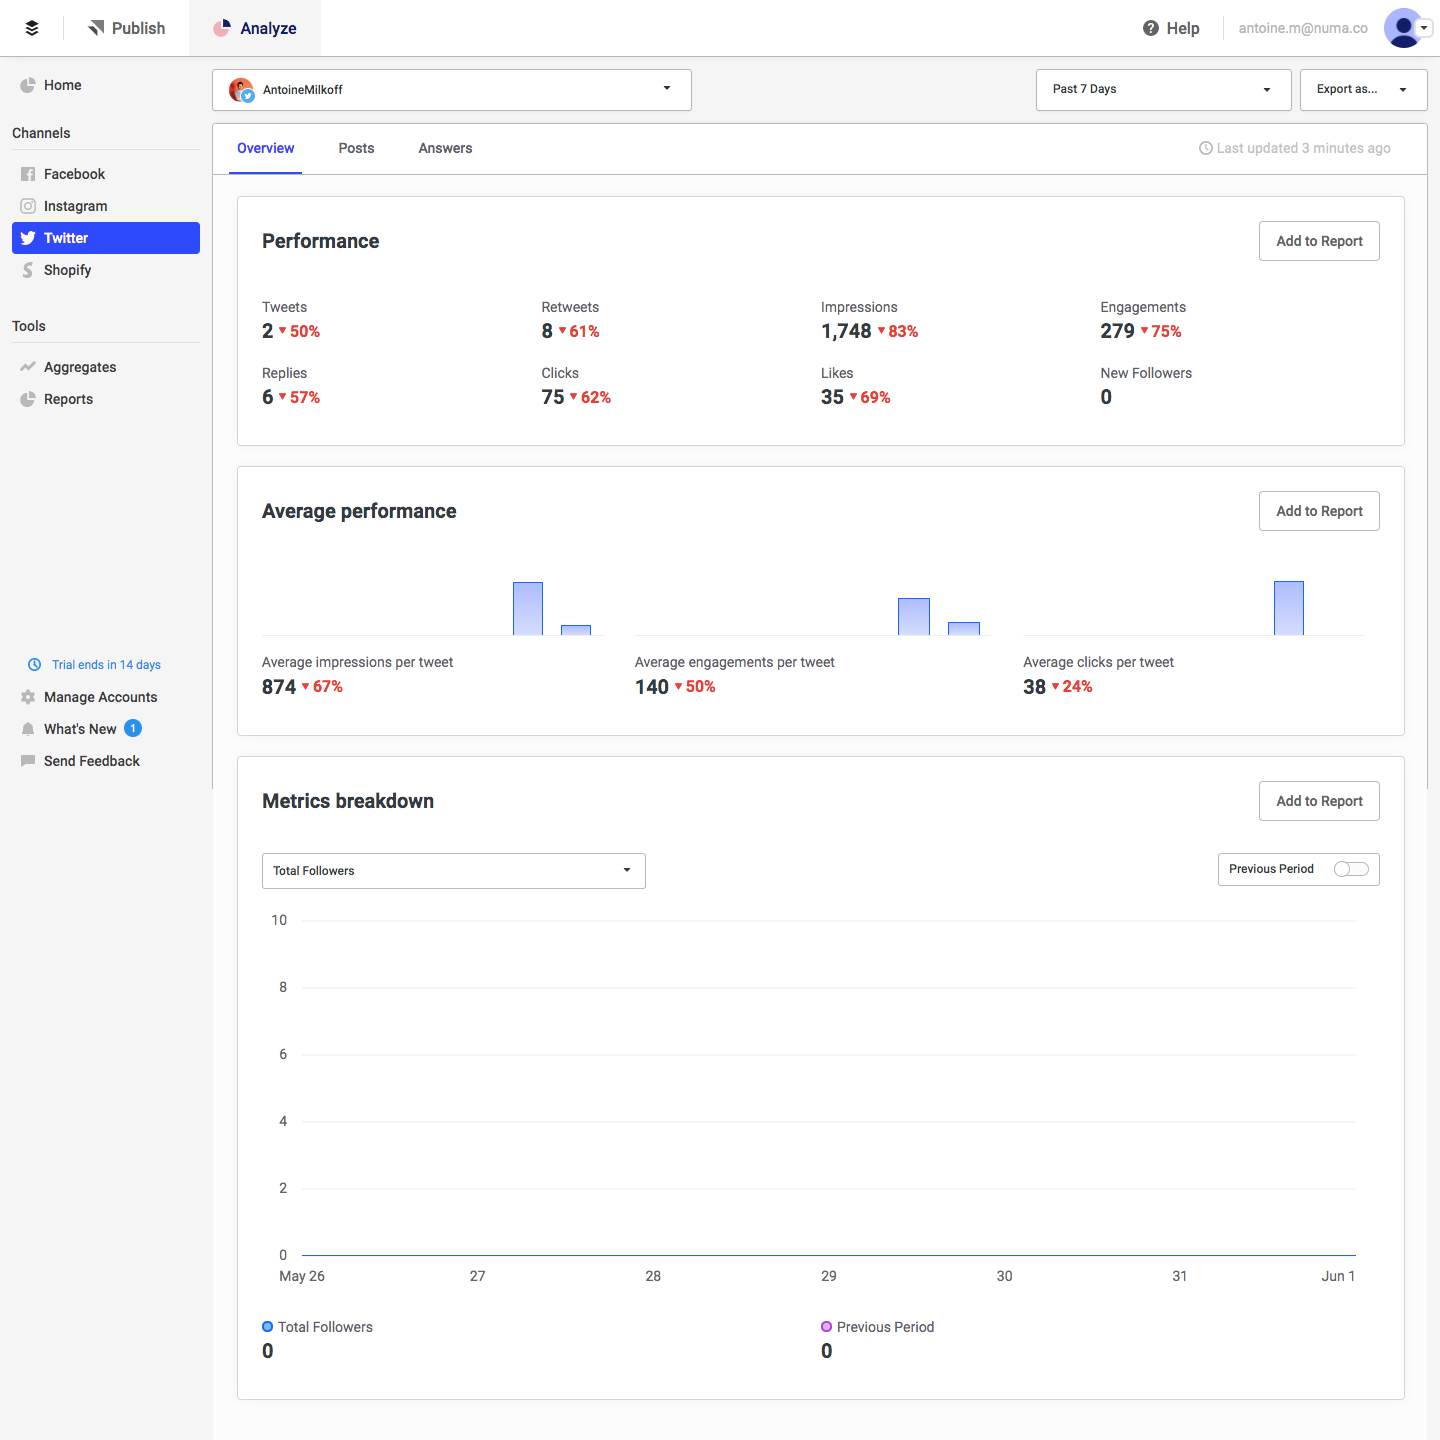
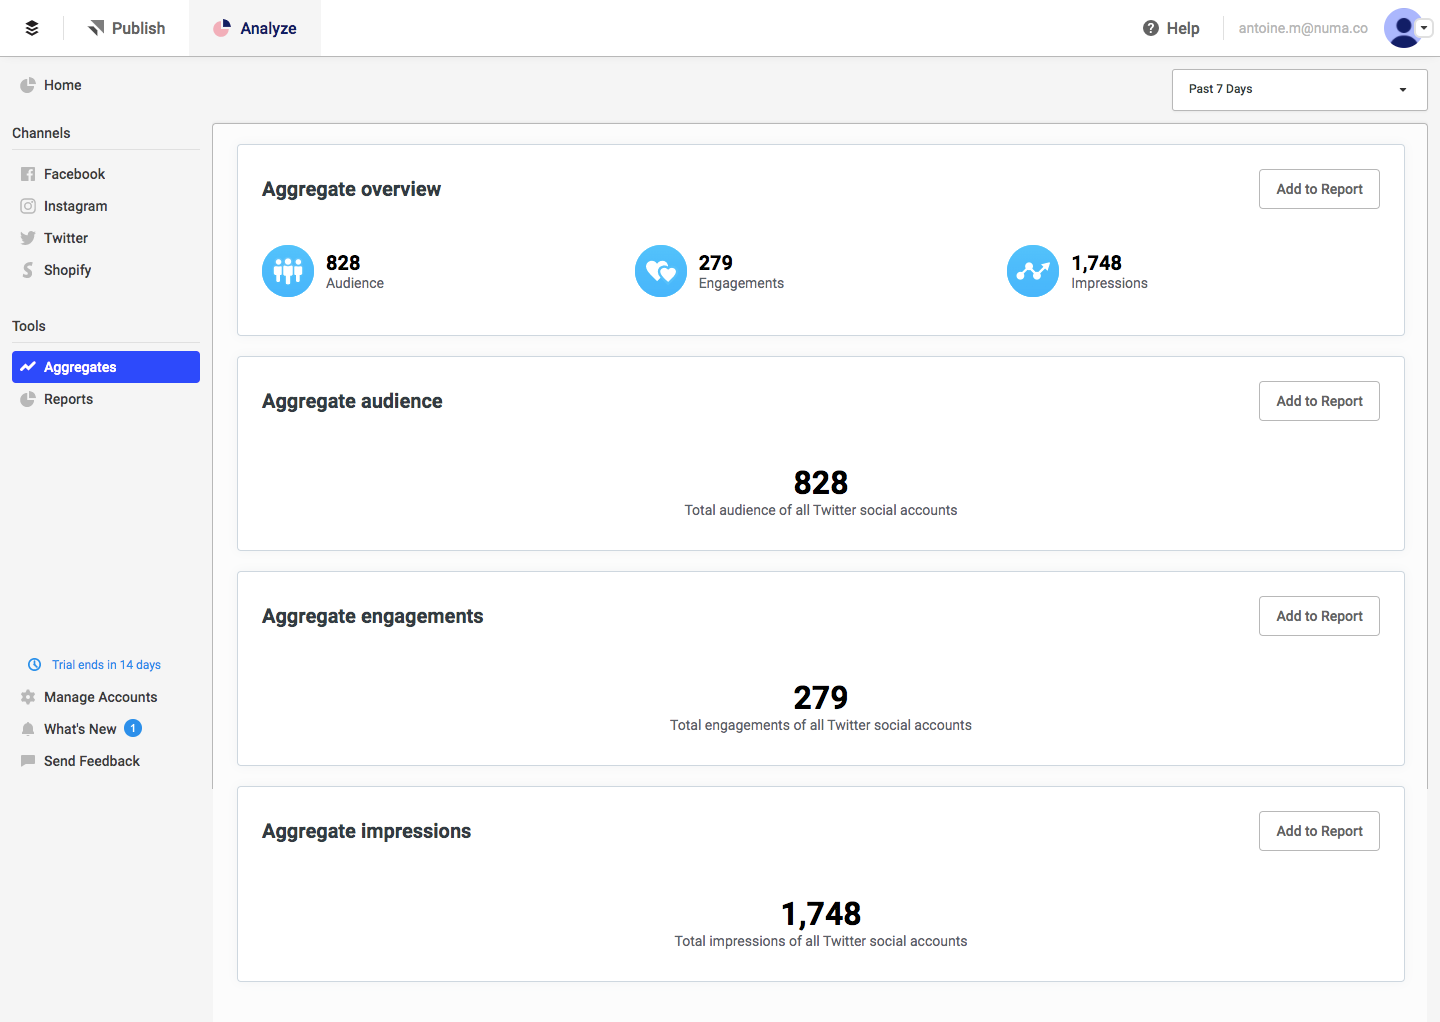
Buffer's analytics flow moves from a channel overview to Twitter metrics, aggregated stats and a custom report in four clean dashboard screens. A left sidebar lists channels and tools while white cards hold totals with small blue area charts and green or red trend figures. Every card has an Add to Report button, and the final report screen gathers selected cards under a title, date range and logo upload slot.
Follow Buffer’s analytics flow step by step: 4 real screens captured from the live product, from analytics: overview to analytics: report. Use ← → to move between steps, and open any screen to see it in full.